

Abstract
Background
As a neurotrophic factor, prosaposin (PSAP) can exert neuroprotective and neurotrophic effects. It is involved in the occurrence and development of prostate and breast cancer. However, there is no research about the role of PSAP in glioma.
Methods
The PSAP overexpressed or silenced glioma cells or glioma stem cells were established based on Lentiviral vector transfection. Cell viability assay, Edu assay, neurosphere formation assay and xenograft experiments were used to detect the proliferative ability. Western blot, Elisa and luciferase reporter assays were used to detect the possible mechanism.
Findings
Our study firstly found that PSAP was highly expressed and secreted in clinical glioma specimens, glioma stem cells, and glioma cell lines. It was associated with poor prognosis. We found that PSAP significantly promoted the proliferation of glioma stem cells and cell lines. Moreover, PSAP promoted tumorigenesis in subcutaneous and orthotopic models of this disease. Furthermore, GSEA and KEGG analysis predicted that PSAP acts through the TLR4 and NF-κB signaling pathways, which was confirmed by western blot, immunoprecipitation, immunofluorescence, and use of the TLR4-specific inhibitor TAK-242.
Interpretation
The findings of this study suggest that PSAP can promote glioma cell proliferation via the TLR4/NF-κB signaling pathway and may be an important target for glioma treatment.
Fund
This work was funded by National Natural Science Foundation of China (Nos. 81101917, 81270036, 81201802, 81673025), Program for Liaoning Excellent Talents in University (No. LR2014023), and Liaoning Province Natural Science Foundation (Nos. 20170541022, 20172250290). The funders did not play a role in manuscript design, data collection, data analysis, interpretation nor writing of the manuscript.
Keywords: Glioma, Glioma stem cells, Prosaposin, Proliferation, Tumorigenesis
Research in context.
Evidence before this study
Glioma is the most common primary malignant tumor of the central nervous system. Current treatment approaches (i.e., surgery, radiotherapy, and chemotherapy) are not ideal, and the average survival time of patients is <15 months. The regulation and intervention of glioma-related secretory proteins may be an important target for the treatment of this disease. A conserved glycoprotein, Prosaposin (PSAP) can act as a neurotrophic factor and participate in the metabolism of sphingomyelin and ceramide. Overexpression and secretion of PSAP are correlated with tumorigenesis in prostate and breast cancer. Furthermore, PSAP can cause tolerance to endocrine therapy in breast cancer via androgen receptor activation. In addition, PSAP is highly expressed in gallbladder cancer and is expected to become a biomarker of that disease. However, as neurotrophic factor, the role of PASP in glioma is still not completely clear.
Added value of this study
Our study found abnormally high PSAP expression levels in glioma through bioinformatics analysis and confirmed that PSAP could promote the growth of glioma. KEGG and GSEA analysis also revealed that PSAP is involved in the TLR4 signaling pathway. Because TLR4 is stimulated by different ligands, it has multiple regulatory roles in glioma. This study suggests that overexpression of PSAP promotes glioma growth and tumorigenesis through activation of the TLR4/NF-κB signaling pathway. PSAP may be an possible target in glioma treatment.
Implications of all the available evidence
We confirmed that PSAP is overexpressed in glioma, and can bind to TLR4 to activate the NF-κB signaling pathway, which may induce the synthesis and secretion of inflammatory factors and promote the growth of glioma stem cells and tumor cells. PSAP may be an important target for inhibiting glioma growth and improving glioma prognosis.
Alt-text: Unlabelled Box
1. Introduction
Glioma is the most common primary malignant tumor of the central nervous system. Current treatment approaches (i.e., surgery, radiotherapy, and chemotherapy) are not ideal, and the average survival time of patients is <15 months [1]. Recent studies have shown that gliomas can promote their own growth, angiogenesis, and invasion by the release of a series of autocrine or paracrine secretory proteins (e.g., growth factors and cytokines), which can also contribute to treatment tolerance [2,3]. For example, glioma can promote its proliferation and tumorigenesis by secreting the Wnt secretion protein Evi/Gpr177 [4]. Glioma also promotes mesenchymal transition and invasion by the secretion of TGF-β [5]. Therefore, the regulation and intervention of glioma-related secretory proteins may be an important target for the treatment of this disease [6,7].
Prosaposin (PSAP) is a conserved glycoprotein with multiple functions, including a role in the metabolism of sphingomyelin and ceramide [8,9]. Secretory PSAP is found in blood, cerebrospinal fluid, milk, semen, and other body fluids, where it acts as a neurotrophic factor [[10], [11], [12]]. Complete PSAP deletion is lethal in both human and mouse [13]. Even partial deletion can lead to severe neurodegenerative diseases, lysosomal storage disorder, and lipid storage disease [[14], [15], [16]]. PSAP exists mainly as a secretory type in the central nervous system [10,17]. It is highly expressed in the neuroglia of the brain stem, hypothalamus, cerebellum, and hippocampus [[18], [19], [20]]. When the body suffers a serious nerve function injury, brain injury, or neurotoxicity, the synthesis of PSAP significantly increases, and it plays a role in neuroprotection and promotes repair and regeneration of neurons [[21], [22], [23]]. Although PSAP has important physiological functions, overexpression and secretion of PSAP are correlated with tumorigenesis. For example, abnormal PSAP expression promotes prostate cancer cell proliferation and anti-apoptosis through the androgen receptor and androgen-related genes [13,24]. In breast cancer, secretory PSAP promotes the growth of breast cancer by the upregulation of estrogen receptor alpha and activation of the MAPK signaling pathway [25]. Furthermore, PSAP can cause tolerance to endocrine therapy in breast cancer via androgen receptor activation [26]. In addition, PSAP is highly expressed in gallbladder cancer and is expected to become a biomarker of that disease [27].
Our study found abnormally high PSAP expression levels in glioma through bioinformatics analysis and confirmed that PSAP could promote the growth of glioma. KEGG and GSEA analysis also revealed that PSAP is involved in the TLR4 signaling pathway. Toll-like receptors (TLRs) belong to a class of pattern recognition receptors (PRRs), which can identify pathogen-associated molecular patterns (PAMPs) and damage-associated molecular patterns (DAMPs) [28,29]. Because TLR4 is stimulated by different ligands, it has multiple regulatory roles in glioma [28,30]. This study suggests that overexpression of PSAP promotes glioma growth and tumorigenesis through activation of the TLR4/NF-κB signaling pathway.
2. Materials and methods
2.1. Cell culture and cell treatment
The human glioma cell line T98G was purchased from American Type Culture Collection (ATCC, Manassas, VA, USA). U87 and U251 cells were purchased from the Chinese Academy of Sciences cell bank (Shanghai, China). HA, LN229, and SNB19 cells were a gift from Professor Tao Jiang, Department of Molecular Neuropathology, Beijing Neurosurgical Institute. H4 and A172 cells were purchased from iCell Bioscience Inc. (Shanghai, China). All cell lines were maintained in Dulbecco's modified Eagle's medium (DMEM, HyClone, Logan, UT, USA) supplemented with 10% fetal bovine serum (FBS, Gibco, Carlsbad, CA, USA) and 1% penicillin/streptomycin (Gibco) at 37 °C with 5% CO2. TAK-242 (MedChem Express, Monmouth Junction, NJ, USA) was used as an TLR4 inhibitor at a concentration of 10 nM.
Six patient-derived primary glioma cells from WHO grade II to IV (WHO grade II: GSC-21, GSC-22; III: GSC-31, GSC-32; IV: GSC-41, GSC-42) were performed as previously described [31]. The expression of the glioma stem cell markers, CD133 and nestin, was examined by immunofluorescence using anti-CD133 or anti-nestin antibodies (Abcam, Cambridge, UK). Immunofluorescence staining of GFAP and β III tubulin (Abcam) was used to detect the multi-lineage differentiation capacity of the GSCs.
2.2. Patients and samples
Seventy clinical samples from glioma patients and ten control samples from brain injury patients were collected from the First Affiliated Hospital of China Medical University from January 2007 to December 2011. According to the World Health Organization (WHO) classification guidelines, there were 20 cases of WHO grade II, 25 cases of WHO grade III, and 25 cases of WHO grade IV. Two neuropathologists verified the histological diagnosis of each sample. This study was approved by the ethics committee of the First Affiliated Hospital of China Medical University and written informed consent was obtained from each patient.
2.3. Lentiviral vector construction and transfection
PSAP RNAi of and the lentiviral vector for PSAP overexpression, siRNA TLR4 were generated by Gene-Chem (Shanghai, China). Two siRNA sequences were designed for PSAP silencing: forward 5’-CCGAACAUGUCUGCUUCAUTT-3′, reverse 5’-AUGAAGCAGACAUGUUCGGTT-3′ and forward 5’-CCCAGCAAAGUCUGAUGUUTT-3′, reverse 5’-AACAUCAGACUUUGCUGGGTT-3′. The siRNA sequences for TLR4 silencing were: forward 5’-CGAUGAUAUUAUUGACUUAUU-3′, reverse 5’-UAAGUCAAUAAUAUCAUCGAG-3′. Puromycin (Sigma, Santa Clara, CA, USA) selection was performed on the transfected cells at a concentration of 10 μg/ml for 15 days. qPCR and western blotting were used to determine the effectiveness of silencing and overexpression.
2.4. Real-time PCR
Real-time PCR was performed as previously described [31]. Total RNA was isolated from glioma cells using the Mini-BEST Universal RNA Extraction kit (TaKaRa, Kyoto, Japan) according to the manufacturer's instructions. First-strand cDNA was synthesized using Prime-Script RT Master Mix (TaKaRa). SYBR Green Master Mix (TaKaRa) was used for qPCR detection (PCR LightCycler480, Roche Diagnostics Ltd., Basel, Switzerland). The sequences of the PCR primer pairs are as follows: PSAP, forward 5’-CCCGGTCCTTGGACTGAAAG-3′ and reverse 5’-TATGTCGCAGGGAAGGGATTT-3′; β-actin, forward 5’-CATGTACGTTGCTATCCAGGC-3′ and reverse 5’-CTCCTTAATGTCACGCACGAT-3′.
2.5. Western blotting and immunoprecipitation
Western blotting was performed as previously described [31]. Cell protein was isolated from cells using a cell protein extraction kit (KeyGen Biotechnology, Nanjing, China). Trichloroacetic acid (TCA) protein precipitation was used to collect the secretory protein in the cell supernatants [32]. The total protein included the protein from both the cells and supernatants and was used for western blotting and immunoprecipitation. An equivalent amount of protein from each sample was separated by 4 to 20% SDS-PAGE (Genscript, Nanjing, China) and transferred to a nitrocellulose membrane. The membranes were blocked with 2% bovine serum albumin (KeyGen Biotechnology) and incubated with primary antibody at 4 °C overnight. The membranes were washed with TBST and then incubated with secondary antibody. The Chemiluminescence ECL kit (Beyotime Biotechnology, Beijing, China) was used to detect the bands, which were quantified using ImageJ software (National Institutes of Health, Bethesda, MD, USA).
For immunoprecipitation, cell pellets were lysed using RIPA lysis buffer containing proteasome inhibitor (Beyotime Biotechnology). Whole cell lysates were immunoprecipitated for 12 h at 4 °C with gentle shaking using a rabbit monoclonal antibody against PSAP or a mouse monoclonal antibody against TLR4 (Abcam) that was prebound to protein A-Sepharose 4B beads (GE Healthcare, Pittsburgh, PA, USA). Appropriate isotype antibodies were used as controls (Abcam). The beads were washed and boiled in SDS buffer, and the eluates were analyzed by western blotting.
2.6. Immunohistochemistry (IHC)
The IHC of tumor specimens was performed as previously described [31]. Paraffin-embedded sections were labeled with a primary antibody against PSAP (Abcam), and samples were imaged using a light microscope (Olympus, Tokyo, Japan). The immunohistochemical results were evaluated according to the German immunohistochemical score (GIS) [33,34].
2.7. Enzyme-linked immunosorbent (ELISA)
ELISA was performed as previously described [31]. The concentrations of PSAP, IL1β, IL6, IL8, IL10, IP-10, MCP1, RANTES, and IFN-β in the media supernatant of the glioma cell lines and stem cells were determined using commercially available ELISA kits (Cusabio, Stratech, Suffolk, UK). All the ELISA readings were normalized to the protein concentration in the control group.
2.8. Immunofluorescence
Immunofluorescence staining was performed as previously described [31]. Briefly, the cells were fixed with 4% paraformaldehyde, permeabilized with 0.5% Triton X-100, blocked with 5% BSA, and probed with primary antibody at 4 °C overnight. The samples were washed with PBS for 5 min and then stained with FITC- or rhodamine-conjugated secondary antibody. The cells were then counterstained with DAPI (Sigma). Staining was visualized using a laser scanning confocal microscope (Olympus).
2.9. Cell viability assay
Cell viability was determined using the CellTiter 96® AQueous Non-Radioactive cell proliferation assay kit (Promega, Madison, WI, USA) according to the manufacturer's instructions. Briefly, cells were cultured in 96-well plates at a density of 1 × 10³ cells/well for 24, 48, 72, 96, or 120 h. After the incubation, MTS (20 μl) was added to each well for 3 h at 37 °C. The absorbance at 495 nm was detected using an ultraviolet spectrophotometer (ThermoFisher Scientific, Waltham, MA, USA).
2.10. EdU assay
The 5-ethynyl-20-deoxyuridine (EdU) incorporation assay was performed using an EdU assay kit (Beyotime Biotechnology) according to the manufacturer instructions. Briefly, cells were seeded into 24-well plates at a density of 1 × 10⁵ cells per well for 24 h and then treated with 50 μM EdU for 2 h at 37 °C. The cells were then fixed with 4% paraformaldehyde, permeabilized with 0.3% Triton X-100, incubated with 100 μl Click Additive Solution for 30 min, and stained with 100 μl DAPI. The images were taken with a laser scanning confocal microscope (Olympus). The percentage of EdU-positive cells was calculated.
2.11. Neurosphere formation assay
The neurosphere formation assay was performed as previously described [31]. Briefly, glioma stem cells were seeded in 24-well plates at a density of 200 cells per well and cultured in fresh medium for seven days. The relative neurosphere size and number of neurospheres were counted using a light microscope (Olympus).
2.12. Luciferase reporter assays
Luciferase reporter assays were performed as previously described [31]. Briefly, NF-kappaB and IRF3 reporter plasmids were constructed by Gene-Chem (Shanghai, China). Cells were seeded into 96-well plates at a density of 5 × 10³ cells per well and transfected with different plasmids. After 48 h, the cells were lysed, and luciferase activity was measured using the Dual-Luciferase Reporter Assay System (Promega), according to the manufacturer's instructions. Each experiment was independently repeated three times.
2.13. Xenograft experiments
Six-week-old female BALB/c nude mice were purchased from Beijing Vital River Laboratory Animal Technology Co., Ltd. and bred in laminar flow cabinets under specific pathogen-free conditions in the Laboratory Animal Center of China Medical University. All animal experiments were performed in accordance with the Animal Care Committee of China Medical University. Cells were injected orthotopically (5 × 10 [4]) into the mouse brain at 2 mm lateral and 2 mm anterior to the bregma using a stereotaxic apparatus as previously described [31]. Five mice in each group was observed daily for signs of distress or death and tumor growth. The tumor volume was calculated according to the formula: V = (D × d [2])/2, where D represents the longest diameter and d represents the shortest diameter.
2.14. Bioinformatics analysis
The data on mRNA expression and the clinical material from patients were obtained from the Cancer Genome Atlas (TCGA, http://cancergenome.nih.gov) and the Chinese Glioma Genome Atlas (CGGA, http://www.cgga.org.cn). Gene set enrichment analysis (GSEA, http://www.broadinstitute.org/gsea/index.jsp) was used to detect sets of genes from signaling pathways that showed statistically significant differences between higher and lower PSAP expression groups.
2.15. Statistical analysis
Statistical analysis was performed using SPSS 22.0 software. All experiments were repeated at least three times, and the results are presented as the mean ± the standard error of the mean (SEM). The chi-square test and t-test were used to evaluate the statistical significance between groups. Differences in survival rates were analyzed using the log-rank test and Kaplan–Meier analysis. All statistical tests were two-sided, and statistical significance was defined as a p-value <.05.
3. Results
3.1. PSAP is highly expressed in gliomas and is associated with poor prognosis
We first evaluated the expression of PSAP in 70 glioma patients and 10 normal brain tissues. All results (i.e., qPCR, western blot, and immunohistochemistry) showed that the expression of PSAP in glioma was significantly higher than that in normal brain tissue. In addition, the expression was significantly increased with higher glioma WHO grades (Fig. 1 a, b, c, d and Supplementary Fig. 1). Furthermore, according to our clinical material, the last patient of the PSAP high expression population was lost to follow up at week 65, and the last patient of the PSAP low expression population died at week 80. Kaplan-Meier survival analysis demonstrated that the median survival time of patients with higher PSAP expression was 22 months compared to 29 months for patients with lower PSAP expression. Therefore, the survival time of glioma patients with higher PSAP expression was significantly shorter than that of the lower expression group (P = .034) (Fig. 1 e).
Fig. 1.

PSAP is expressed at higher levels in glioma and is correlated with poor patient survival.
a, b: Representative western blots showing higher PSAP expression in glioma patients with different grades compared to normal brain tissue (NBT). β-actin was used as a loading control. Densitometry data are shown as the mean ± S.D. relative to the respective negative control or vector control cells as appropriate (3 experiments).
c: Representative immunohistochemistry staining for PSAP in NBT and glioma patients with different grades (grade II, n = 20; grade III, n = 25; grade IV, n = 25; NBT n = 10). Scale bar = 50 μm. (non-tumor vs. grade II, P = 0.0038; non-tumor vs. grade III, P < 0.0001; non-tumor vs. grade IV, P < 0.0001; one-way ANOVA).
d: PSAP is expressed at higher levels in glioma patients with different grades of disease compared to NBT as measured by qPCR.
e: Kaplan–Meier analysis of the 70 cases of glioma patients with high PSAP expression versus low PSAP expression by IHC.
*P, 0.05; **P, 0.01; ***P, 0.001. (t-test).
Supplementary Fig. 1.
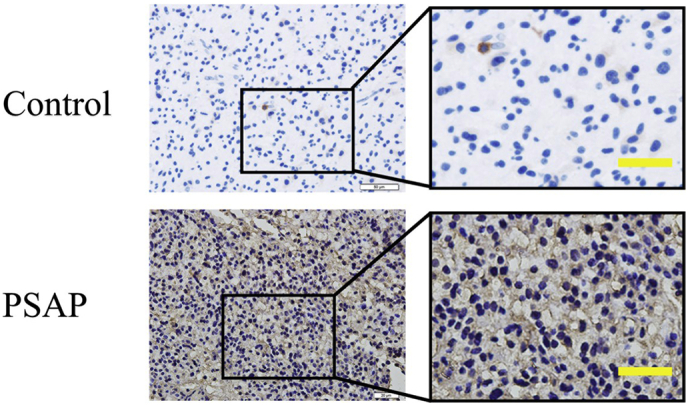
Representative images of immunostaining with secondary antibody alone (up: control) or PSAP (down, PSAP).
We isolated glioma stem cells (GSCs) from six patient gliomas representing different pathological diagnoses (e.g., WHO grade II, III, or IV). The six GSC populations were designated GSC-21 and GSC-22 (WHO grade II), GSC-31 and GSC-32 (WHO grade III), and GSC-41 and GSC-42 (WHO grade IV). All GSCs were confirmed by their ability to differentiate and immunofluorescence staining of the stem cell markers CD133 and nestin (Fig. 2 a, b). Western blot and qPCR showed that PSAP expression in the WHO grade IV GSCs (GSC-41 and GSC-42) was higher than that of the WHO grade II GSCs (GSC-21 and GSC-22) (Fig. 2 c, d). In addition, secretion of PSAP into the medium was significantly higher for the WHO grade IV GSCs than for the WHO grade II GSCs (Fig. 2 f). Furthermore, we evaluated the expression of PSAP in common glioma cell lines. Using western blot, qPCR, and ELISA, we found that the expression and secretion of PSAP in common glioma cell lines. All the tested glioma cell lines expressed higher levels of PSAP than the normal human astrocyte cell line HA. Moreover, U87, which is one of the most aggressive and malignant glioma cell lines, had the highest PSAP expression levels. In contrast, SNB19, an astrocytoma cell line that is less aggressive and malignant, expressed the lowest PSAP levels (Fig. 2 c, e). Based on these results, there appears to be significantly higher expression and secretion of PSAP in glioma with a significant correlation between the expression of PSAP and poor patient prognosis.
Fig. 2.

Endogenous PSAP expression in glioma cells.
a: Immunofluorescence staining of CD133 in patient-derived glioma stem cells (GSCs), scale bar = 20 μm.
b: After DMEM +10% FBS treatment, the patient-derived GSCs became adherent and differentiated into GFAP- or βIII tubulin-positive cells. Representative micrographs of adherent GSCs are presented, scale bar = 200 μm. Immunofluorescence showed differentiated GSCs expressing GFAP or βIII tubulin (middle and below), scale bar = 50 μm.
c: PSAP expression in patient-derived GSCs (left) and different glioma cell lines (right) measured by qPCR.
d, e: PSAP protein levels in patient-derived GSCs (d) or different glioma cell lines (e) measured by western blot.
f, g: Secreted PSAP levels in the medium of patient-derived GSCs (f) or different glioma cell lines (g) measured by ELISA.
All data are shown as the mean ± S.D. (3 experiments). *P, 0.05; **P, 0.01; ***P, 0.001. (t-test).
3.2. PSAP regulates the growth of glioma cells
To determine the effect of PSAP on glioma tumor cell and stem cell growth, we designed two siRNA sequences with a lentivirus envelope to silence PSAP expression. We chose U87 and GSC-42 for lentiviral infection because they had the highest PSAP expression. We used western blot, qPCR, and ELISA to confirm the knockdown of PSAP expression. As shown in Fig. 3 a-c, the levels of PSAP expression and secretion were significantly decreased in both U87 and GSC-42 following transfection of PSAP siRNA. Furthermore, knockdown of PSAP expression significantly decreased the growth of U87 and GSC-42 as determined by the MTS and EdU assays (Fig. 3 d-f). PSAP siRNA infection of GSC-42 also reduced the rate of neurosphere formation and size of the neurospheres compared to the control group (Fig. 3 g).
Fig. 3.

PSAP knockdown inhibited glioma proliferation in vitro.
a, b, c: Lentiviral-based PSAP-siRNA1, PSAP-siRNA2, or siRNA-control were transfected into U87 or GSC-42, and the knockdown effects were detected by western blot (a), qPCR (b), and ELISA (c).
d, e: U87 (d) and GSC-42 (e) cell viability was decreased after PSAP knockdown as measured using the MTS assay.
f: PSAP knockdown inhibited the proliferation of U87 and GSC-42 cells as measured by the EdU incorporation assay, scale bar = 100 μm.
g The self-renewing capacity of GSC-42 decreased after PSAP knockdown as determined by the neurosphere formation assay, scale bar = 20 μm.
All data are shown as the mean ± S.D. (3 experiments). *P, 0.05; **P, 0.01; ***P, 0.001. (t-test).
To further evaluate the effect of PSAP on the growth of glioma tumor cells and stem cells, we overexpressed PSAP in SNB19 and GSC-21, which was confirmed by western blot, qPCR, and ELISA (Fig. 4 a, b, c). MTS and EdU assays confirmed that SNB19 and GSC-21 proliferation increased following PSAP overexpression (Fig. 4 d, e). Furthermore, the neurosphere formation rate and relative size of neurospheres formed by GSC-21 were significantly higher than the control group following PSAP overexpression (Fig. 4 f). These results confirm that PSAP plays a role in regulating glioma proliferation and a high level of PSAP synthesis and secretion can promote the growth of glioma cells.
Fig. 4.

PSAP overexpression promoted glioma proliferation in vitro.
a, b, c: Lentiviral-based PSAP or empty vector were transfected into SNB19 and GSC-21. The effects of overexpression were detected by western blot (a), qPCR (b) and ELISA (c).
d: SNB19 (left) and GSC-21 (right) cell viability increased after PSAP overexpression as measured by the MTS assay.
e: The proliferation of SNB19 and GSC-21 increased following PSAP overexpression as measured by the EdU incorporation assay, scale bar = 100 μm.
f: The self-renewing capacity of GSC-21 increased after PSAP overexpression as determined by the neurosphere formation assay, scale bar = 20 μm.
All data are shown as the mean ± S.D. (3 experiments). *P, 0.05; **P, 0.01; ***P, 0.001. (t-test).
3.3. PSAP increases glioma tumorigenesis
We further evaluated the effects of PSAP on tumorigenesis using orthotopic xenograft models. We followed the survival rates of nude mice after intracranial inoculation of GSC-42 cells with (PSAP-KD1, PSAP-KD2) or without (PSAP-NC) PSAP silencing. According to the Kaplan-Meier survival analysis, the median survival time (MST) of the GSC-42 PSAP-NC group was 35 days. Silencing of PSAP extended the MST to 56 and 52 days for the PSAP-KD1 and PSAP-KD2 groups, respectively (Fig. 5 b). These data are consistent with the decreased intracranial tumor volume observed in the PSAP knockdown groups (Fig. 5 a, b). Overexpression of PSAP in GSC-21, significantly decreased the MST of nude mice to only 23 days (MST, control group = 35 days), which was consistent with the larger tumor volumes observed in the PSAP overexpressing GSC-21 group compared to the control mice (Fig. 5a, c). These results clearly demonstrate that PSAP plays a role in glioma tumorigenesis.
Fig. 5.

PSAP regulates glioma tumorigenesis.
a: Representative photographs show the intracranial tumor size in the coronal position. PSAP knockdown in GSC-42 decreased the intracranial tumor size whereas PSAP overexpression in GSC-21 increased the intracranial tumor size, n scale bar =10 mm.
b: Kaplan–Meier survival curves show that PSAP knockdown increased the survival time of GSC-42 tumor-bearing mice (n = 5).
c; Kaplan–Meier survival curves show that PSAP overexpression in group reduced the survival time of GSC-21 tumor bearing mice (n = 5).
*P, 0.05; **P, 0.01; ***P, 0.001. (t-test).
3.4. PSAP regulates the NF- κB signaling pathway through the TLR4 signaling pathway
To explore the specific signaling pathways involved in PSAP mediated effects in glioma, we performed Gene Set Enrichment Analysis (GSEA) based on the TCGA and CGGA glioma databases and Kyoto Encyclopedia of Genes and Genomes (KEGG) analysis based on TCGA. We found that higher PSAP expression was associated with the TLR signaling pathway (Fig. 6 a, b). Although Lrp1, a low-density lipoprotein, is one of the known receptors for PSAP, further analysis showed that there was the highest correlation between the expression of PSAP and TLR4 in the TCGA and CGGA glioma datasets compared to other TLRs or Lrp1 (Fig. 6 c, d). Therefore, we selected the TLR signaling pathway as a possible pathway involved in PSAP regulation. Furthermore, the qPCR analysis demonstrated that there was a significant correlation between PSAP and TLR4 expression in the clinical glioma specimens (Fig. 6 e).
Fig. 6.

PSAP participates in the TLR4 signaling pathway.
a: Gene set enrichment analysis (GSEA) indicates that high expression of PSAP is associated with the TLR signaling pathway in both the TCGA and CGGA databases.
b: Kyoto Encyclopedia of Genes and Genome (KEGG) analysis suggests that PSAP participates in the TLR signaling pathway in TCGA database.
c: TCGA analysis shows the correlations for TLRs/PSAP and Lrp1/PSAP.
d: There is a positive correlation between PSAP and TLR4 in the TCGA and CGGA database (r = 0.5847, p < 0.0001 and r = 0.3638, p < 0.0001 respectively, Pearson correlation analysis).
e: There is a positive correlation between PSAP and TLR4 in the clinical glioma specimens (r = 0.7342, p < 0.0001, Pearson correlation analysis).
Since PSAP is a secretory protein and TLR4 is a membrane protein, we investigated whether there was a direct association between these two proteins. CoIP was used to determine direct binding between PSAP and TLR4. Both TLR4 and PSAP were detected in the two CoIP assays (Fig. 7 a). Furthermore, PSAP and TLR4 co-localized in the cell membrane of glioma cells as determined by immunofluorescence. This co-localization became more evident after PSAP overexpression in both SNB19 and GSC-42 cells and was significantly decreased in U87 and GSC-21 cells upon PSAP silencing (Fig. 7 b). The binding of a ligand to TLR4 can result in TLR4 dimerization and recruitment of myeloid differentiation primary response gene 88 (MyD88) or Toll-interleukin receptor-domain-containing adapter-inducing interferon-β (TRIF) and other adapter proteins. Importantly, MyD88-mediated activation of the NF-κB signaling pathway can induce tumor inflammation and promote tumor development, and the MyD88-dependent pathway can contribute to glioma proliferation [28,35]. Therefore, NF-κB and IRF3 luciferase reporter assays were performed. Following TLR4 silencing, the relative P65-mediated luciferase activity was decreased in both the PSAP-overexpressing GSC-21 and PSAP-silenced GSC-42 cells, but there was no detectable change in IRF3-mediated luciferase activity (Fig. 7f, g). In addition, we used immunofluorescence to detect changes in P65 expression and location following PSAP regulation. We found that the expression and nuclear localization of P65 were weakened after PSAP silencing in U87 and GSC-42 but increased after PSAP overexpression in SNB19 and GSC-21(Fig. 7 c). Then we used western blotting to determine the relationship between PSAP and the main regulators of the NF-κB signaling pathway. We found that the expression of MyD88, p-P65, p-IκBα, p-IKKα/β and TBS1 were significantly downregulated after PSAP silencing in U87 and GSC-42 (Fig. 8 a, b). Conversely, the expression of these molecules was significantly upregulated following PSAP overexpression in SNB19 and GSC-21 (Fig. 8 c, d). Finally, ELISA was performed to measure the levels of secreted pro- and anti-inflammatory cytokines regulated by NF-κB or IFR3. The results showed that the secretion of the NF-κB-regulated cytokines (i.e., IL1β, IL6, IL8, IL10, IP-10, MCP1, and RANTES) were all decreased after PSAP knockdown and increased after PSAP overexpression. However, there was no change in IFN- β secretion, which is regulated by IRF3 (Fig. 7 d, e). These data suggest that PSAP can bind to TLR4 and activate MyD88-dependent signaling and the NF- κB signaling pathway.
Fig. 7.

PSAP regulates NF-κB signaling pathway via TLR4 activation in glioma.
a: PSPA and TLR4 levels in GSC-42 cell lysates were measured by western blot following immunoprecipitation (IP) with PSAP (A) or TLR4 (B) antibodies.
b: PSAP and TLR4 co-localize in the glioma cell membrane as demonstrated by immunofluorescence, scale bar = 50 μm.
c: PSAP modulation affects the expression and nuclear translocation of P65 in glioma cells as measured by immunofluorescence, scale bar = 50 μm.
d, e: PSAP overexpression (d) and knockdown (e) regulated the secretion of pro-inflammatory cytokines in glioma cells as measured by ELISA.
f, g: PSAP overexpression (f) or knockdown (g) alters the relative P65-mediated luciferase activity after TLR4 knockdown.
All data are shown as the mean ± S.D. (3 experiments). *P, 0.05; **P, 0.01; ***P, 0.001. (t-test).
Fig. 8.

PSAP regulates NF-κB signaling pathway in glioma.
a, c: PSAP knockdown (a) or overexpression (c) alters the levels of NF-κB downstream targets as measured by western blotting. The western blots shown are representative of three independent experiments.
b, d: Densitometric analysis (arbitrary units) of the results in a and c. Densitometry for PSAP and the downstream targets are expressed relative to the loading control, β-actin. Densitometry data are shown as the mean ± S.D. relative to the respective negative control or vector control cells as appropriate (3 experiments). *P, 0.05; **P, 0.01; ***P, 0.001. (t-test).
3.5. Inhibition of TLR4 can block the proliferation and growth of glioma by PSAP
To further verify the role of TLR4 in promoting the proliferative effects of PSAP in glioma, we treated PSAP-overexpressing or empty vector control GSC-21 and SNB19 cells with a TLR4-specific inhibitor (TAK-242). TAK-242 can competitively bind to the TIR segment and block the activation of TLR4 induced by TIRAP and TRAM binding [36]. TAK-242 reduced the proliferation of PSAP overexpressing GSC-21 and SNB19 cells compared to the vehicle control group (Fig. 9 a, b, c). In addition, TAK-242 decreased the number and size of neurospheres from PSAP overexpressing GSC-21 cells compared to the vehicle control group (Fig. 9 d). The effect of TAK-242 treatment on the expression of TLR4 and the main regulators of the NF- κB signaling pathway was determined by western blotting. The results showed that the expression of myD88, p-P65, p-IκBα, and p-IKKα/β was decreased in PSAP overexpressing GSC-21 and SNB19 cells following TAK-242 treatment (Fig. 9 e). Therefore, the proliferative effects of PSAP on glioma are dependent on TLR4-mediated activation of the NF- κB signaling pathway.
Fig. 9.

TLR4 antagonist TAK-242 abrogates the proliferation promoting effects of PSAP.
a: TAK-242 decreases the growth of PSAP overexpressing SNB19 and GSC-21 cells as measured by the MTS assay.
b, c: The effects of TAK-242 on the growth of PSAP overexpressing and empty control SNB19 and GSC-21 cells measured by the EdU incorporation assay, scale bar = 100 μm.
d: TAK-242 decreases the self-renew capacity of PSAP overexpressing GSC-21 cells in the neurosphere formation assay, scale bar = 20 μm.
e: TAK-242 alters NF-κB downstream targets in PSAP overexpressing SNB19 and GSC-21 cells as measured by western blotting.
All data are shown as the mean ± S.D. (3 experiments). *P, 0.05; **P, 0.01; ***P, 0.001.
4. Discussion
In addition to its role in prostate, breast, and gallbladder cancer [13,27,37,38], secretory PSAP may be involved in the development of glioma due to its neurotrophic effects [19,23]. By evaluating the expression and secretion of PSAP in clinical glioma specimens and cell lines using a panel of detection methods, we found that PSAP was expressed higher in glioblastoma and glioma compared to normal brain tissue [25,39]. Furthermore, Kaplan-Meier survival analysis revealed that the median survival time of patients with higher PSAP expression was significantly shorter than that of patients with lower PSAP expression. These data suggest that PSAP may play an important role in the development of glioma.
To demonstrate the growth promoting effects of PSAP in gliomas, especially glioma stem cells, we used patient-derived glioma stem cells and glioma tumor cell lines to determine the effect of PSAP modulation on glioma proliferation. We found that PSAP overexpression promoted tumor growth whereas PSAP silencing inhibited growth. Orthotopic xenograft studies confirmed the effects of PSAP modulation on glioma cell growth and tumorigenesis. However, the survival times of mice injected with GSC-21 and GSC-42 are similar while the tumors formed by GSC-42 are almost 2.5 times larger than GSC-21. Since we didn't perform the xenograft experiment of GSC-42 and GSC-21 simultaneously, there would be several factors affecting the survival time of nude mice beside the tumor volume, such as the resistant capacity of nude mice to the injected glioma and the different living environment. What's more, the differences of proliferative and invasive capacities of glioma stem cells may play a key role in survival times.
There have been several published reports that found that PSAP could stimulate the production of thrombospondin-1 (TSP-1) in the tumor microenvironment of breast, prostate, lung, and ovarian cancer [40,41]. Because TSP-1 can inhibit angiogenesis and induce tumor cell apoptosis via the cell surface receptor CD36, PSAP functions as a tumor suppressor protein in those cancer settings [42]. Our experiments demonstrated that in glioma, TSP-1 expression did not noticeably change after PSAP overexpression or knockdown. Therefore, our results suggest that PSAP is truly involved in promoting glioma proliferation and growth without stimulating TSP-1 production.
To explore the exact mechanism of the PSAP proliferative effects in glioma, we performed GSEA and KEGG analysis based on the TCGA and CGGA glioma databases. The results suggested that higher PSAP expression may be involved in the regulation of the Toll-like receptor signaling pathway. Further analysis revealed that there was a significant positive correlation between PSAP and TLR4 in multiple glioma databases and our clinical glioma specimens. Because PSAP is a secretory protein and TLR4 is a typical receptor protein, we hypothesized that PSAP bound to TLR4. Amazingly, immunofluorescence staining showed co-localization of PSAP and TLR4, and CoIP experiments confirmed that PSAP could bind to TLR4.
As a pattern recognition receptor, TLR4 can identify pathogen-associated molecular patterns (PAMPs), such as lipopolysaccharide, and damage-associated molecular patterns (DAMPs) [30,43,44]. The activation of TLR4 can lead to its dimerization, activation of the MyD88-dependent or -independent NF-κB signaling pathway, participation in the regulation of the tumor immune response, inflammatory response, and promotion of tumor growth, invasion, and other functions [45,46]. Possibly due to the ineffective of TLR4 knocking down, there have no discernible effect on NF-κB activity in both GSC-21 and GSC-42 cells expressing endogenous levels of PSAP. However, after PSAP overexpression or silence in TLR4 knocking down GSC-21 or GSC-42, the dependent effect of TLR4 became obviously and the luciferase reporter assays showed that PSAP binding to TLR4 could lead to the activation of MyD88-dependent NF-κB, and not MyD88-independent IRF3. Western blotting also showed PSAP overexpression could significantly increase the expression levels of MyD88, p-P65, p-IκBα, and p-IKKα/β, and the nuclear translocation of P65. The opposite results were obtained after PSAP silencing. These results are further supported by the finding that PSAP overexpression induced the expression of cytokines and inflammatory factors that are mainly regulated by the NF- κB signaling pathway (IL1β, IL6, IL8, IL10, IP10, MCP-1, and RNATES). Furthermore, recent studies have shown that inflammation, especially the secretion of many cytokines and chemokines in the tumor microenvironment, plays an important role in the occurrence, development, and prognosis of glioma [[47], [48], [49], [50]]. For example, IL-1β expression can promote the proliferation of glioma cells through the ERK and JNK signaling pathways [51,52]. IL-6 can promote the proliferation of glioma cells through the JAK2/STAT3 signaling pathway [31,53]. IL-8 participates in the proliferation and invasion of glioma through the PI3K/AKT/JAK2/STAT3 pathway [54]. IL-10 may contribute to glioma progression by suppressing the immune response [55]. The TLR4-specific blocking agent, TAK-242, confirmed that the effects of PSAP on glioma growth and the NF-kB signaling pathway are mediated through TLR4. Therefore, PSAP binding to TLR4 may lead to the activation of the Myd88-dependent NF-κB signaling pathway and promote the growth of glioma through the release of inflammatory factors.
In summary, we found that secretory neurotrophic factor PSAP is overexpressed in glioma, and can bind to TLR4 to activate the Myd88-dependent NF-κB signaling pathway, which may induce the synthesis and secretion of inflammatory factors and promote the growth of glioma stem cells and tumor cells. Therefore, PSAP may be an important target for inhibiting glioma growth and improving glioma prognosis.
The following are the supplementary data related to this article.
Funding sources
This work was funded by National Natural Science Foundation of China (Nos. 81101917, 81270036, 81201802, 81673025), Program for Liaoning Excellent Talents in University (No. LR2014023), and Liaoning Province Natural Science Foundation (Nos. 20170541022, 20172250290). The funders did not play a role in manuscript design, data collection, data analysis, interpretation nor writing of the manuscript.
Declarations of interests
The authors have declared that no conflict of interest exists.
Author contributions
YZ and ZJ conceived and designed the study; YJ and JZ performed the experiments and collected the data; PL, HG, YM and YSC performed Bioinformatics analysis and analyzed the data. YJ, JZ, LL and DZ interpreted results and wrote the manuscript. YZ and JZ contributed equally to this work. All authors read and approved the final version of the manuscript.
Acknowledgements
We would like to acknowledge our lab colleagues for their support in the development of this article.
Contributor Information
Ye Zhang, Email: yzhang21@cmu.edu.cn.
Zhitao Jing, Email: jingzhitao@hotmail.com.
References
- 1.Zhou D., Alver B.M., Li S., Hlady R.A., Thompson J.J., Schroeder M.A. Distinctive epigenomes characterize glioma stem cells and their response to differentiation cues. Genome Biol. 2018;19(1):43. doi: 10.1186/s13059-018-1420-6. [DOI] [PMC free article] [PubMed] [Google Scholar]
- 2.Formolo C.A., Williams R., Gordish-Dressman H., MacDonald T.J., Lee N.H., Hathout Y. Secretome signature of invasive glioblastoma multiforme. J Proteome Res. 2011;10(7):3149–3159. doi: 10.1021/pr200210w. [DOI] [PMC free article] [PubMed] [Google Scholar]
- 3.Fu M.H., Wang C.Y., Hsieh Y.T., Fang K.M., Tzeng S.F. Functional Role of Matrix gla Protein in Glioma Cell Migration. Mol Neurobiol. 2018;55(6):4624–4636. doi: 10.1007/s12035-017-0677-1. [DOI] [PubMed] [Google Scholar]
- 4.Augustin I., Goidts V., Bongers A., Kerr G., Vollert G., Radlwimmer B. The Wnt secretion protein Evi/Gpr177 promotes glioma tumourigenesis. EMBO Mol Med. 2012;4(1):38–51. doi: 10.1002/emmm.201100186. [DOI] [PMC free article] [PubMed] [Google Scholar]
- 5.Joseph J.V., Conroy S., Tomar T., Eggens-Meijer E., Bhat K., Copray S. TGF-beta is an inducer of ZEB1-dependent mesenchymal transdifferentiation in glioblastoma that is associated with tumor invasion. Cell Death Dis. 2014;5:e1443. doi: 10.1038/cddis.2014.395. [DOI] [PMC free article] [PubMed] [Google Scholar]
- 6.Paolillo M., Boselli C., Schinelli S. Glioblastoma under Siege: An overview of current therapeutic strategies. Brain Sci. 2018;8(1):13. doi: 10.3390/brainsci8010015. [DOI] [PMC free article] [PubMed] [Google Scholar]
- 7.Lathia J.D., Mack S.C., Mulkearns-Hubert E.E., Valentim C.L., Rich J.N. Cancer stem cells in glioblastoma. Genes Dev. 2015;29(12):1203–1217. doi: 10.1101/gad.261982.115. [DOI] [PMC free article] [PubMed] [Google Scholar]
- 8.Kishimoto Y., Hiraiwa M., O'Brien J.S. Saposins: structure, function, distribution, and molecular genetics. J Lipid Res. 1992;33(9):1255–1267. [PubMed] [Google Scholar]
- 9.Schuette C.G., Pierstorff B., Huettler S., Sandhoff K. Sphingolipid activator proteins: proteins with complex functions in lipid degradation and skin biogenesis. Glycobiology. 2001;11(6):81r–90r. doi: 10.1093/glycob/11.6.81r. [DOI] [PubMed] [Google Scholar]
- 10.Nabeka H., Shimokawa T., Doihara T., Saito S., Wakisaka H., Hamada F. A prosaposin-derived Peptide alleviates kainic Acid-induced brain injury. PLoS One. 2015;10(5) doi: 10.1371/journal.pone.0126856. [DOI] [PMC free article] [PubMed] [Google Scholar]
- 11.Hineno T., Sano A., Kondoh K., Ueno S., Kakimoto Y., Yoshida K. Secretion of sphingolipid hydrolase activator precursor, prosaposin. Biochem Biophys Res Commun. 1991;176(2):668–674. doi: 10.1016/s0006-291x(05)80236-0. [DOI] [PubMed] [Google Scholar]
- 12.Hiraiwa M., Soeda S., Kishimoto Y., O'Brien J.S. Binding and transport of gangliosides by prosaposin. Proc Natl Acad Sci U S A. 1992;89(23):11254–11258. doi: 10.1073/pnas.89.23.11254. [DOI] [PMC free article] [PubMed] [Google Scholar]
- 13.Koochekpour S., Zhuang Y.J., Beroukhim R., Hsieh C.L., Hofer M.D., Zhau H.E. Amplification and overexpression of prosaposin in prostate cancer. Genes Chromosomes Cancer. 2005;44(4):351–364. doi: 10.1002/gcc.20249. [DOI] [PubMed] [Google Scholar]
- 14.Hindle S.J., Hebbar S., Schwudke D., Elliott C.J.H., Sweeney S.T. A saposin deficiency model in Drosophila: Lysosomal storage, progressive neurodegeneration and sensory physiological decline. Neurobiol Dis. 2017;98:77–87. doi: 10.1016/j.nbd.2016.11.012. [DOI] [PMC free article] [PubMed] [Google Scholar]
- 15.Motta M., Tatti M., Furlan F., Celato A., Di Fruscio G., Polo G. Clinical, biochemical and molecular characterization of prosaposin deficiency. Clin Genet. 2016;90(3):220–229. doi: 10.1111/cge.12753. [DOI] [PubMed] [Google Scholar]
- 16.Elleder M., Jerabkova M., Befekadu A., Hrebicek M., Berna L., Ledvinova J. Prosaposin deficiency -- a rarely diagnosed, rapidly progressing, neonatal neurovisceral lipid storage disease. Report of a further patient. Neuropediatrics. 2005;36(3):171–180. doi: 10.1055/s-2005-865608. [DOI] [PubMed] [Google Scholar]
- 17.Hosoda Y., Miyawaki K., Saito S., Chen J., Bing X., Terashita T. Distribution of prosaposin in the rat nervous system. Cell Tissue Res. 2007;330(2):197–207. doi: 10.1007/s00441-007-0464-9. [DOI] [PubMed] [Google Scholar]
- 18.Meyer R.C., Giddens M.M., Schaefer S.A., Hall R.A. GPR37 and GPR37L1 are receptors for the neuroprotective and glioprotective factors prosaptide and prosaposin. Proc Natl Acad Sci U S A. 2013;110(23):9529–9534. doi: 10.1073/pnas.1219004110. [DOI] [PMC free article] [PubMed] [Google Scholar]
- 19.Meyer R.C., Giddens M.M., Coleman B.M., Hall R.A. The protective role of prosaposin and its receptors in the nervous system. Brain Res. 2014;1585:1–12. doi: 10.1016/j.brainres.2014.08.022. [DOI] [PMC free article] [PubMed] [Google Scholar]
- 20.Kotani Y., Matsuda S., Sakanaka M., Kondoh K., Ueno S., Sano A. Prosaposin facilitates sciatic nerve regeneration in vivo. J Neurochem. 1996;66(5):2019–2025. doi: 10.1046/j.1471-4159.1996.66052019.x. [DOI] [PubMed] [Google Scholar]
- 21.Nabeka H., Uematsu K., Takechi H., Shimokawa T., Yamamiya K., Li C. Prosaposin overexpression following kainic acid-induced neurotoxicity. PLoS One. 2014;9(12) doi: 10.1371/journal.pone.0110534. [DOI] [PMC free article] [PubMed] [Google Scholar]
- 22.Gao H.L., Li C., Nabeka H., Shimokawa T., Saito S., Wang Z.Y. Attenuation of MPTP/MPP(+) toxicity in vivo and in vitro by an 18-mer peptide derived from prosaposin. Neuroscience. 2013;236:373–393. doi: 10.1016/j.neuroscience.2013.01.007. [DOI] [PubMed] [Google Scholar]
- 23.Terashita T., Saito S., Nabeka H., Hato N., Wakisaka H., Shimokawa T. Prosaposin-derived peptide alleviates ischaemia-induced hearing loss. Acta Otolaryngol. 2013;133(5):462–468. doi: 10.3109/00016489.2012.750430. [DOI] [PubMed] [Google Scholar]
- 24.Koochekpour S., Lee T.J., Wang R., Sun Y., Delorme N., Hiraiwa M. Prosaposin is a novel androgen-regulated gene in prostate cancer cell line LNCaP. J Cell Biochem. 2007;101(3):631–641. doi: 10.1002/jcb.21207. [DOI] [PubMed] [Google Scholar]
- 25.Wu Y., Sun L., Zou W., Xu J., Liu H., Wang W. Prosaposin, a regulator of estrogen receptor alpha, promotes breast cancer growth. Cancer Sci. 2012;103(10):1820–1825. doi: 10.1111/j.1349-7006.2012.02374.x. [DOI] [PMC free article] [PubMed] [Google Scholar]
- 26.Ali A., Creevey L., Hao Y., McCartan D., O'Gaora P., Hill A. Prosaposin activates the androgen receptor and potentiates resistance to endocrine treatment in breast cancer. Breast Cancer Res. 2015;17:123. doi: 10.1186/s13058-015-0636-6. [DOI] [PMC free article] [PubMed] [Google Scholar]
- 27.Sahasrabuddhe N.A., Barbhuiya M.A., Bhunia S., Subbannayya T., Gowda H., Advani J. Identification of prosaposin and transgelin as potential biomarkers for gallbladder cancer using quantitative proteomics. Biochem Biophys Res Commun. 2014;446(4):863–869. doi: 10.1016/j.bbrc.2014.03.017. [DOI] [PMC free article] [PubMed] [Google Scholar]
- 28.Zeuner M.T., Kruger C.L., Volk K., Bieback K., Cottrell G.S., Heilemann M. Biased signalling is an essential feature of TLR4 in glioma cells. Biochim Biophys Acta. 2016;1863(12):3084–3095. doi: 10.1016/j.bbamcr.2016.09.016. [DOI] [PubMed] [Google Scholar]
- 29.Moresco E.M., Lavine D., Beutler B. Toll-like receptors. Current Biol. 2011;21(13):R488–R493. doi: 10.1016/j.cub.2011.05.039. [DOI] [PubMed] [Google Scholar]
- 30.Deng S., Zhu S., Qiao Y., Liu Y.J., Chen W., Zhao G. Recent advances in the role of toll-like receptors and TLR agonists in immunotherapy for human glioma. Protein Cell. 2014;5(12):899–911. doi: 10.1007/s13238-014-0112-6. [DOI] [PMC free article] [PubMed] [Google Scholar]
- 31.Jiang Y., Han S., Cheng W., Wang Z., Wu A. NFAT1-regulated IL6 signalling contributes to aggressive phenotypes of glioma. Cell Commun Signal. 2017;15(1):54. doi: 10.1186/s12964-017-0210-1. [DOI] [PMC free article] [PubMed] [Google Scholar]
- 32.Santa C., Anjo S.I., Manadas B. Protein precipitation of diluted samples in SDS-containing buffer with acetone leads to higher protein recovery and reproducibility in comparison with TCA/acetone approach. Proteomics. 2016;16(13):1847–1851. doi: 10.1002/pmic.201600024. [DOI] [PubMed] [Google Scholar]
- 33.Han S., Zhang C., Li Q., Dong J., Liu Y., Huang Y. Tumour-infiltrating CD4(+) and CD8(+) lymphocytes as predictors of clinical outcome in glioma. Br J Cancer. 2014;110(10):2560–2568. doi: 10.1038/bjc.2014.162. [DOI] [PMC free article] [PubMed] [Google Scholar]
- 34.Wang Y., Guan G., Cheng W., Jiang Y., Shan F., Wu A. ARL2 overexpression inhibits glioma proliferation and tumorigenicity via down-regulating AXL. BMC Cancer. 2018;18(1):599. doi: 10.1186/s12885-018-4517-0. [DOI] [PMC free article] [PubMed] [Google Scholar]
- 35.Huang J.M., Zhang G.N., Shi Y., Zha X., Zhu Y., Wang M.M. Atractylenolide-I sensitizes human ovarian cancer cells to paclitaxel by blocking activation of TLR4/MyD88-dependent pathway. Sci Rep. 2014;4:3840. doi: 10.1038/srep03840. [DOI] [PMC free article] [PubMed] [Google Scholar]
- 36.Matsunaga N., Tsuchimori N., Matsumoto T., Ii M. TAK-242 (resatorvid), a small-molecule inhibitor of Toll-like receptor (TLR) 4 signaling, binds selectively to TLR4 and interferes with interactions between TLR4 and its adaptor molecules. Mol Pharmacol. 2011;79(1):34–41. doi: 10.1124/mol.110.068064. [DOI] [PubMed] [Google Scholar]
- 37.Ishihara S., Ponik S.M., Haga H. Mesenchymal stem cells in breast cancer: response to chemical and mechanical stimuli. Oncoscience. 2017;4(11−12):158–159. doi: 10.18632/oncoscience.381. [DOI] [PMC free article] [PubMed] [Google Scholar]
- 38.Koochekpour S., Lee T.J., Sun Y., Hu S., Grabowski G.A., Liu Z. Prosaposin is an AR-target gene and its neurotrophic domain upregulates AR expression and activity in prostate stromal cells. J Cell Biochem. 2008;104(6):2272–2285. doi: 10.1002/jcb.21786. [DOI] [PubMed] [Google Scholar]
- 39.Koochekpour S., Hu S., Vellasco-Gonzalez C., Bernardo R., Azabdaftari G., Zhu G. Serum prosaposin levels are increased in patients with advanced prostate cancer. Prostate. 2012;72(3):253–269. doi: 10.1002/pros.21427. [DOI] [PMC free article] [PubMed] [Google Scholar]
- 40.Ell B., Qiu Q., Wei Y., Mercatali L., Ibrahim T., Amadori D. The microRNA-23b/27b/24 cluster promotes breast cancer lung metastasis by targeting metastasis-suppressive gene prosaposin. J Biol Chem. 2014;289(32):21888–21895. doi: 10.1074/jbc.M114.582866. [DOI] [PMC free article] [PubMed] [Google Scholar]
- 41.Catena R., Bhattacharya N., El Rayes T., Wang S., Choi H., Gao D. Bone marrow-derived Gr1+ cells can generate a metastasis-resistant microenvironment via induced secretion of thrombospondin-1. Cancer Discov. 2013;3(5):578–589. doi: 10.1158/2159-8290.CD-12-0476. [DOI] [PMC free article] [PubMed] [Google Scholar]
- 42.Wang S., Blois A., El Rayes T., Liu J.F., Hirsch M.S., Gravdal K. Development of a prosaposin-derived therapeutic cyclic peptide that targets ovarian cancer via the tumor microenvironment. Sci Transl Med. 2016;8(329):329ra34. doi: 10.1126/scitranslmed.aad5653. [DOI] [PMC free article] [PubMed] [Google Scholar]
- 43.Che F., Yin J., Quan Y., Xie X., Heng X., Du Y. TLR4 interaction with LPS in glioma CD133+ cancer stem cells induces cell proliferation, resistance to chemotherapy and evasion from cytotoxic T lymphocyte-induced cytolysis. Oncotarget. 2017;8(32):53495–53507. doi: 10.18632/oncotarget.18586. [DOI] [PMC free article] [PubMed] [Google Scholar]
- 44.Li T.T., Ogino S., Qian Z.R. Toll-like receptor signaling in colorectal cancer: carcinogenesis to cancer therapy. World J Gastroenterol. 2014;20(47):17699–17708. doi: 10.3748/wjg.v20.i47.17699. [DOI] [PMC free article] [PubMed] [Google Scholar]
- 45.Plociennikowska A., Hromada-Judycka A., Borzecka K., Kwiatkowska K. Co-operation of TLR4 and raft proteins in LPS-induced pro-inflammatory signaling. Cell Mol Life Sci. 2015;72(3):557–581. doi: 10.1007/s00018-014-1762-5. [DOI] [PMC free article] [PubMed] [Google Scholar]
- 46.Tewari R., Choudhury S.R., Ghosh S., Mehta V.S., Sen E. Involvement of TNFalpha-induced TLR4-NF-kappaB and TLR4-HIF-1alpha feed-forward loops in the regulation of inflammatory responses in glioma. J Mol Med (Berlin, Germany) 2012;90(1):67–80. doi: 10.1007/s00109-011-0807-6. [DOI] [PubMed] [Google Scholar]
- 47.Yeung Y.T., McDonald K.L., Grewal T., Munoz L. Interleukins in glioblastoma pathophysiology: implications for therapy. Br J Pharmacol. 2013;168(3):591–606. doi: 10.1111/bph.12008. [DOI] [PMC free article] [PubMed] [Google Scholar]
- 48.Li G., Wang Z., Ye J., Zhang X., Wu H., Peng J. Uncontrolled inflammation induced by AEG-1 promotes gastric cancer and poor prognosis. Cancer Res. 2014;74(19):5541–5552. doi: 10.1158/0008-5472.CAN-14-0968. [DOI] [PubMed] [Google Scholar]
- 49.Reynes G., Vila V., Martin M., Parada A., Fleitas T., Reganon E. Circulating markers of angiogenesis, inflammation, and coagulation in patients with glioblastoma. J Neurooncol. 2011;102(1):35–41. doi: 10.1007/s11060-010-0290-x. [DOI] [PubMed] [Google Scholar]
- 50.Michelson N., Rincon-Torroella J., Quinones-Hinojosa A., Greenfield J.P. Exploring the role of inflammation in the malignant transformation of low-grade gliomas. J Neuroimmunol. 2016;297:132–140. doi: 10.1016/j.jneuroim.2016.05.019. [DOI] [PubMed] [Google Scholar]
- 51.Meini A., Sticozzi C., Massai L., Palmi M. A nitric oxide/ca(2+)/calmodulin/ERK1/2 mitogen-activated protein kinase pathway is involved in the mitogenic effect of IL-1beta in human astrocytoma cells. Br J Pharmacol. 2008;153(8):1706–1717. doi: 10.1038/bjp.2008.40. [DOI] [PMC free article] [PubMed] [Google Scholar]
- 52.Paugh B.S., Bryan L., Paugh S.W., Wilczynska K.M., Alvarez S.M., Singh S.K. Interleukin-1 regulates the expression of sphingosine kinase 1 in glioblastoma cells. J Biol Chem. 2009;284(6):3408–3417. doi: 10.1074/jbc.M807170200. [DOI] [PMC free article] [PubMed] [Google Scholar]
- 53.Giladi N.D., Ziv-Av A., Lee H.K., Finniss S., Cazacu S., Xiang C. RTVP-1 promotes mesenchymal transformation of glioma via a STAT-3/IL-6-dependent positive feedback loop. Oncotarget. 2015;6(26):22680–22697. doi: 10.18632/oncotarget.4205. [DOI] [PMC free article] [PubMed] [Google Scholar]
- 54.de la Iglesia N., Konopka G., Lim K.L., Nutt C.L., Bromberg J.F., Frank D.A. Deregulation of a STAT3-interleukin 8 signaling pathway promotes human glioblastoma cell proliferation and invasiveness. J Neurosci. 2008;28(23):5870–5878. doi: 10.1523/JNEUROSCI.5385-07.2008. [DOI] [PMC free article] [PubMed] [Google Scholar]
- 55.Chang A.L., Miska J., Wainwright D.A., Dey M., Rivetta C.V., Yu D. CCL2 Produced by the Glioma Microenvironment is Essential for the Recruitment of Regulatory T Cells and Myeloid-Derived Suppressor Cells. Cancer Res. 2016;76(19):5671–5682. doi: 10.1158/0008-5472.CAN-16-0144. [DOI] [PMC free article] [PubMed] [Google Scholar]