Abstract
Purpose:
One of the most common complaints among the elderly is the inability to understand speech in noisey environments. In many cases, these deficits are due to age-related hearing loss; however, some of the elderly that have difficulty hearing in noise have clinically normal pure-tone thresholds. While speech in noise testing is informative, it fails to identify specific frequencies responsible for the speech processing deficit. Auditory neuropathy patients and animal models of hidden hearing loss suggest that tone-in-noise thresholds may provide frequency specific information for those patients who express difficulty, but have normal thresholds in quiet. Therefore, we aimed to determine if tone-in-noise thresholds could be a useful measure in detecting age-related hearing deficits, despite having normal audiometric thresholds.
Materials & Methods:
We tested this hypothesis by measuring tone-in-noise thresholds in 11 Old (62.4 +/− 5 years) and 21 Young (23.1 +/− 2.2 years) patients with clinically normal thresholds. Tone thresholds were measured in a quite sound field, then in 20, 30 and 40 dB HL broadband noise.
Results:
Despite having normal hearing (thresholds ≤ 25 dB HL), the Old patients had significantly worse tone-in-noise thresholds than the Young patients at 0.125, 4, and 8 kHz. Linear regression analysis showed that the growth of masking in Old and Young patients was nearly identical at all frequencies. However, the amount of masking at low and high frequencies was typically 10–18 dB greater in the Old patients compared to the Young, except near 1 kHz. The frequency-dependent changes in masking are discussed in the context of a “line busy” model and temporal bone studies of auditory nerve fiber loss.
Keywords: noise, aging, tone, audiogram, masking noise and detection
1. Introduction
The world’s elderly population has been disproportionally increasing so that there are now more elderly people than ever before. Aging brings with it a host of chronic medical conditions. Presbycusis (i.e., age-related hearing loss), is one of the most prevalent, ranking among the top three health problems of the elderly along with arthritis and cardiovascular disease (Frisina et al. 2016). If hearing loss goes untreated, individuals are at higher risk for social isolation and depression (Gates and Mills 2005; Kalayam et al. 1995) (Health Quality 2008), which together may be risk factors contributing to dementia and cognitive decline (Lin et al. 2011; Thomson et al. 2017). Presbycusis is also accompanied by increased prevalence of tinnitus (Rosenhall and Karlsson 1991).
Pure-tone audiometric thresholds are routinely used to assess auditory function and to track demographic trends in age-related hearing loss; largely because pure tone audiometry is standardized, widely used, and easily quantified. Some age-related prevalence studies focus on pure-tone thresholds only in the speech frequencies (Chang and Chou 2007), while others include higher frequencies important for consonant discrimination (4–8 kHz)(Agrawal et al. 2008; Hoffman et al. 2017; Homans et al. 2017). Pure-tone audiometry has historically been considered the gold standard for assessing auditory function; however, pure-tone audiograms measured in quiet fail to address the chief complaint among most elderly hearing impaired patients, namely the difficulty of understanding speech in noisy environments. Some reports indicate that speech perception in the elderly is primarily determined by the amount of high frequency hearing loss (van Rooij et al. 1989). However, others have found relatively weak correlations between hearing thresholds and speech perception and also weak correlations between speech perception in quiet and speech perception in noise (Duquesnoy 1983; Frisina and Frisina 1997; Plomp 1986; Plomp and Mimpen 1979).
The weak correlations between pure tone thresholds and speech perception may be related to the nature of the hearing impairment or type of cochlear pathology (Schuknecht 1955). The pure tone audiogram seems to be most sensitive at detecting outer hair cell pathology, but is less likely to detect damage to the inner hair cells, stria vascularis, or spiral ganglion neurons (Chambers et al. 2016; Salvi et al. 2016; Schulte and Schmiedt 1992). In cases of auditory neuropathy, where the pathology occurs within inner hair cells, afferent synapses or spiral ganglion neurons, speech perception performance can be degraded to a far greater degree than one would predict from the pure tone audiogram (Amatuzzi et al. 2011; Merchant et al. 2001; Moser and Starr 2016; Rance and Starr 2015). Patients with auditory neuropathy not only have difficulty understanding speech, but they also have difficulty detecting tones in noise (Michalewski et al. 2005; Rance 2005; Vinay and Moore 2007; Zeng et al. 2005). When auditory neuropathy patients were evaluated with the threshold-equalizing noise (TEN) test, as well as psychophysical tuning curves, they were generally found to have relatively normal tuning, but showed greater than expected difficulty hearing a tone in noise, a result interpreted as poor detection efficiency, possibly due to impaired neural synchrony, neural degeneration or central processing deficits (Vinay and Moore 2007).
Similar to results in auditory neuropathy patients, we found significant tone-in-noise detection deficits in our chinchilla model in which the inner hair cells and auditory nerve fibers were selectively damaged by carboplatin (Lobarinas et al. 2015; Salvi et al. 2016; Wang et al. 2003; Wang et al. 1997). Chinchillas with selective inner hair cell lesions and neuron loss had normal neural tuning, normal otoacoustic emissions, and normal pure tone thresholds in quiet, but demonstrated great difficulty detecting tones presented in broadband noise. Because neural tuning was intact, our results suggested that poor tone-in-noise detection was likely the result of impaired detection efficiency due to lack of neural synchrony and/or loss of sound processing channels (inner hair cells and auditory nerve fibers).
In this context, it is interesting to note that spiral ganglion degeneration and damage to the inner hair cell/auditory nerve afferent synapse are believed to be major contributing factors in presbycusis (Fernandez et al. 2015; Kujawa and Liberman 2015; Viana et al. 2015). If neural degeneration is a major factor in presbycusis, then elderly subjects with relatively normal pure tone thresholds in quiet might be expected to have greater than normal difficulty detecting tones in background noise. To test this hypothesis, we recruited a group of elderly subjects with clinically normal or near normal thresholds in quiet and then compared their ability to detect tones in broadband noise with a group of young subjects with clinically normal hearing. We found that elderly subjects with clinically normal hearing had more difficulty detecting tones in noise than young subject. Unexpectedly, in addition to difficulty detecting tones in noise at high frequencies these deficits were also prominent at low frequencies, and surprisingly they were also more pronounced at low than high masker levels.
2. Methods and Materials
2.1. Study participants
A total of 42 patients consented to participate in this study. All the procedures were approved and performed in accordance with the ethical standards of the Responsible Committee on Human Experimentation of the Department of Sense Organs, Sapienza University of Rome (ID714) in accordance with the Helsinki Declaration (World Medical 2013). Patients were evaluated in the Audiology Unit of the Sapienza State University Hospital Policlinico Umberto I in Rome, Italy, during a 1-year period from April 2017 to April 2018. The 42 subjects were divided into Young and Old groups based on age. All of the Young patients had pure tone thresholds ≤ 25 dB HL at octaves intervals from 0.125 kHz to 8 kHz; however, 10 of the Old patients were eliminated from the study because they had pure tone thresholds >25 dB HL at one or more frequencies from 0.125 kHz and 8 kHz. The Young patients included in the study included 17 females and 4 males between 19–27 years of age (mean: 23.1 year, n =21) while 11 Old patients included 8 females and 3 males between 54–69 years of age (mean: 61.2 years).
2.2. Clinical evaluation
Patients underwent a health interview, otoscopy, acoustic immittance evaluation followed by air-conduction threshold measurement with earphones to screen for hearing loss and hearing asymmetries. Thresholds were measured with a calibrated dual channel GN Otometrics Aurical Plus audiometer and used to screen for hearing loss and hearing asymmetries at 0.125, 0.25, 0.5, 1, 2, 4, and 8 kHz using the standard clinical ascending-descending procedure in 5 dB HL steps. Subjects were excluded if thresholds differed by more than 10 dB between the left and right ears or if thresholds were > 25 dB HL. Other exclusion criteria included tinnitus, middle or inner-ear disease (e.g., otosclerosis, chronic suppurative otitis media or endolymphatic hydrops), retrocochlear disease or previous ear surgery. Afterwards, each Young and Old patient underwent binaural sound field testing using the same audiometer; the output of the audiometer was connected to an amplifier (Pioneer A209-R) and sound stimuli presented through a loudspeaker (Wharfedale Diamond 8.2) in a sound attenuating booth (length: 2.2 m, width: 2.2 m, height: 2.1 m). The loudspeaker was located approximately 1 meter directly in front of the subject at eye level. Pure tone stimuli were first presented in quiet to obtain a binaural sound field audiogram. Only subjects with sound field pure tone thresholds <25 dB HL at octave intervals from 0.125–8 kHz were included in the study. All 21 Young subjects met the pure tone threshold inclusion criterion whereas only 11 of the 21 Old subjects had pure tone thresholds < 25 dB HL from 0.125 to 8 kHz.
Afterwards, sound-field thresholds were measured in presence of broadband noise presented at 20 dB HL, then 30 dB HL followed by 40 dB HL. The broadband noise was presented from a second Wharfedale loudspeaker located approximately 1 meter directly behind the subject. The difference between tone thresholds measured in quiet versus tone thresholds measured in the presence of 20, 30 and 40 dB HL noise were used to calculate the dB thresholds shift due to the noise for each subject at each test frequency.
2.3. Data analysis
Statistical analyses were performed using Prism GraphPad v7. Pure tone thresholds in quiet and in background noise were analyzed using a two-way repeated measures ANOVA analysis and post hoc multiple comparisons. Linear regression analysis was performed to determine age and frequency effects for tone-in-noise threshold shifts. A p-value of 0.05 was used as the cutoff for statistical significance.
3. Results
3.1. Sound Thresholds in Quiet
Binaural pure tone thresholds in quiet are shown for each Young and Old subject in Table 1. All subjects presented with clinically normal pure tone thresholds <25 dB HL from 0.125 to 8 kHz. Mean thresholds (+/− 95% confidence interval) in the Young group (n = 21) and Old group (n = 11) are shown in Figure 1. Mean thresholds in the Young group ranged from 12 to 17 dB HL from 0.125 to 8 kHz while those in the Old group were slightly higher ranging from approximately 16 to 24 dB HL. There were some small between group differences, thresholds in the Old patients were slightly higher than those in the Young (F (1, 30) = 19.81, p<0.0001) at three frequencies, 0.25 kHz (p<0.05), 4 kHz (p<0.05) and 8 kHz (p<0.001) (Bonferroni post-test).
Table 1:
Pure Tone Thresholds in Quiet
| Young Sound Field Thresholds (dB HL) | Old Sound Field Thresholds (dB HL) | ||||||||||||||
|---|---|---|---|---|---|---|---|---|---|---|---|---|---|---|---|
| Subject # | 0.125 | 0.25 | 0.5 | 1 | 2 | 4 | 8 kHz | Subject # | 0.125 | 0.25 | 0.5 | 1 | 2 | 4 | 8 kHz |
| 1 | 15 | 10 | 10 | 10 | 10 | 25 | 15 | 1 | 25 | 25 | 15 | 15 | 10 | 15 | 20 |
| 2 | 20 | 20 | 20 | 15 | 20 | 15 | 15 | 2 | 20 | 15 | 15 | 15 | 20 | 15 | 25 |
| 3 | 20 | 10 | 10 | 10 | 15 | 15 | 10 | 3 | 20 | 15 | 20 | 15 | 15 | 20 | 25 |
| 4 | 15 | 15 | 15 | 10 | 15 | 15 | 15 | 4 | 20 | 20 | 15 | 10 | 20 | 25 | 20 |
| 5 | 20 | 15 | 20 | 15 | 15 | 15 | 15 | 5 | 25 | 20 | 25 | 20 | 25 | 25 | 25 |
| 6 | 15 | 15 | 10 | 10 | 10 | 20 | 10 | 6 | 25 | 20 | 15 | 15 | 25 | 25 | 25 |
| 7 | 10 | 10 | 10 | 10 | 10 | 10 | 10 | 7 | 15 | 15 | 20 | 20 | 20 | 20 | 20 |
| 8 | 10 | 10 | 10 | 10 | 15 | 20 | 25 | 8 | 15 | 20 | 20 | 15 | 20 | 25 | 25 |
| 9 | 10 | 10 | 10 | 10 | 20 | 15 | 15 | 9 | 20 | 15 | 10 | 10 | 25 | 20 | 25 |
| 10 | 15 | 15 | 10 | 15 | 15 | 15 | 15 | 10 | 20 | 25 | 20 | 20 | 15 | 20 | 25 |
| 11 | 15 | 10 | 15 | 15 | 15 | 10 | 10 | 11 | 20 | 20 | 20 | 20 | 15 | 25 | 25 |
| 12 | 10 | 10 | 15 | 10 | 15 | 10 | 10 | ||||||||
| 13 | 20 | 20 | 15 | 15 | 15 | 15 | 15 | ||||||||
| 14 | 20 | 20 | 15 | 15 | 20 | 15 | 15 | ||||||||
| 15 | 15 | 15 | 15 | 10 | 20 | 15 | 15 | ||||||||
| 16 | 15 | 15 | 15 | 15 | 15 | 20 | 20 | ||||||||
| 17 | 15 | 15 | 15 | 15 | 15 | 15 | 15 | ||||||||
| 18 | 20 | 20 | 15 | 15 | 20 | 25 | 25 | ||||||||
| 19 | 20 | 15 | 20 | 15 | 25 | 25 | 25 | ||||||||
| 20 | 20 | 10 | 15 | 10 | 15 | 10 | 10 | ||||||||
| 21 | 25 | 20 | 20 | 15 | 20 | 25 | 25 | ||||||||
| Mean | 16.4 | 14.3 | 14.3 | 12.6 | 16.2 | 16.7 | 15.7 | Mean | 20.5 | 19.1 | 17.7 | 15.9 | 19.1 | 21.4 | 23.6 |
| STD | 4.1 | 3.9 | 3.5 | 2.5 | 3.7 | 5.0 | 5.2 | STD | 3.3 | 3.6 | 3.9 | 3.6 | 4.7 | 3.7 | 2.2 |
Figure 1:
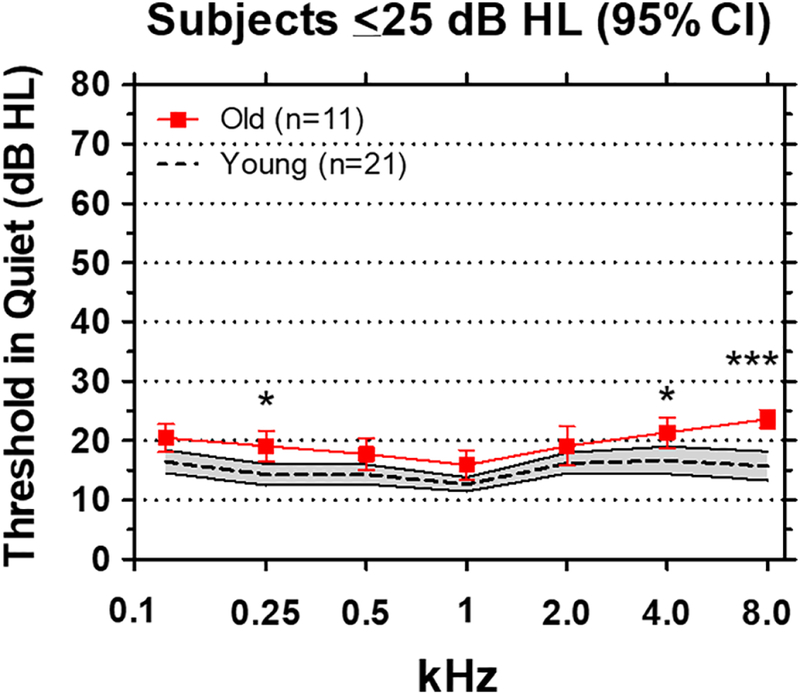
Pure tone thresholds in sound field. Mean thresholds (dashed line, shaded area: +/−95% confidence interval) of 21 Young subjects. Mean thresholds (red solid line, +/−95% confidence interval) of 11 Old subjects. Thresholds in the Old group were significantly higher than the Young group at 0.25 kHz (p<0.05), 4 kHz (p<0.05) and 8 kHz (p<0.001).
3.2. Tone Detection in 20 dB Masking Noise
A broadband noise of 20 dB HL was added to the sound field to determine how much it would influence tone thresholds in different spectral regions. To quantify the effect, we computed the threshold shift induced by the background noise at each frequency for each subject, i.e., the difference between thresholds in noise versus quiet. The mean threshold shift induced by the 20 dB HL noise in the Young group (n=21) is shown by the dashed line in Figure 2A; the shaded area outlines the 95% confidence interval. The mean thresholds shifts in the Young ranged from approximately 17 dB at 1 kHz to 26 dB 8 kHz. The threshold shifts in the Old group were much larger than in the Young group except at 1 kHz. The largest threshold shifts in the Old group occurred at 0.125 kHz and at 8 kHz. Overall, the threshold shifts in the Old group were significantly larger than the Young group (F (1, 30) = 16.72). Significant differences were observed at four of the seven frequencies (Bonferroni post-test), namely 0.125 kHz (p<0.01), 0.5 kHz (p<0.05), 4 kHz (p<0.01) and 8 kHz (p<0.01).
Figure 2:
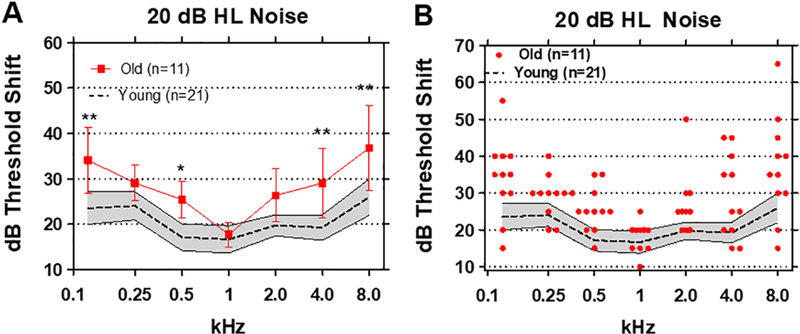
(A) Mean (n=21, dashed line) thresholds shifts in Young (shaded area: 95% confidence interval) and Old (n=11, +/− 95% confidence interval) in 20 dB HL broadband noise. Threshold shifts in the Old were significantly greater than Young at 0.125 kHz (p<0.01), 0.5 kHz (p<0.05), 4 and 8 kHz (p<0.01). (B) Threshold shifts in 20 dB HL noise for Young subjects (n=21, shaded area: +/− 95% confidence interval). Red symbols show individual threshold shifts as function of test frequency for Old subjects.
Large individual differences in the amount of threshold shift were observed in the elderly (Figure 2B). In one case, the threshold shift was as large as 65 dB at 8 kHz. In another case, a 55 dB threshold shift was observed at 0.125 kHz while at 2 kHz and 4 kHz threshold shifts of 50 dB and 45 dB were observed in one or more subjects. The large variability in thresholds shifts seen at low and high frequencies cannot simply be due to age or to test procedures because the threshold shifts and variability in the Old subjects were nearly identical to those of the Young at 1 kHz.
The large variability and exceptionally large thresholds shifts raised the possibility that some elderly subjects with difficulty detecting a tone in noise at one frequency might display a similar problem at all frequencies, i.e., a global problem related to age. To test these hypothesis, scatterplots were prepared showing an Old patient’s threshold shift at 0.125 kHz (x-axis) versus the subject’s threshold shift at 0.25, 0.5, 1, 2, 4, or 8 kHz (Figure 3). There was little correlation between the threshold shifts at 0.125 kHz and the threshold shifts at 0.25, 0.5, 1, 2, and 4 kHz. However, there was a robust correlation (r2=0.68) between the thresholds shifts at 0.125 kHz and 8 kHz. Therefore, Old patients that had difficult detecting an 8 kHz tone in noise also found it extremely difficult to detect a 0.125 kHz tone in noise, but not other frequencies.
Figure 3:
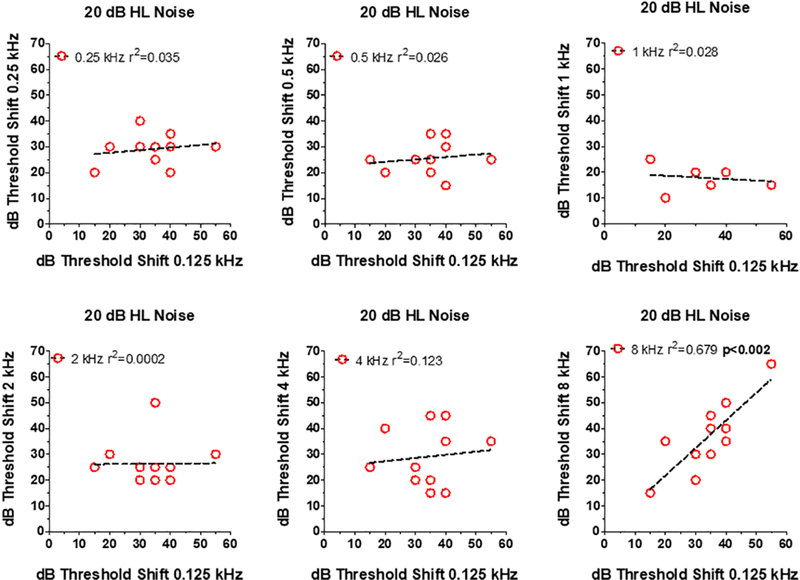
Relationship between dB thresholds shift at 0.125 kHz (x-axis) in 20 dB HL noise versus thresholds at one of the other 6 test frequencies (see y-axis in each panel). Symbols show data for individual subjects. In each panel, the dashed line shows a linear regression fit to the data and the r2 value. Correlation between 0.125 and 8 kHz statistically significant (p<0.002).
3.3. Tone Detection in 30 dB Masking Noise
As expected, increasing the background noise to 30 dB HL made it more difficult for both Old and Young subjects to detect the tone stimuli. Mean threshold shifts (+/− 95% confidence interval) in the Young group ranged from approximately 28 at 0.5 and 1 kHz to around 38 dB at 8 kHz. The means of thresholds shifts (+/− 95% confidence interval) in the Old group were above the 95% confidence interval of the Young group at all frequencies except at 1 kHz. In the Old group, the mean thresholds varied from a low of approximately 30 dB at 1 kHz to highs of 48 dB at 8 kHz and 43 dB at 0.125 kHz (Figure 4A). For the 30 dB HL Noise, the threshold shifts in the Old group were again significantly higher than the Young group (F (1, 30) = 13.75). Threshold shifts in the Old group were significantly higher than those in the Young at 0.125 kHz (p<0.05), 2 kHz (p<0.05), 4 kHz (p<0.05) and 8 (p<0.01) kHz (Bonferroni post-hoc analysis).
Figure 4:
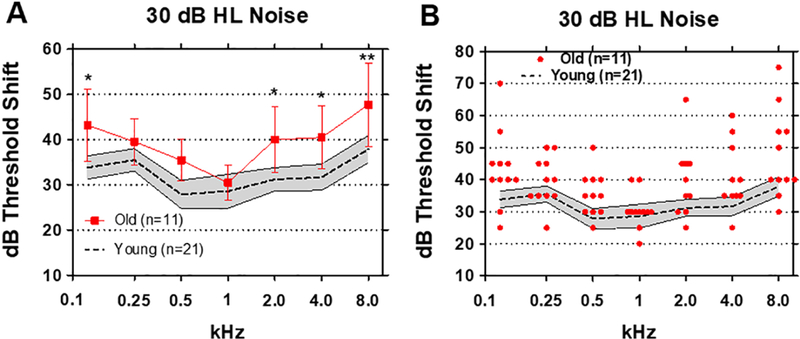
(A) Mean (n=21, dashed line) thresholds shifts in Young (shaded area: 95% confidence interval) and Old (n=11, +/− 95% confidence interval) in 30 dB HL broadband noise. Threshold shifts in the Old were significantly greater than Young at 0.125 kHz (p<0.05), 2 kHz (p<0.05), 4 kHz (p<0.05) and 8 kHz (p<0.01). (B) Threshold shifts in 20 dB HL noise for Young subjects (n=21, shaded area: +/− 95% confidence interval). Red symbols show individual threshold shifts as function of test frequency for Old subjects.
The performance of individuals in 30 dB background noise varied considerably with some Old subjects performing as well as Young subjects (Figure 4B). On the other hand, the threshold shifts in some Old subjects were much worse than in the Young. In a few subjects, the threshold shifts were as great as 65–75 dB at the low and high frequencies (Figure 4B). Interestingly, most of the Old subjects performed as well as the Young at 1 kHz. These results suggest that tone-in-noise detection among the elderly is most severely degraded at low and high frequencies and largely unaffected at 1 kHz.
To determine if an elderly subject with poor tone-in-noise detection at one frequency also performed poorly at other frequencies, scatterplots were prepared showing an Old patient’s threshold shift at 0.125 kHz (x-axis) versus the threshold shift 0.25, 0.5, 1, 2, 4 or 8 kHz (Figure 5). There was no relationship between the threshold shifts at 0.125 kHz and threshold shifts at 0.5, 1, 2, and 4 kHz. But, there was a significant (p<0.03) correlation (r2=0.431) between the thresholds shifts at 0.125 kHz and 0.25 kHz and also a significant (p<0.004) and strong correlation (r2=0.62) between the threshold shifts at 0.125 kHz and 8 kHz. Old patients that had difficulty detecting a 0.125 kHz tone-in-noise also found it extremely difficult to detect a 0.25 kHz tone or an 8 kHz tone in broadband noise.
Figure 5:
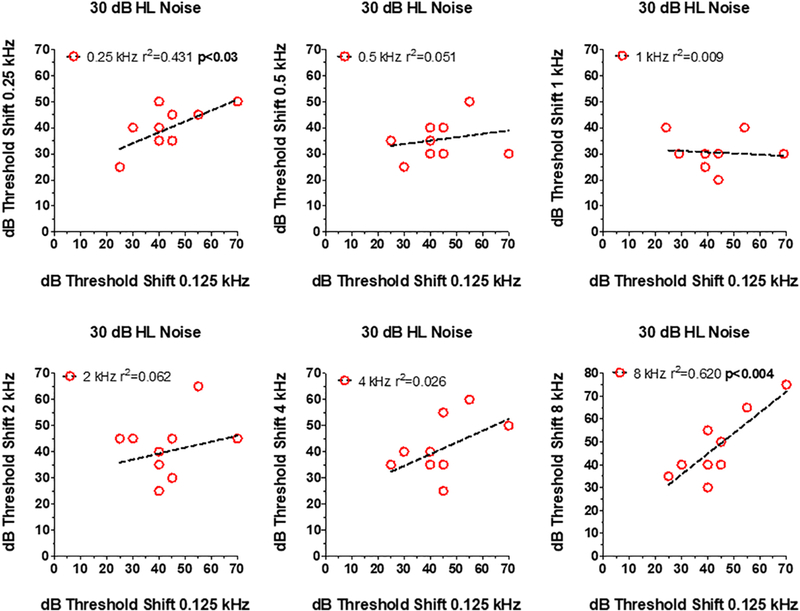
Relationship between dB thresholds shift at 0.125 kHz (x-axis) in 30 dB HL noise versus thresholds at one of the other 6 test frequencies (see y-axis in each panel). Symbols show data for individual subjects. In each panel, the dashed line shows a linear regression fit to the data and the r2 value. Correlation between 0.125 and 0.25 kHz and between 0.125 kHz (p<0.03) and 8.0 kHz (p<0.004) statistically significant.
3.4. Tone Detection in 40 dB Masking Noise
To determine the extent to which tone detection would deteriorate at higher masker levels, we increased the broadband noise intensity to 40 dB HL. In the Young group, mean (+/−95% confidence interval) threshold shifts ranged from a low of 38 dB at 0.5 kHz to highs of 48 dB at 8 kHz and 44 dB at 4 kHz (Figure 6A). Mean (+/− 95% confidence interval) threshold shifts in the Old group ranged from a low of 39 dB at 1 kHz to highs of 56 dB at 8 kHz and 52 dB at 0.125 kHz. The mean thresholds shift in the Old group were significantly higher than those in the Young group (F (1, 30) = 8.36, p<0.01). Although the mean threshold shifts in the Old group were above the 95% confidence of the Young group except at 1 kHz, only the threshold shifts at 0.125 kHz in the Old group were significantly greater than the Young (p< 0.005, Bonferroni post-hoc). There was considerable variability in the magnitude of thresholds shift especially at low and high frequencies (Figure 6B). Threshold shifts in the presence of the 40 dB masker were as high as 75 and 80 dB in some Old subjects at 0.125 and 8 kHz respectively; however, the threshold shifts in the Old subjects were similar to those in Young subjects at 1 kHz, consistent with the results obtained with the 20 and 30 dB HL maskers.
Figure 6:
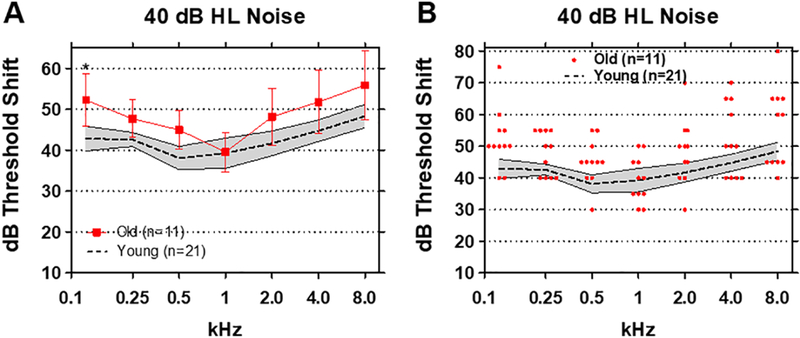
(A) Mean (n=21, dashed line) thresholds shifts in Young (shaded area: 95% confidence interval) and Old (n=11, +/− 95% confidence interval) in 40 dB HL broadband noise. Threshold shifts in the Old were significantly greater than Young at 0.125 kHz (p<0.05). (B) Threshold shifts in 40 dB HL noise for Young subjects (n=21, shaded area: +/− 95% confidence interval). Red symbols show individual threshold shifts as function of test frequency for Old subjects.
To determine if subjects with poor tone-in-noise detection at one frequency performed poorly at other frequencies, scatterplots were prepared showing an Old patient’s threshold shift at 0.125 kHz (x-axis) versus the threshold shift 0.25, 0.5, 1, 2, 4 or 8 kHz (Figure 7). There was no relationship between the threshold shifts at 0.125 kHz and those at 0.5, 1, 2, and 4 kHz; however, there was a significant (p<0.03) and strong correlation (r2=0.434) between the thresholds shifts at 0.125 kHz and 0.25 kHz and a significant (p<0.001) and robust correlation (r=0.722) between the threshold shifts at 0.125 kHz and 8 kHz. In general, Old patients that had difficulty detecting a 0.125 kHz tone in noise also found it extremely difficult to detect a 0.25 kHz and 8 kHz tones in broadband noise.
Figure 7:
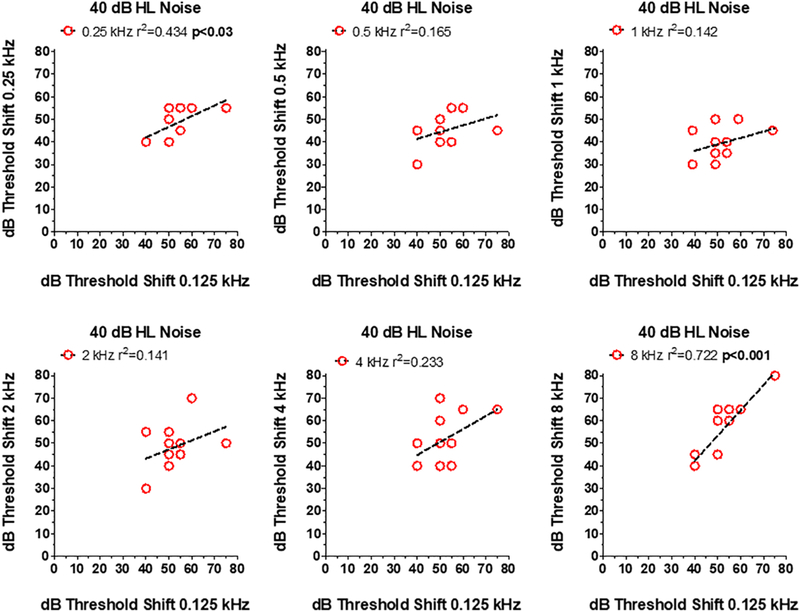
Relationship between dB thresholds shift at 0.125 kHz (x-axis) in 40 dB HL noise versus thresholds at one of the other 6 test frequencies (see y-axis in each panel). Symbols show data for individual subjects. In each panel, the dashed line shows a linear regression fit to the data and the r2 value. Correlation between 0.125 and 0.25 kHz (p<0.03) and between 0.125 kHz and 8.0 kHz (p<0.004) statistically significant.
3.5. Growth of Masking
Visual inspection of the threshold shift data (Figure 2–4) suggested that there would be major differences in the y-intercept (i.e., the threshold shift at 0 dB HL masker intensity), but only minor differences in the rate of growth of threshold shift as the masker level increased for different test frequencies. To examine this issue, we plotted the amount of thresholds shift as function of masker level for each frequency (Figure 8). Linear regression was used to compute the slope, m (dB threshold shift per dB masker level) and the y-intercept (thresholds shift with a masker level of 0 dB HL). Table 2 and individual panels in Figure 8 show the data for Young and Old with the test frequency and values of m and y indicated in the legend of each panel. The slopes in the Young and Old were similar across the frequency range varying from 0.93 to 1.25 in the Young and from 0.91 to 1.14 in the Old. However, the y-intercept values were consistently larger in the Old than the Young. In the Young, the y-intercept values ranged from - 6.3 to +6.2 whereas in the Old the y-intercept values varied from −3.5 to 18.2. The largest differences in y-intercept values occurred at high and very low frequencies, whereas the differences were minimal at 1 kHz.
Figure 8:
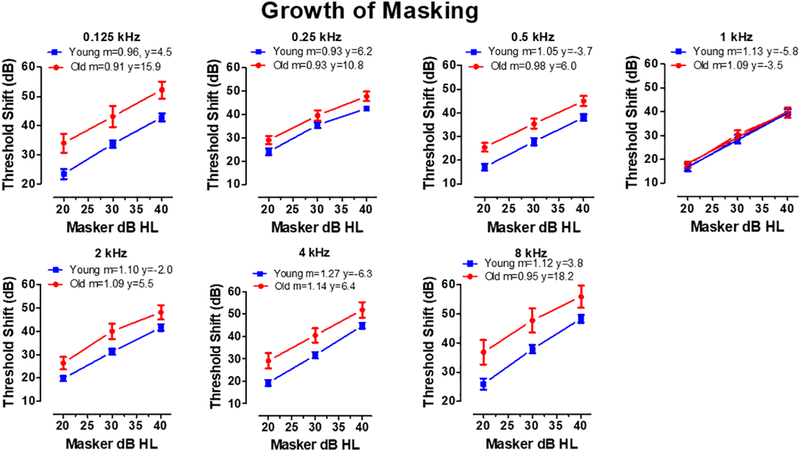
Each panel shows the mean (+/− SEM) threshold shift in Old and Young patients as function of masker level (dB HL). The legend in each panel indicates the test frequency and the slope (m) and y-intercept (y) of the linear regression line fit to the Old and Young data sets.
Table 2:
Growth of Masking
| Young | Old | Young | Old | |
|---|---|---|---|---|
| Slope | Slope | Y-Intercept | Y-intercept | |
| kHz | (dB shift/dB HL) | (dB shift/dB HL) | (dB) | (dB) |
| 0.125 | 0.96 | 0.91 | 4.5 | 15.9 |
| 0.25 | 0.93 | 0.93 | 6.2 | 10.8 |
| 0.5 | 1.05 | 0.98 | −3.7 | 6.0 |
| 1 | 1.13 | 1.09 | −5.8 | −3.5 |
| 2 | 1.10 | 1.09 | −2.0 | 5.5 |
| 4 | 1.27 | 1.14 | −6.3 | 6.3 |
| 8 | 1.12 | 0.95 | 3.8 | 18.2 |
| Mean | 1.08 | 1.01 | −0.5 | 8.5 |
| SD | 0.11 | 0.09 | 5.2 | 7.3 |
| Max | 1.27 | 1.14 | 6.20 | 18.20 |
| Min | 0.93 | 0.91 | −6.30 | −3.50 |
4. Discussion
Pure tone audiometry fails to address one of the most common complaints among the hearing impaired elderly, namely difficulty understanding speech in noise (Frisina and Frisina 1997). Speech-in-noise testing can be used to obtain a more realistic assessment of auditory function; however, such tests are difficult to standardize worldwide due to the diversity in the spectral-temporal features and dialects of different languages. Moreover, the spectral characteristics of speech are complex making it difficult to pinpoint specific frequencies that contribute to speech processing deficits in noise. Studies in auditory neuropathy patients and animals with selective damage to inner hair cells and auditory nerve fibers suggest that tone-in-noise thresholds could be a sensitive, frequency-specific metric for identifying auditory processing deficits in elderly subjects whose pure tone audiograms in quiet are ostensibly normal (Salvi et al. 2016; Vinay and Moore 2007). The tone in broadband noise paradigm revealed significant frequency-specific tone detection deficits in elderly subjects with clinically normal hearing. The greatest deficits were observed at low and high frequencies, but were absent at mid-frequencies. Significant tone-in-noise detection deficits were evident in the Old subjects at the two lowest masker levels, 20 and 30 dB HL, but were less different from Young subjects at 40 dB HL.
4.1. Clinically Normal Audiograms and Threshold Shift Metrics
To minimize thresholds differences between the Young and Old groups, we selected 11 Old subjects with clinically normal audiograms (i.e., quiet thresholds <25 dB HL from 0.125 to 8 kHz) and compared them to the 21 Young subjects with clinically normal hearing (< 25 dB HL). Although the thresholds of the 11 Old subjects were within the clinically normal range, the mean thresholds in the Old group were 3–8 dB higher than the Young (Figure 1). While these differences are relatively small, we sought to further minimize their effects on tone-in-noise testing by computing the threshold shift of each subject, i.e., the degree to which the broadband noise increased a patient’s threshold above that individual’s threshold in quiet. This normalization procedure ostensibly mitigates any between-group threshold differences.
4.2. Frequency Effects
Tone-in-noise testing revealed frequency-dependent differences between Old and Young patients. At 0.125 kHz, the threshold shifts in the Old group were always significantly greater than the Young at all masker levels. There were no significant differences in quiet thresholds between Young and Old at 0.125 kHz; therefore, the larger thresholds shifts induced by the masker in the Old subjects are difficult to attribute to differences in absolute sensitivity. At the two lowest masker levels, tone-in-noise detection was impaired at four of seven frequencies in the Old subjects. With a 30 dB HL masker level, the Old performed significantly worse than the Young at 0.125, 2, 4 and 8 kHz while at 20 dB HL, the Old performed worse than the young at 125, 0.5, 4, and 8 kHz. The common frequencies affected at both intensities were 0.125 kHz, 4 and 8 kHz. If poor tone-in-noise detection was simply due to age per se, performance should have been impaired at all seven frequencies. However, since threshold shifts in the Old were never different from the Young at 0.25 and 1 kHz regardless of masker level, it seems unlikely that deficits are the results of general age-related processing deficit.
4.3. Mechanisms
The frequency-specific nature of these deficits could be due to several factors. One neural processing deficit that could affect tone-in-noise detection at low frequencies is impaired neural synchrony and neural phase locking. This interpretation is consistent with neural dys-synchrony models of auditory neuropathy (Hood 2015; Zeng et al. 1999) as well as deficits in neural synchrony observed in animal models of noise-induced neuropathy (Shaheen et al. 2015). Another factor that could play a role is the number of type I auditory nerve fibers present along the length of the cochlea. In one temporal bone study from elderly human subjects with no history of hearing problems and minimal hair cell loss, nerve fiber counts were highest around 1 kHz; this region also had the fewest orphan ribbon synapses (Viana et al. 2015). Thus, the 1 kHz region appeared to be the most neurologically normal regions along the length of the cochlea. Interestingly, the 1 kHz region is where our Old subjects performed as well as our Young subjects. In contrast, fewer auditory nerve fibers were present at low frequencies (0.125–0.25 kHz) and high frequencies (4–8 kHz) compared to 1 kHz; the low and high frequency regions also had more orphan ribbon synapses than the 1 kHz regions (Viana et al. 2015). Thus, the poor tone-in-noise detection seen in our Old subjects at low and high frequencies corresponds well to the reduced number of afferent nerve fibers and increased number of orphan ribbon synapses seen in the low and high frequency regions of the cochlea of elderly subjects (Viana et al. 2015).
4.4. Line Busy Model
Each type I auditory nerve fiber represents a transmission line that relays acoustic information to the central auditory pathway. When broadband noise is presented, the noise creates a “line busy” signal in a fraction of the total pool of available neurons within a tonotopic region. If aging reduces the number of functional afferent neurons, then the probability that a neuron will respond to a tone presented in the noise will be greatly reduced due to a shortage of un-adapted neurons. To increase the probability of eliciting a tone-evoked response when a channel is “busy”, the tone intensity would need to be substantially increased in a tonotopic region where there is a diminished number of nerve fibers or afferent synapses. According to this model, tone-in-noise detection would be poorest in regions with the fewest nerve fibers and better in regions with the greatest number of nerve fibers. Our results show that the poorest tone-in-noise performance (i.e., most threshold shift in noise) occurred at low and high frequencies and the best performance at 1 kHz consistent with human temporal bone studies (Viana et al. 2015).
4.3. Intensity Coding and Tone Detection
A popular model of intensity coding is based on the distribution of low, medium, and high spontaneous rate auditory nerve fibers (Liberman 1978; Salvi et al. 1983). High spontaneous rate fibers (66% of neurons) with low thresholds are considered important for detecting tones in quiet while those with medium spontaneous rates (23%) are most effective at detecting sound of moderate intensity. Low spontaneous rate fibers (11%), some with thresholds as high as 80 dB SPL, only respond at high intensities. In this model, low spontaneous rate fibers are thought to play an important role in detecting high intensity sound particularly in the presence of background noise, where the firing rates of moderate and high spontaneous rate fibers are saturated. Age related hearing loss is associated with the preferential loss of low spontaneous rate, high threshold neurons (Liberman and Kujawa 2017). The preferential loss of high threshold neurons should make it more difficult for older subjects to detect a tone in quiet. While the threshold shifts in noise of our Old subjects were generally greater than those in the Young, significant differences between the Old and Young were more frequently seen at 20 and 30 dB HL masker levels than at the 40 dB HL masker; the only significant difference at 40 dB HL masker level occurred at 0.125 kHz. Because tone-in-noise detection was significantly impaired with the 20 dB masker, our results suggest that aging may leads to a loss of both moderate and high spontaneous rate fibers, not just low-spontaneous, high-thresholds fibers.
4.4. Growth of Masking
Threshold shifts in Young and Old patients increased at roughly the same rate as masker level increased (Figure 8) regardless of test frequency. These results suggest that the neural processes that cause thresholds to increase with increasing masker level are largely invariant across frequency in both Old and Young patients. Except for 1 kHz, the main difference between the Young and Old was the y-intercept, i.e., the starting level of threshold shift induced by the masker. At 8 kHz, threshold shifts in noise were approximately 18 dB higher in the Old than the Young and at 0.125 and 0.25 kHz, the thresholds shifts in Old were 16 and 11 dB higher respectively. Because the y-intercept was much higher at low and high frequencies than at 1 kHz, our results suggest that the masker activates a greater proportion of neurons in the Old subjects compared to the Young. Therefore, fewer neurons would be available to respond when a high or low frequency tone is presented in noise.
4.5. Future Directions
While tone-in-noise detection measurements in the sound field are more realistic than listening under headphones, free sound field measurement fail to identify ear specific deficits. Future studies conducted under headphones could reveal whether the frequency-specific deficits on the tone-in-noise task are similar or different between ears. Sound field testing also involves binaural interactions and provides sound localization cues. Consequently, age-related dysfunctions in binaural processing (e.g., masking level difference) and sound localization could conceivably influence an elderly subject’s ability to detect tones in noise. Monaural and binaural measurements made with earphones could potentially identify such deficits. Another promising direction for extending this work is on young subjects with ostensibly normal hearing, but with a history of noise exposure or ototoxic drugs.
On average, our tone-in-noise detection paradigm identified frequency-specific deficits in Old subjects at 0.125, 4, and 8 kHz, but these deficits were clearly more severe in some elderly subjects than others as illustrated in Figures 2B, 4B and 6B. On the basis of these large individual differences, one would predict that subjects with poorer tone-in-noise detection would have greater difficulty with speech recognition in noise. While tone detection in noise is not equavlent to speech comprehension, further analysis incorporating tools such as the speech intelligibility index could reveal translatable correlations between the frequency-specific tone-in-noise deficits and the audibility of speech phonemes in various noise environments. For example, a subject with extremely poor tone-in-noise detection at 8 kHz might be expected to have considerable difficulty recognizing phonemes with considerable spectral energy in the 8 kHz region (e.g., “s” & “th”), but perform better and have less difficulty recognizing phonemes in which the spectral energy is more heavily weighted to 2 kHz region (e.g., “g” & “sh” ). Finally, after such frequency-specific tone-in-noise correlations were made with speech phonemes, tone-in-noise thresholds could become tailorable to the fitting of hearing aids rather than simply using the pure tone audiogram measured in quiet, ultimately adressing the primary complaint of understanding speech in noisy environments.
Acknowledgements
Research supported in part by NIH grant R01DC014693. Some preliminary aspects of this data were reported in the XXXVI National Meeting of the Italian Society of Audiology and Phoniatrics in Siena, Italy September 27–30, 2017.
Footnotes
Publisher's Disclaimer: This is a PDF file of an unedited manuscript that has been accepted for publication. As a service to our customers we are providing this early version of the manuscript. The manuscript will undergo copyediting, typesetting, and review of the resulting proof before it is published in its final citable form. Please note that during the production process errors may be discovered which could affect the content, and all legal disclaimers that apply to the journal pertain.
Disclosure of Interest
The authors report no conflict of interest.
References
- Agrawal Y, Platz EA, Niparko JK. 2008. Prevalence of hearing loss and differences by demographic characteristics among US adults: data from the National Health and Nutrition Examination Survey, 1999–2004. Arch Intern Med 168(14):1522–1530. [DOI] [PubMed] [Google Scholar]
- Amatuzzi M, Liberman MC, Northrop C. 2011. Selective inner hair cell loss in prematurity: a temporal bone study of infants from a neonatal intensive care unit. J Assoc Res Otolaryngol 12(5):595–604. [DOI] [PMC free article] [PubMed] [Google Scholar]
- Chambers AR, Resnik J, Yuan Y, Whitton JP, Edge AS, Liberman MC, Polley DB. 2016. Central Gain Restores Auditory Processing following Near-Complete Cochlear Denervation. Neuron [DOI] [PMC free article] [PubMed]
- Chang HP, Chou P. 2007. Presbycusis among older Chinese people in Taipei, Taiwan: a community-based study. Int J Audiol 46(12):738–745. [DOI] [PubMed] [Google Scholar]
- Duquesnoy AJ. 1983. The intelligibility of sentences in quiet and in noise in aged listeners. J Acoust Soc Am 74(4):1136–1144. [DOI] [PubMed] [Google Scholar]
- Fernandez KA, Jeffers PW, Lall K, Liberman MC, Kujawa SG. 2015. Aging after noise exposure: acceleration of cochlear synaptopathy in “recovered” ears. J Neurosci 35(19):7509–7520. [DOI] [PMC free article] [PubMed] [Google Scholar]
- Frisina DR, Frisina RD. 1997. Speech recognition in noise and presbycusis: relations to possible neural mechanisms. Hear Res 106(1–2):95–104. [DOI] [PubMed] [Google Scholar]
- Frisina RD, Ding B, Zhu X, Walton JP. 2016. Age-related hearing loss: prevention of threshold declines, cell loss and apoptosis in spiral ganglion neurons. Aging (Albany NY) 8(9):2081–2099. [DOI] [PMC free article] [PubMed] [Google Scholar]
- Gates GA, Mills JH. 2005. Presbycusis. Lancet 366(9491):1111–1120. [DOI] [PubMed] [Google Scholar]
- Health Quality O 2008. Social isolation in community-dwelling seniors: an evidence-based analysis. Ont Health Technol Assess Ser 8(5):1–49. [PMC free article] [PubMed] [Google Scholar]
- Hoffman HJ, Dobie RA, Losonczy KG, Themann CL, Flamme GA. 2017. Declining Prevalence of Hearing Loss in US Adults Aged 20 to 69 Years. JAMA Otolaryngol Head Neck Surg 143(3):274–285. [DOI] [PMC free article] [PubMed] [Google Scholar]
- Homans NC, Metselaar RM, Dingemanse JG, van der Schroeff MP, Brocaar MP, Wieringa MH, Baatenburg de Jong RJ, Hofman A, Goedegebure A. 2017. Prevalence of age-related hearing loss, including sex differences, in older adults in a large cohort study. Laryngoscope 127(3):725–730. [DOI] [PubMed] [Google Scholar]
- Hood LJ. 2015. Auditory Neuropathy/Dys-Synchrony Disorder: Diagnosis and Management. Otolaryngol Clin North Am 48(6):1027–1040. [DOI] [PubMed] [Google Scholar]
- Kalayam B, Meyers BS, Kakuma T, Alexopoulos GS, Young RC, Solomon S, Shotland R, Nambudiri D, Goldsmith D. 1995. Age at onset of geriatric depression and sensorineural hearing deficits. Biol Psychiatry 38(10):649–658. [DOI] [PubMed] [Google Scholar]
- Kujawa SG, Liberman MC. 2015. Synaptopathy in the noise-exposed and aging cochlea: Primary neural degeneration in acquired sensorineural hearing loss. Hear Res [DOI] [PMC free article] [PubMed]
- Liberman MC. 1978. Auditory-nerve response from cats raised in a low-noise chamber. J Acoust Soc Am 63(2):442–455. [DOI] [PubMed] [Google Scholar]
- Liberman MC, Kujawa SG. 2017. Cochlear synaptopathy in acquired sensorineural hearing loss: Manifestations and mechanisms. Hear Res 349:138–147. [DOI] [PMC free article] [PubMed] [Google Scholar]
- Lin FR, Metter EJ, O’Brien RJ, Resnick SM, Zonderman AB, Ferrucci L. 2011. Hearing loss and incident dementia. Archives of neurology 68(2):214–220. [DOI] [PMC free article] [PubMed] [Google Scholar]
- Lobarinas E, Salvi R, Ding D. 2015. Selective Inner Hair Cell Dysfunction in Chinchillas Impairs Hearing-in-Noise in the Absence of Outer Hair Cell Loss. J Assoc Res Otolaryngol [DOI] [PMC free article] [PubMed]
- Merchant SN, McKenna MJ, Nadol JB Jr., Kristiansen AG, Tropitzsch A, Lindal S, Tranebjaeizrg L. 2001. Temporal bone histopathologic and genetic studies in Mohr-Tranebjaerg syndrome (DFN-1). Otol Neurotol 22(4):506–511. [DOI] [PubMed] [Google Scholar]
- Michalewski HJ, Starr A, Nguyen TT, Kong YY, Zeng FG. 2005. Auditory temporal processes in normal-hearing individuals and in patients with auditory neuropathy. Clin Neurophysiol 116(3):669–680. [DOI] [PubMed] [Google Scholar]
- Moser T, Starr A. 2016. Auditory neuropathy--neural and synaptic mechanisms. Nat Rev Neurol 12(3):135–149. [DOI] [PubMed] [Google Scholar]
- Plomp R 1986. A signal-to-noise ratio model for the speech-reception threshold of the hearing impaired. J Speech Hear Res 29(2):146–154. [DOI] [PubMed] [Google Scholar]
- Plomp R, Mimpen AM. 1979. Speech-reception threshold for sentences as a function of age and noise level. J Acoust Soc Am 66(5):1333–1342. [DOI] [PubMed] [Google Scholar]
- Rance G 2005. Auditory neuropathy/dys-synchrony and its perceptual consequences. Trends Amplif 9(1):1–43. [DOI] [PMC free article] [PubMed] [Google Scholar]
- Rance G, Starr A. 2015. Pathophysiological mechanisms and functional hearing consequences of auditory neuropathy. Brain 138(Pt 11):3141–3158. [DOI] [PubMed] [Google Scholar]
- Rosenhall U, Karlsson AK. 1991. Tinnitus in old age. Scand Audiol 20(3):165–171. [DOI] [PubMed] [Google Scholar]
- Salvi R, Sun W, Ding D, Chen GD, Lobarinas E, Wang J, Radziwon K, Auerbach BD. 2016. Inner Hair Cell Loss Disrupts Hearing and Cochlear Function Leading to Sensory Deprivation and Enhanced Central Auditory Gain. Front Neurosci 10:621. [DOI] [PMC free article] [PubMed] [Google Scholar]
- Salvi RJ, Henderson D, Hamernik R, Ahroon WA. 1983. Neural correlates of sensorineural hearing loss. Ear Hear 4(3):115–129. [DOI] [PubMed] [Google Scholar]
- Schuknecht HF. 1955. Presbycusis. Laryngoscope 65(6):402–419. [DOI] [PubMed] [Google Scholar]
- Schulte BA, Schmiedt RA. 1992. Lateral wall Na,K-ATPase and endocochlear potentials decline with age in quiet-reared gerbils. Hear Res 61(1–2):35–46. [DOI] [PubMed] [Google Scholar]
- Shaheen LA, Valero MD, Liberman MC. 2015. Towards a Diagnosis of Cochlear Neuropathy with Envelope Following Responses. J Assoc Res Otolaryngol 16(6):727–745. [DOI] [PMC free article] [PubMed] [Google Scholar]
- Thomson RS, Auduong P, Miller AT, Gurgel RK. 2017. Hearing loss as a risk factor for dementia: A systematic review. Laryngoscope Investig Otolaryngol 2(2):69–79. [DOI] [PMC free article] [PubMed] [Google Scholar]
- van Rooij JC, Plomp R, Orlebeke JF. 1989. Auditive and cognitive factors in speech perception by elderly listeners. I: Development of test battery. J Acoust Soc Am 86(4):1294–1309. [DOI] [PubMed] [Google Scholar]
- Viana LM, O’Malley JT, Burgess BJ, Jones DD, Oliveira CA, Santos F, Merchant SN, Liberman LD, Liberman MC. 2015. Cochlear neuropathy in human presbycusis: Confocal analysis of hidden hearing loss in post-mortem tissue. Hear Res 327:78–88. [DOI] [PMC free article] [PubMed] [Google Scholar]
- Vinay Moore BC. 2007. Ten(HL)-test results and psychophysical tuning curves for subjects with auditory neuropathy. Int J Audiol 46(1):39–46. [DOI] [PubMed] [Google Scholar]
- Wang J, Ding D, Salvi RJ. 2003. Carboplatin-induced early cochlear lesion in chinchillas. Hear Res 181(1–2):65–72. [DOI] [PubMed] [Google Scholar]
- Wang J, Powers NL, Hofstetter P, Trautwein P, Ding D, Salvi R. 1997. Effects of selective inner hair cell loss on auditory nerve fiber threshold, tuning and spontaneous and driven discharge rate. Hear Res 107(1–2):67–82. [DOI] [PubMed] [Google Scholar]
- World Medical A 2013. World Medical Association Declaration of Helsinki: ethical principles for medical research involving human subjects. Jama 310(20):2191–2194. [DOI] [PubMed] [Google Scholar]
- Zeng FG, Kong YY, Michalewski HJ, Starr A. 2005. Perceptual consequences of disrupted auditory nerve activity. J Neurophysiol 93(6):3050–3063. [DOI] [PubMed] [Google Scholar]
- Zeng FG, Oba S, Garde S, Sininger Y, Starr A. 1999. Temporal and speech processing deficits in auditory neuropathy. Neuroreport 10(16):3429–3435. [DOI] [PubMed] [Google Scholar]


