

Abstract
The objective of this study was to assess monetary and non-monetary factors that can influence the decision to participate in a future health survey. A questionnaire was administered to eligible, low-income participants (n = 1502) of the 2012 Los Angeles County Health and Nutrition Examination Survey (LAHANES-II). Multivariable regression analyses were performed to describe factors potentially associated with future intent to participate in similar survey designs. The results of the survey suggest that, overall, female participants had a greater interest in participating under a variety of incentive scenarios. Compared to the 25–34 age group, older participants (35–44, 45–84) reported more interest to participate if $10 cash [prepaid gift/debit card], a coupon for product/travel, or a small item [e.g., granola bar, t-shirt, pen] was offered, whereas younger participants (18–24) reported greater interest for $25 cash or a coupon for product/travel. Non-Whites, when compared to Whites/Non-Hispanics, reported greater interest to participate if any of the incentives was offered. High school graduates, when compared to those with some college education, reported greater interest to participate if $10 cash, a small item, or a lottery ticket was offered. Presence of two or more chronic conditions increased interest while concerns about participation in LAHANES-II was associated with reduced interest to participate in future health-related surveys. The results suggest that both incentives and non-monetary considerations (e.g., personal concerns about participating and individual level characteristics) can influence the decision to participate in health-related surveys and offer insights into strategies that can improve response rates for these assessments that are often used to inform community planning.
Keywords: Survey incentives, Health survey, Health assessment, Response rates
Introduction
The response rate is an important measure of validity and generalizability of any research study [1, 2]. Incentives are often used to facilitate recruitment, motivate participation, and enroll individuals who might otherwise not respond, thereby affecting the response rate in the positive direction [3]. Incentives are frequently grouped into four categories: (1) prepaid monetary reward [cash or cash via gift/debit card], (2) prepaid non-monetary rewards [coupon, food item, pen, etc.], (3) monetary reward conditional upon completion of a survey, or (4) non-monetary rewards conditional upon completion of a survey [4, 5]. Previous studies have indicated that monetary incentives are more effective than non-monetary incentives. Additionally, larger monetary incentives and prepayment (versus conditional payment) are associated with higher response rates [3, 4, 6, 7].
Incentive types and amounts may differ by study design, with monetary incentives playing a vital role in clinical trials and cohort studies [8–13]. However, the focus of the current study was on incentives for participation in cross-sectional, health-related surveys. Examples of local phone-based health surveys include the 2011 Los Angeles County Health Survey (LACHS) with a $10–20 post-completion incentive and the 2011–2012 California Health Interview Survey (CHIS) with a $2 monetary incentive. These two surveys have response rates of 28.4 and 35.1%, respectively (Table 1) [17, 21, 27]. The National Health and Nutrition Examination Survey (NHANES) provides incentives for biometric measurements. However, the amount of the incentive is based on participant’s age, the session attended, and the year of the survey (1999–2010 incentives ranged from $30–$125) [14, 28]. The 2011–2012 NHANES response rates ranged from 69.5% for biometric measurements to 72.6% for those who were interviewed only, with incentives ranging from $90 to $175 [15, 16, 29].
Table 1.
Response rates and cash incentives provided in local, state, and national surveys in the USA
| Study/survey | Type of study | Study/survey timeline | Duration of survey administration | Sample size | Response ratea | Cash Incentive | Location |
|---|---|---|---|---|---|---|---|
| Los Angeles County Health and Nutrition Examination Survey (LAHANES-II) 2012 | Rapid assessment, biometrics | 2 months | 45–60 min | 1502 | 69.0% | $50 | Los Angeles County |
| National Health and Nutrition Examination Survey (NHANES) 2011–2012 [14–16] | Rapid assessment, interview, biometrics | 1 year | 30–40 min | 9338 | 69.5% | $90–$175 | US Nationwide |
| Los Angeles County Health Survey (LACHS) [17, 18] | Random Digit Dialing (RDD) | 1 year | 30 min | 8036 | 28.4% | $10–$20 | Los Angeles County |
| Women, Infants and Children (WIC), 2011 [19] | RDD | 1 year | 20–25 min | 5080 | 54.0% | $10 | Los Angeles County |
| Los Angeles Family and Neighborhood Survey (LA FANS) [20] | Personal interview | 2 years | N/A | 3090 | 85.0% | $25–$50 | Los Angeles County |
| California Health Interview Survey (CHIS) 2011–2012 [21] | RDD | 1 year | 35 min | 42,935 | 35.1% | $2 | California |
| Los Angeles Mommy and Baby Survey 2010–2012 [22, 23] | Mailed questionnaire or interview | 2 years | 30–45 min | 10,758 | 57.0–62.0% | $20 | Los Angeles County |
| Behavioral Risk Factors Surveillance System (BRFSS) 2011 California [24] | RDD | 1 year | 20–30 min | 18,004 | 35.4% | None | California |
| Hepatitis B and Blood Pressure Screening Survey (2012–2013) [25] | Rapid assessment, biometrics | 6 months | 20–30 min | 1499 | 87.5–87.9% | None | Los Angeles County |
| A Survey Study of Beach Use and Perceptions [26] | RDD | 3 months | 10–15 min | 403 | 8.7% | None | Los Angeles County |
N/A not available (personal communication)
aResponse rates are reported from the available resources and may have been calculated using different methodologies
While cash incentives have demonstrated generally favorable effects on response rates in these aforementioned health surveys, how they perform among lower income populations or the use of non-monetary substitutes in this population remains largely under-characterized.
To address this gap in the survey literature, the present study capitalized on a supplemental questionnaire that was added to a health assessment survey administered in Los Angeles County (LAC) during 2012. The Los Angeles County Health and Nutrition Examination Survey-Phase II (LAHANES-II) was a cross-sectional survey that collected staff-measured anthropomorphic information as well as self-reported demographic and other health and nutritional information on a sample of low-income adults who were clients of five large, multi-purpose public health centers in LAC. Survey participants were given a $50 gift card for completing biometric measurements (height, weight, blood pressure, and urinalysis) and self-administered questionnaires. The overall participation rate was 69%. Data collection took place during a 2-month period. The objective of the present analysis was to investigate factors that may influence the decision to participate in health-related surveys in the future for various incentive types given as compensation.
Methods
LAHANES-II Recruitment
Participants of the LAHANES-II were recruited by trained survey coordinators at five designated Los Angeles County Department of Public Health (DPH) health centers. All clients of these multi-purpose centers who attended the tuberculosis (TB), sexually transmitted disease (STD), and immunization clinics were sequentially approached in waiting rooms of the health centers and screened for eligibility. Inclusion criteria included the following: aged 18 years or above, spoke English or Spanish, Los Angeles County resident, not currently pregnant, and able to attend a clinic for the survey on a Saturday during the data collection period. Eligible adults who agreed to participate were scheduled for an appointment on one of seven data collection Saturdays from February 25–April 14, 2012.
Survey Procedures
The LAHANES-II comprised two main survey components—(1) a self-administered survey that was completed by each participant and (2) biometric (anthropometric) measurements taken by the survey’s clinical staff. Information collected from the self-administered survey included socio-demographics, i.e., gender, age, race/ethnicity, nativity, education, and employment status; health behaviors such as smoking, eating habits, and exercise; and chronic conditions.
At the conclusion of the main survey, participants were administered an exit interview (supplemental questionnaire) to gauge their study experiences which included questions about potential survey incentives. Participants were asked about their interest to participate in a similar survey as LAHANES-II if different monetary amounts or non-monetary incentive types were offered. The incentive options included cash/prepaid gift/debit card of $10 or $25 and non-monetary incentives such as a coupon for product/travel, a lottery ticket, or a small item (e.g., granola bar, t-shirt, pen). The responses to these incentive questions were categorized on a scale from 1 (“I would definitely participate”) to 4 (“I would definitely NOT participate”). Additionally, participants were asked questions concerning their satisfaction with wait time and the general attitude of the staff they interacted with throughout the LAHANES-II. Responses for the statements associated with these topics ranged from 1 (“strongly disagree”) to 10 (“strongly agree”). Lastly, participants were asked about concerns, if any, regarding their participation or content in the LAHANES-II.
During LAHANES-II, all participants signed a consent form and were given a prepaid $50 VISA or MasterCard gift card for the time spent while completing the two components of the survey. The amount and type of incentive was determined by considering several factors including (1) the amount of effort required of the participants to travel to the health center and to participate in a low-risk health survey; (2) fair compensation for participants without it being coercive; (3) the available budget of the survey; (4) the ability to transport, track, and distribute gift cards in a secure manner by study personnel; (5) the utility of the gift card incentive for participants; and (6) a realistic goal to achieve a reasonable survey response rate. The present analysis of existing LAHANES-II data was approved by the Los Angeles County Department of Public Health Institutional Review Board on January 5, 2011 (IRB No. 2010-12-302).
Statistical Analysis
Descriptive statistics for survey participants were reported as frequencies and percentages. For comparison, applicable health data and demographic information from the population-based 2011 Los Angeles County Health Survey (LACHS) were included as part of the descriptive profile for the LAHANES-II.
Multivariable logistic regression analyses were conducted to estimate the odds of participating in a similar type of health-related survey as LAHANES-II if different incentives were offered. The main regression model with the outcome “I would definitely or likely participate” versus “I would maybe participate or definitely not participate” was selected based on prior knowledge, precision of estimates, and the Hosmer-Lemeshow Goodness-of-Fit Test [30]. Independent variables entered into all models included potential predictors, such as age, gender, educational attainment, and race/ethnicity, as well as other factors (covariates) that could impact the interest to participate, including being born in the USA, wait time in the health center, number of chronic conditions, smoking status, and concerns about survey participation/content. Age was entered into the models as a categorical variable with 10-year age categories (with an exception of the first category of 18–24 years old); however, participants aged 45 and older were collapsed into one category (45–84) because the distribution of responses for the outcome was consistent within the group. The categorization method for race/ethnicity and educational attainment was similar to those used by the LACHS and by other health surveys [17, 31, 32]. Based on groupings used in these and other survey studies, and on the distribution of the data, the number of chronic health conditions were categorized into three categories: no condition, one condition, and two or more conditions (> 2) [33].
Sensitivity analyses using the same variables were performed but with the outcomes slightly altered. For example, in model A, the outcome was classified as “I would definitely participate” versus “I would likely participate, maybe participate, or definitely not participate”. In model C, the outcome was dichotomized as “I would definitely, likely, or maybe participate” versus “definitely not participate”. These variables were simultaneously entered into the logistic regression model in all analyses. All analyses were performed using SAS 9.4 (SAS Institute, Inc., Cary, North Carolina) [34].
Results
Socio-Demographics and Health Characteristics
The main LAHANES-II survey and exit interview were distributed to all eligible participants at the public health centers (n = 1502). Table 2 displays the socio-demographics and health characteristics from the main LAHANES-II survey and comparison information from the 2011 Los Angeles County Health Survey (LACHS) [17]. Overall, there were more females (53.7%) than males (46.0%) in the sample. The mean age of the participants was slightly younger than those in the LACHS (36.0 years versus 43.5, respectively). African Americans were overrepresented in LAHANES-II (48.3%), but Hispanics (29.1%), Whites (11.6%), and Asians (5.3%) were underrepresented in comparison to the population-based LACHS sample. Over half of the participants had attended at least some college (59.1%). Many were unemployed (45.4%), followed by those with part-time (19.9%) and full-time employment (15.9%) (data not shown). Most of the LAHANES-II participants indicated they were born in the USA (71.5%).
Table 2.
Socio-demographics and health characteristics of participants of the Los Angeles County Health and Nutrition Examination Survey-Phase II (LAHANES-II), February–April, 2012 (n = 1502)
| Characteristics | LAHANES-IIa,b | Los Angeles County Health Survey (LACHS)c,d | ||
|---|---|---|---|---|
| n | % | n | % | |
| Gender | ||||
| Female | 807 | 53.7 | 3,734,000 | 51.5 |
| Male | 691 | 46.0 | 3,518,000 | 48.5 |
| Age group | ||||
| 18–24 | 332 | 22.1 | 1,003,000 | 14.1 |
| 25–34 | 460 | 30.6 | 1,449,000 | 20.4 |
| 35–44 | 317 | 21.1 | 1,394,000 | 19.6 |
| 45–84 | 393 | 26.2 | 3,273,000 | 46.0 |
| Mean (SD) | 36.0 | (12.7) | 43.5 | (16.7) |
| Race/ethnicitye | ||||
| African American/Black | 725 | 48.3 | 620,000 | 8.6 |
| Asian/Pacific Islander | 79 | 5.3 | 1,127,000 | 15.6 |
| Hispanic/Latino | 437 | 29.1 | 3,159,000 | 43.7 |
| White/Non-Hispanic | 174 | 11.6 | 2,295,000 | 31.7 |
| Native American/Alaskan | < 5 | < 1 | – | 0.4 |
| Mixed/Multiethnic | 78 | 5.2 | – | – |
| Educational attainment | ||||
| Completed less than high school | 261 | 17.4 | 1,672,000 | 23.2 |
| High school graduate or GED | 338 | 22.5 | 1,607,000 | 22.3 |
| Some college, trade school | 564 | 37.5 | 2,008,000 | 27.9 |
| College/postgraduate/professional degree | 325 | 21.6 | 1,914,000 | 26.6 |
| Born in the USA | ||||
| Yes | 1074 | 71.5 | 3,314,000 | 45.9 |
| No | 426 | 28.4 | 3,909,000 | 54.1 |
| Time spent at the health center | ||||
| 0–30 min | 238 | 15.8 | – | – |
| 31–60 min | 778 | 51.8 | – | – |
| 1–2 h | 377 | 25.1 | – | – |
| 2–3 h | 32 | 2.1 | – | – |
| 3 h or more | 5 | < 1 | – | – |
| Smoking status (self-reported)f | ||||
| Smoker | 521 | 34.7 | 1,052,000 | 14.5 |
| Non-smoker | 981 | 65.3 | 6,182,000 | 85.5 |
| Chronic health conditionsg | ||||
| Arthritis | 136 | 9.1 | 1,257,000 | 17.4 |
| Depression | 205 | 13.6 | 879,000 | 12.2 |
| Diabetes | 93 | 6.2 | 685,000 | 9.5 |
| Hypertension | 211 | 14.0 | 1,738,000 | 24.0 |
| Asthma | 204 | 13.6 | – | – |
| Hepatitis C | 30 | 2.0 | – | – |
| Hepatitis B | 26 | 1.7 | – | – |
| Cancer | 25 | 1.7 | – | – |
| Heart disease | 25 | 1.7 | – | – |
| Kidney disease | 21 | 1.4 | – | – |
| Emphysema/COPD | 18 | 1.2 | – | – |
| Number of chronic conditions | ||||
| None | 841 | 56.0 | – | – |
| One | 406 | 27.0 | – | – |
| More than one | 255 | 17.0 | – | – |
aTotals and percentages may exceed 100% due to rounding and/or the multiple-choice format
bExcludes missing values
cSource: 2011 Los Angeles County Health Survey (LACHS), Office of Health Assessment and Epidemiology, Los Angeles County Department of Public Health
dNote: Estimates are based on self-reported data from a random sample of 8036 Los Angeles County households, representative of the adult population in Los Angeles County
eClassification of race/ethnicity was slightly different for Los Angeles County Health Survey (LACHS); there was no multiethnic/mixed race category in the LACHS
fIn the Los Angeles County Health Survey (LACHS), current cigarette smokers were defined as those who reported currently smoking cigarettes “every day” or “some days” vs “Are you currently smoking’ in LAHANES-II
gChronic conditions in both LAHANES-II and LACHS included arthritis, depression, diabetes, and hypertension; other conditions documented differed between the two surveys
The majority of participants spent 31–60 min (51.8%) completing the LAHANES-II assessment, followed by 1–2 h (25.1%) and 0–30 min (15.8%). Approximately 65% of the participants indicated they were non-smokers. Forty-four percent had been informed by a healthcare provider that they have a chronic condition (27% had at least one condition, 17% had more than one). The most common chronic conditions were hypertension (14.0%), depression (13.6%), and asthma (13.6%).
Satisfaction and Concerns about LAHANES-II
Overall, participants were satisfied with their experiences during LAHANES-II (mean rating = 9.5, median rating = 10), with 91.7% of participants stating that they would participate in a future project like LAHANES-II and 93.5% that they would recommend to friends’ projects like LAHANES-II (data not shown).
Table 3 shows data from the exit interview (supplemental questionnaire). The vast majority reported being comfortable with their participation (92.0%), with a large percentage indicating they had no concerns about participating (69.6%). When participants were asked to provide specific concerns regarding participation, they most frequently stated protecting their privacy was the most important reason (16.0%), followed by how the collected information would be used (11.7%), the length of time it would take to complete the survey (9.0%), and concerns with receiving further unwanted solicitation by e-mail, telephone, or junk mail (6.5%).
Table 3.
Concerns that participants had about the Los Angeles County Health and Nutrition Examination Survey - Phase II (LAHANES-II), February – April, 2012
| Question | Number | Percenta,b |
|---|---|---|
| How comfortable were you in taking part in the various components of the project? | ||
| Very comfortable, somewhat comfortable | 1381 | 92.0 |
| Neither comfortable nor uncomfortable | 44 | 2.9 |
| Somewhat uncomfortable, very uncomfortable | 39 | 2.6 |
| How concerned were you about participating in the survey? | ||
| No concerns | 1046 | 69.6 |
| Few concerns | 266 | 17.7 |
| Some concerns | 98 | 6.5 |
| Serious concerns | 37 | 2.5 |
| What types of concerns did you have about participating in the survey? | ||
| Protecting privacy | 241 | 16.0 |
| How the information collected might be used | 176 | 11.7 |
| Length of time it would take to complete the survey | 135 | 9.0 |
| Solicitation because of participating in the survey | 97 | 6.5 |
| Other concerns about participating in the survey | 40 | 2.7 |
aTotals and percentages may exceed 100% due to rounding or the selection of multiple responses
bExcludes missing values
Participants’ Opinions Toward Monetary and Non-Monetary Incentives
During the exit interview, participants were asked to give the main reason they decided to participate in LAHANES-II. Many participants stated they wanted to contribute to public health’s mission to prevent disease and protect people’s health (36.4%); another 28.9% indicated they were motivated by the $50 incentive; the rest indicated other reasons, an interest in the survey’s subject matter, or no reasons (data not shown).
When asked how likely they were to participate in a similar study given a range of possible incentive types that could be offered, almost a half of the participants indicated they would definitely participate if offered $25 cash or prepaid gift/debit card (49.3%); approximately one third indicated they would accept a coupon for product or travel (37.3%), $10 cash or prepaid gift/debit card (36.2%), or a lottery ticket (33.4%); and about one quarter of participants would participate if offered a small item such as a granola bar, t-shirt, or pen (27.2%), or some other unspecified item (25%) (Fig. 1).
Fig. 1.
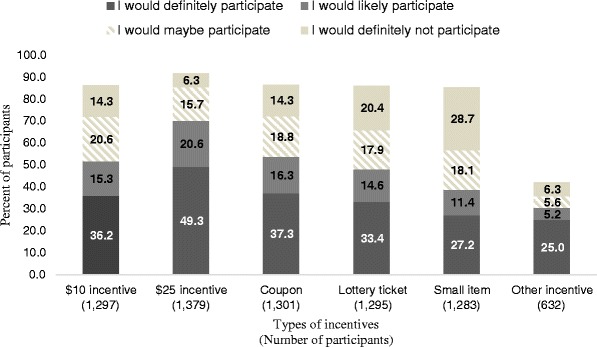
Participants’ opinions regarding the receipt of different amounts of cash and various types of non-monetary incentives, Los Angeles County Health and Nutrition Examination Survey-Phase II (LAHANES-II), February–April 2012
Factors Influencing Interest to Participate in a Similar Survey like LAHANES-II
Results of the multivariable regression models on factors associated with an interest to participate in a health-related study (similar to LAHANES-II) if different cash amounts or non-monetary incentive types are offered are presented in Table 4.
Table 4.
Factors (individual characteristics) influencing or that may have influenced interest to participate in a similar survey as LAHANES-II if offered different cash amounts or various non-monetary incentive types, Los Angeles County Health and Nutrition Examination Survey-Phase II (LAHANES-II), February–April 2012
| Factors/characteristics | $10 cash | $25 cash | Coupon for product/travel | Small Incentive (granola/shirt/pen) | Lottery ticket for prizes | |||||
|---|---|---|---|---|---|---|---|---|---|---|
| AORa | 95% CL | AORa | 95% CL | AORa | 95% CL | AORa | 95% CL | AORa | 95% CL | |
| Gender (ref: male) | ||||||||||
| Female | 1.68 | 1.32, 2.15* | 1.77 | 1.35, 2.32* | 1.56 | 1.22, 1.99* | 1.42 | 1.11, 1.81* | 1.48 | 1.16, 1.89* |
| Age group (years) (ref: 25–34 years old) | ||||||||||
| 18–24 | 1.17 | 0.84, 1.62 | 1.52 | 1.06, 2.20* | 1.53 | 1.10, 2.12* | 1.12 | 0.81, 1.55 | 1.12 | 0.81, 1.55 |
| 35–44 | 1.48 | 1.05, 2.09* | 1.39 | 0.96, 2.01 | 1.52 | 1.08, 2.14* | 1.13 | 0.81, 1.59 | 1.22 | 0.87, 1.71 |
| 45–84 | 1.61 | 1.14, 2.27* | 1.31 | 0.90, 1.89 | 1.35 | 0.96, 1.90 | 1.68 | 1.19, 2.37* | 1.15 | 0.82, 1.62 |
| Race/ethnicity (ref: White/Non-Hispanic) | ||||||||||
| African American/Black | 2.94 | 1.96, 4.39* | 1.56 | 1.03, 2.36* | 2.89 | 1.94, 4.28* | 3.20 | 2.02, 5.09* | 3.33 | 2.18, 5.09* |
| Asian/Pacific Islander | 2.50 | 1.27, 4.91* | 1.55 | 0.77, 3.11 | 1.40 | 0.72, 2.71 | 2.35 | 1.15, 4.84* | 2.77 | 1.39, 5.52* |
| Hispanic/Latino | 2.77 | 1.74, 4.42* | 1.61 | 0.99, 2.62 | 2.29 | 1.45, 3.61* | 3.28 | 1.96, 5.49* | 2.47 | 1.53, 4.01* |
| Mixed/Multiethnic | 2.75 | 1.50, 5.06* | 1.43 | 0.74, 2.79 | 2.35 | 1.28, 4.32* | 3.33 | 1.76, 6.32* | 3.14 | 1.68, 5.86* |
| USA born (ref: yes) | ||||||||||
| No | 1.20 | 0.84, 1.71 | 1.05 | 0.71, 1.53 | 1.23 | 0.86, 1.75 | 1.42 | 0.99, 2.02 | 1.15 | 0.81, 1.63 |
| Educational attainment (ref: some college or trade school) | ||||||||||
| Completed less than high school | 1.15 | 0.78, 1.69 | 0.72 | 0.48, 1.08 | 1.10 | 0.75, 1.61 | 1.26 | 0.88, 1.82 | 1.38 | 0.95, 2.01 |
| High school graduate or GED | 1.39 | 1.00, 1.94 | 1.31 | 0.90, 1.90 | 1.39 | 0.99, 1.94 | 1.46 | 1.06, 2.00* | 1.57 | 1.14, 2.16* |
| College/postgraduate/professional | 0.61 | 0.44, 0.85* | 0.65 | 0.46, 0.93* | 0.64 | 0.46, 0.88* | 0.59 | 0.42, 0.83* | 0.56 | 0.40, 0.78* |
| Chronic condition (ref: no conditions) | ||||||||||
| One condition | 0.82 | 0.61, 1.09 | 1.13 | 0.83, 1.53 | 0.99 | 0.74, 1.31 | 0.91 | 0.68, 1.21 | 0.90 | 0.68, 1.20 |
| More than one condition | 1.13 | 0.78, 1.62 | 1.74 | 1.13, 2.66* | 1.32 | 0.92, 1.91 | 1.06 | 0.74, 1.51 | 1.27 | 0.89, 1.82 |
| Self-reported smoking status (ref: non-smokers) | ||||||||||
| Smokers | 0.98 | 0.75, 1.28 | 1.11 | 0.83, 1.48 | 1.15 | 0.88, 1.50 | 1.20 | 0.92, 1.55 | 1.44 | 1.11, 1.88* |
| Type of concerns about participating in the survey (ref: no concerns) | ||||||||||
| Few concerns | 0.46 | 0.34, 0.63* | 0.52 | 0.38, 0.72* | 0.74 | 0.54, 1.00 | 0.66 | 0.48, 0.91* | 0.67 | 0.50, 0.92* |
| Some concerns | 0.38 | 0.23, 0.62* | 0.36 | 0.22, 0.59* | 0.59 | 0.36, 0.97* | 0.70 | 0.43, 1.15 | 0.56 | 0.34, 0.93* |
| Serious concerns | 0.69 | 0.29, 1.68 | 0.36 | 0.16, 0.83* | 0.57 | 0.25, 1.33 | 0.75 | 0.31, 1.80 | 0.52 | 0.22, 1.22 |
| Time spent at health center (ref: 31–60 min) | ||||||||||
| 0–30 min | 1.37 | 0.98, 1.93 | 1.36 | 0.93, 2.00 | 1.42 | 1.01, 2.01* | 1.40 | 1.00, 1.94 | 1.48 | 1.06, 2.07* |
| 1–2 h | 1.17 | 0.87, 1.58 | 0.99 | 0.72, 1.36 | 0.92 | 0.69, 1.24 | 1.04 | 0.78, 1.39 | 0.90 | 0.67, 1.21 |
| More than 2 h | 0.87 | 0.37, 2.06 | 1.54 | 0.57, 4.15 | 1.20 | 0.50, 2.88 | 1.49 | 0.65, 3.42 | 1.44 | 0.59, 3.50 |
*p < 0.05
aModeled on participation variable: “I would definitely/likely participate” versus “I would maybe participate/definitely not participate”. Adjusted Odds Ratio (AOR) values were generated by the simultaneous entry of covariates into a logistic regression model
Female participants were significantly more likely to participate—regardless of the type of incentive—with adjusted odds ratio (AOR) ranging from 1.42 (95% CI 1.11, 1.81) for small item to AOR = 1.77 (95% CI 1.35, 2.32) for a $25 cash incentive.
Compared to the 25–34 age group, participants of all age groups were more likely to agree to participate in a similar survey if offered cash incentives. Younger participants aged 18–24 years were more likely to report interest to participate given a $25 cash incentive (AOR = 1.52, 95% CI 1.06, 2.20), while older participants would agree to participate for a $10 cash incentive with AOR = 1.48, 95% CI 1.05, 2.09 for participants aged 35–44 years and AOR = 1.61, 95% CI 1.14, 2.27 for participants over 45 years old. Additionally, participants aged 18–24 and 35–44 years were more likely to report interest to participate given a coupon for product/travel (AOR = 1.53, 1.10, 2.12 and AOR = 1.52, 95% CI 1.08, 2.14, respectively), while participants over 45 years old would accept a small item (AOR = 1.68, 95% CI 1.19, 2.37) as an incentive for participation.
Other sociodemographic factors yielded variable but statistically significant results. Compared to Whites/Non-Hispanics, participants from the other racial/ethnic groups were more likely to express an interest in participation with the listed incentives, except for the $25 cash incentive, which was found to be significant only for African American/Black participants. Participants with a high school education reported greater interest in a similar survey if they were given a small item or lottery ticket as incentive (AOR = 1.46, 95% CI 1.06, 2.00 and AOR = 1.57, 95% CI 1.14, 2.16, respectively), as compared to those with some college background. Interestingly, participants with college or postgraduate degrees were less likely to participate regardless of the incentive type offered.
Participants’ health was also a strong predictor—those with more than one chronic condition were more likely than those with no conditions to report interest to participate if offered a $25 cash incentive (AOR = 1.74, 95% CI 1.13, 2.66).
Lastly, time spent participating and concerns about LAHANES-II were both predictors of future participation by incentive types. Spending the least amount of time at a health center during the main survey was associated with being more likely to participate when given a coupon for product/travel or a lottery ticket (AOR = 1.42, 95% CI 1.01, 2.01 and AOR = 1.48, 95% CI 1.06, 2.07, respectively). Not surprisingly, participants who had concerns about participating in LAHANES-II were less likely to report an interest to participate if offered any type of incentive (Table 4).
Sensitivity analyses using the same variables but different categorization of the outcomes (i.e., self-reported level of interest to participate in future studies) yielded results that were similar to those from the main analysis (Table 5). The estimates suggest associations in the same direction as the main model; these estimates, however, were less precise for some of the participation variables examined.
Table 5.
Participant likelihood of participating in a similar survey as the LAHANES-II by incentive type and categorical definitions of the participation variable, Los Angeles County Health and Nutrition Examination Survey-Phase II (LAHANES-II), February–April 2012
| Type of incentive | |||||||||||||||
|---|---|---|---|---|---|---|---|---|---|---|---|---|---|---|---|
| $10 cash | $25 cash | Coupon for product/travel | Small Incentive (granola/shirt/pen) | Lottery ticket for prizes | |||||||||||
| Modela | A | B | C | A | B | C | A | B | C | A | B | C | A | B | C |
| Gender (ref: male) | |||||||||||||||
| Female | + | + | + | + | + | + | + | + | + | + | + | + | + | ||
| Age group (ref: 25-34 years old) | |||||||||||||||
| 18–24 | + | + | + | ||||||||||||
| 35–44 | + | + | + | + | |||||||||||
| 45–84 | + | + | + | + | + | + | + | ||||||||
| Race/ethnicity (ref: White/Non-Hispanic) | |||||||||||||||
| African American/Black | + | + | + | + | + | + | + | + | + | + | + | + | + | ||
| Asian/Pacific Islander | + | + | + | + | + | + | |||||||||
| Hispanic/Latino | + | + | + | + | + | + | + | + | + | + | + | + | |||
| Mixed/Multiethnic | + | + | + | + | + | + | + | + | + | + | + | ||||
| US born (ref: yes) | |||||||||||||||
| No | + | + | |||||||||||||
| Educational attainment (ref: some college or trade school) | |||||||||||||||
| Completed less than high school | |||||||||||||||
| High school graduate or GED | + | + | + | + | + | + | + | ||||||||
| College/postgraduate/professional | − | − | − | − | − | − | − | − | − | − | − | − | − | ||
| Time spent at health center (ref: 31–60 min) | |||||||||||||||
| 0–30 min | + | + | + | + | + | ||||||||||
| 1–2 h | |||||||||||||||
| More than 2 h | |||||||||||||||
| Chronic condition (ref: no conditions) | |||||||||||||||
| One condition | |||||||||||||||
| More than one condition | + | + | |||||||||||||
| Self-reported smoking status (ref: non-smokers) | |||||||||||||||
| Smokers | + | + | |||||||||||||
| Concerns about participating in the survey (ref: no concerns) | |||||||||||||||
| Few concerns | − | – | − | − | − | − | − | − | − | − | − | ||||
| Some concerns | − | − | − | − | − | − | − | − | − | ||||||
| Serious concerns | − | − | |||||||||||||
A Model included participation variable: “I would definitely participate” versus “I would likely/maybe participate or definitely not participate,” B Model included participation variable: “I would definitely/likely participate” versus “I would maybe participate, or definitely not participate,” C Model included participation variable: “I would definitely/likely/maybe participate” versus “I would definitely not participate,” + Participants with the characteristics would be more likely to participate in a similar survey as LAHANES-II, − Participants with the characteristics would be less likely to participate in a similar survey as LAHANES-II
aVariables were simultaneously entered into a logistic regression model
Discussion
Within the USA, California generally has low response rates for health surveys as compared to other states [24]. The response rate for the LAHANES-II was relatively high by comparison, particularly if the short study duration (seven data collection days during a 2-month span) was taken into consideration. The response rate was similar to the NHANES (69.5%), on which the survey was based, and higher than most other health surveys completed within Los Angeles County or in the state of California [16, 18–27, 29]. The high response rate may have been due to the cash incentive of $50 or because it was a clinic-based study in which the participants may have had a vested interest in the subject matter.
Overall, the results from the LAHANES-II exit interview were consistent with previous studies showing that the larger the value (amount) of the monetary incentive, the higher the response rate [3, 4, 6, 7]. Although all participants were given a prepaid $50 gift card for their participation in the main survey, as many as 70% in the exit interview stated they would “definitely” or “likely” participate in a similar survey for $25; 52% indicated they would do the same for $10. This is both an encouraging and an important consideration when trying to balance the budget of any study and the goal for a high response rate. On the other hand, providing an overly generous incentive could promote undue inducement or coercion of participants and is potentially unethical from a human research subject’s perspective [35]. Both the evaluator and the Institutional Review Board carry the responsibility of determining what constitutes an appropriate incentive for a given study and ensuring that coercion does not occur.
Various factors were associated with an interest to participate when different cash amounts and/or non-monetary incentive types were offered as options. Female participants, for example, were more likely to report an interest to participate across all types of incentives. This finding is consistent with several studies which have shown higher survey response rates among females [14, 36–39]. A possible explanation for this observation may be that more females than males typically stay at home and are thus more readily available to participate. LAHANES-II data did show that more females (women) were unemployed (results not shown).
There was a positive direction for the association between older age and interest to participate, particularly if participants were offered $10 cash, a coupon for product/travel, or a small item incentive. This finding is also in line with results from other studies [37, 38]. Among younger participants, it appears that only monetary incentives played or could play an important role in their decision to participate. Interestingly, self-identification as White/Non-Hispanic and having higher educational attainment such as college or a postgraduate degree were both inversely associated with an interest to participate regardless of monetary and non-monetary incentive types. The latter findings differed from the results of a previous survey [40]; however, LAHANES-II participants, by comparison, were generally lower in educational attainment and socio-economic status and predominantly African American/Black and Hispanic/Latino.
A majority of LAHANES-II participants indicated they were comfortable and had no or few concerns about their involvement. Perhaps not surprisingly, participants who did have concerns were less likely to report that they would participate, regardless of incentive types.
Lastly, participants with > 2 chronic conditions were more likely to report an interest to participate in similar surveys that offer a $25 incentive as opposed to none. This observation may be due to participants’ vested interest in the subject matter of the health survey [41].
LAHANES-II may contain project limitations that should be mentioned. For example, a majority of the database was collected via self-report. As such, social response bias could have occurred, even unconsciously, to provide more “desirable” or socially acceptable answers to the questions (e.g., number of chronic conditions, reasons for participation, or amount of incentive necessary for participation), which could have had an impact on the outcomes of interest. The design of the survey was cross-sectional; therefore, the data could not be used to explain causality or temporality. Additionally, participants were asked about their hypothetical behavior and preferences that may not accurately reflect their intentions in the future. Finally, persons that chose to participate in the survey may have different responses than those that were eligible and refused to participate. Several socio-demographics of the sample differed from those observed in the general population of Los Angeles County. This is evident in the comparisons to the population-based LACHS (Table 2). However, the demographics of the LAHANES-II sample were largely similar to other clinic-based surveys completed at these health center (data collection) sites. It should be noted that these listed limitations are not unique to this survey and are present in many other self-reported, cross-sectional surveys.
The results of the present study are not intended to suggest a variable incentive structure for different participants due to ethical considerations. Rather, this study aimed to explore what types or amounts of incentive are acceptable to potential participants and what could be used to recruit and enroll participants more efficiently and effectively. Lastly, while incentives are a crucial component in the implementation of health-related surveys, there are other factors that may assist in increasing response rates including letters, phone calls, advertisement, or the use of social media. Use of these methods, and particularly, the use of social media, could be a subject for future research.
Conclusions
This study highlights that both monetary incentives and non-monetary considerations are important factors in the recruitment of participants in health-related, cross-sectional surveys. Although self-reported, many of these factors are vital in achieving a high response rate and should be considered when designing and planning health surveys for low-income, underserved communities across the United States.
Acknowledgements
The authors thank Elizabeth Rubin, Ashley Stegall, Ekaterina Gee, Delia Bedair, Jerome Blake, Heena Hameed, Brenda Robles, Susie Tang, Frank Sorvillo, Deborah Davenport, Angel Aquino, Rachel Lee, Elaine Massengill, Violet Williams, David Caley, the CHS Administration and the Area Health Officers for their assistance in facilitating the LAHANES-II data collection. The authors also thank Leila Family for reviewing the manuscript prior to submission. This study utilized information from a project that was previously supported in part by a Centers for Disease Control and Prevention initiative (3U58DP002485-01S1). No funding was received for this analysis.
References
- 1.Barclay S, Todd C, Finlay I, Grande G, Wyatt P. Not another questionnaire! Maximizing the response rate, predicting non-response and assessing non-response bias in postal questionnaire studies of GPs. Fam Pract. 2002;19(1):105–111. doi: 10.1093/fampra/19.1.105. [DOI] [PubMed] [Google Scholar]
- 2.Cummings SM, Savitz LA, Konrad TR. Reported response rates to mailed physician questionnaires. Health Serv Res. 2001;35(6):1347–1355. [PMC free article] [PubMed] [Google Scholar]
- 3.Kamb ML, Rhodes F, Hoxworth T, Rogers J, Lentz A, Kent C, MacGowen R, Peterman TA. What about money? Effect of small monetary incentives on enrollment, retention, and motivation to change behaviour in an HIV/STD prevention counselling intervention. The project RESPECT study group. Sex Transm Infect. 1998;74(4):253–255. doi: 10.1136/sti.74.4.253. [DOI] [PMC free article] [PubMed] [Google Scholar]
- 4.Church A. Estimating the effect of incentives on mail survey response rates: a meta-analysis. Public Opin Q. 1993;57(1):62–79. doi: 10.1086/269355. [DOI] [Google Scholar]
- 5.Kalantar JS, Talley NJ. The effects of lottery incentive and length of questionnaire on health survey response rates: a randomized study. J Clin Epidemiol. 1999;52(11):1117–1122. doi: 10.1016/S0895-4356(99)00051-7. [DOI] [PubMed] [Google Scholar]
- 6.Shaw MJ, Beebe TJ, Jensen HL, Adlis SA. The use of monetary incentives in a community survey: impact on response rates, data quality, and cost. Health Serv Res. 2001;35(6):1339–1346. [PMC free article] [PubMed] [Google Scholar]
- 7.Singer E, Ye C. The use and effects of incentives in surveys. Ann Am Acad Polit Soc Sci. 2013;645(1):112–141. doi: 10.1177/0002716212458082. [DOI] [Google Scholar]
- 8.Asch DA, Troxel AB, Stewart WF, Sequist TD, Jones JB, Hirsch AMG, Hoffer K, Zhu J, Wang W, Hodlofski A, Frasch AB, Weiner MG, Finnerty DD, Rosenthal MB, Gangemi K, Volpp KG. Effect of financial incentives to physicians, patients, or both on lipid levels. JAMA. 2015;314(18):1926–1935. doi: 10.1001/jama.2015.14850. [DOI] [PMC free article] [PubMed] [Google Scholar]
- 9.Bernstein SL, Feldman J. Incentives to participate in clinical trials: practical and ethical considerations. Am J Emerg Med. 2015;33(9):1197–1200. doi: 10.1016/j.ajem.2015.05.020. [DOI] [PMC free article] [PubMed] [Google Scholar]
- 10.Chen K, Lei H, Li G, Huang W, Mu L. Cash incentives improve participation rate in a face-to-face survey: an intervention study. J Clin Epidemiol. 2015;68(2):228–233. doi: 10.1016/j.jclinepi.2014.08.002. [DOI] [PubMed] [Google Scholar]
- 11.Friedman DB, Foster C, Bergeron C, Tanner A, Kim SH. A Qualitative study of recruitment barriers, motivators, and community-based strategies for increasing clinical trials participation among rural and urban populations. Am J Health Promot. 2015;29(5):332–338. doi: 10.4278/ajhp.130514-QUAL-247. [DOI] [PubMed] [Google Scholar]
- 12.Nguyen TT, Jayadeva V, Cizza G, Brown RJ, Nandagopal R, Rodriguez LM, Rother KI. Challenging recruitment of youth with type 2 diabetes into clinical trials. J Adolesc Health : Off Publ Soc Adolesc Med. 2014;54(3):247–254. doi: 10.1016/j.jadohealth.2013.08.017. [DOI] [PMC free article] [PubMed] [Google Scholar]
- 13.Siedner MJ, Santorino D, Lankowski AJ, Kanyesigye M, Bwana MB, Haberer JE, Bangsberg DR. A combination SMS and transportation reimbursement intervention to improve HIV care following abnormal CD4 test results in rural Uganda: a prospective observational cohort study. BMC Med. 2015;13:160. doi: 10.1186/s12916-015-0397-1. [DOI] [PMC free article] [PubMed] [Google Scholar]
- 14.CDC/National Center for Health Statistics. National Health and Nutrition Examination Survey. http://www.cdc.gov/nchs/nhanes/participant.htm#benefits. Accessed Nov 2015.
- 15.CDC/National Center for Health Statistics. NHANES Response Rates and Population Totals. [Web]. http://www.cdc.gov/nchs/nhanes/response_rates_cps.htm. Accessed 2 Nov 2015.
- 16.CDC/National Center for Health Statistics. 2011–2012 NHANES Response Rates. [Web]. http://www.cdc.gov/nchs/data/nhanes/response_rates_cps/rrt1112.pdf. Accessed 4 Apr 2016.
- 17.Office of Health Assessment and Epidemiology. 2011 Los Angeles County Health Survey Background Summary & Methodology. Los Angeles, CA: Los Angeles County Department of Public Health 2013.
- 18.Los Angeles County Department of Public Health . Key indicators of health by service planning area. Los Angeles, CA: Los Angeles County Department of Public Health; 2011. p. 2013. [Google Scholar]
- 19.Langellier BA, Chaparro MP, Wang MC, Koleilat M, Whaley SE. The new food package and breastfeeding outcomes among women, infants, and children participants in Los Angeles County. Am J Public Health. 2014;104(Suppl 1):S112–S118. doi: 10.2105/AJPH.2013.301330. [DOI] [PMC free article] [PubMed] [Google Scholar]
- 20.Sastry N, Ghosh-Dastidar B, Adams J, Pebley AR. The design of a multilevel survey of children, families and communities: the Los Angeles family and neighborhood survey. Soc Sci Res. 2006;35(4):24. doi: 10.1016/j.ssresearch.2005.08.002. [DOI] [Google Scholar]
- 21.California Health Interview Survey . CHIS 2011–2012 methodology series: report 4—response rates. Los Angeles, CA: UCLA Center for Health Policy Research; 2014. [Google Scholar]
- 22.Bhatia N, Chao SM, Higgins C, Patel S, Crespi CM. Association of mothers’ perception of neighborhood quality and maternal resilience with risk of preterm birth. Int J Environ Res Public Health. 2015;12(8):9427–9443. doi: 10.3390/ijerph120809427. [DOI] [PMC free article] [PubMed] [Google Scholar]
- 23.Maternal Child and Adolescent Health Programs. Los Angeles Mommy and Baby (LAMB) Project, First 5 LA 14 Best Start Community Report, 2010 and 2012. Los Angeles County Department of Public Health, 2014.
- 24.CDC/Behavioral Risk Factor Surveillance System. BRFSS Combined Landline and Cell Phone Weighted Response Rates by State, 2011. Annual Survey Data 2011; http://www.cdc.gov/brfss/annual_data/2011/response_rates_11.htm. Accessed Apr 2016.
- 25.Barragan NC, Chang M, Felderman J, Readhead H, Kuo T. A case study of a hepatitis B screening and blood pressure assesment program in Los Angeles County, 2012-2013. Prev Chronic Dis. 2015;12:E19. doi: 10.5888/pcd12.140373. [DOI] [PMC free article] [PubMed] [Google Scholar]
- 26.Pendleton L, Martin N, Webster DG. Public perceptions of environmental quality: a survey study of beach use and perceptions in Los Angeles County. Mar Pollut Bull. 2001;42(11):1155–1160. doi: 10.1016/S0025-326X(01)00131-X. [DOI] [PubMed] [Google Scholar]
- 27.Los Angeles County Department of Public Health/Abt SRBI. 2011 Los Angeles County health survey methodology report. Los Angeles County Department of Public Health; June 2011 2011.
- 28.Zipf G, Chiappa, M, Porter, KS, et al. National Health and Nutrition Examination Survey: Plan and operations, 1999–2010. National Center for Health Statistics. Vital Health Stat. 2013;1(56):1–37 [PubMed]
- 29.CDC/National Center for Health Statistics. 2009–2010 NHANES Response Rates. Los Angeles, CA: Los Angeles County Department of Public Health. [Web]. http://www.cdc.gov/nchs/data/nhanes/response_rates_cps/RRT0910.pdf. Accessed 2 Nov 2015.
- 30.Hosmer D, Jr, Lemeshow S. Applied logistic regression. New York: Wiley; 2000. [Google Scholar]
- 31.Baumeister L, Marchi K, Pearl M, Williams R, Braveman P. The validity of information on “race” and “Hispanic ethnicity” in California birth certificate data. Health Serv Res. 2000;35(4):869–883. [PMC free article] [PubMed] [Google Scholar]
- 32.Reyes BCJ. A portrait of race and ethnicity in California: an assessment of social and economic well-being. San Francisco, CA: Public Policy Institute of California; 2001. [Google Scholar]
- 33.Boing AFMG, Boing AC, Perez KG, Perez MA. Association between depression and chronic diseases: results from a population-based study. Rev Saude Publica. 2012;46(4):617–623. doi: 10.1590/S0034-89102012005000044. [DOI] [PubMed] [Google Scholar]
- 34.SAS statistical software. [computer program]. Cary, North Carolina 2006.
- 35.Penslar R. Incentives for participation. In: Porter J, ed. Institutional Review Board Guidebook: Office for Human Research Protection from Research Risks. Pittsburgh, PA: University of Pittsburgh; 1993.
- 36.Cull WL, O'Connor KG, Sharp S, Tang SF. Response rates and response bias for 50 surveys of pediatricians. Health Serv Res. 2005;40(1):213–226. doi: 10.1111/j.1475-6773.2005.00350.x. [DOI] [PMC free article] [PubMed] [Google Scholar]
- 37.Glass DC, Kelsall HL, Slegers C, Forbes AB, Loff B, Zion D, Fritschi L. A telephone survey of factors affecting willingness to participate in health research surveys. BMC Public Health. 2015;15(1):1017. doi: 10.1186/s12889-015-2350-9. [DOI] [PMC free article] [PubMed] [Google Scholar]
- 38.Mindell JS, Giampaoli S, Goesswald A, et al. Sample selection, recruitment and participation rates in health examination surveys in Europe—experience from seven national surveys. BMC Med Res Methodol. 2015;15:78. doi: 10.1186/s12874-015-0072-4. [DOI] [PMC free article] [PubMed] [Google Scholar]
- 39.Sogaard AJ, Selmer R, Bjertness E, Thelle D. The Oslo health study: the impact of self-selection in a large, population-based survey. Int J Equity Health. 2004;3(1):3. doi: 10.1186/1475-9276-3-3. [DOI] [PMC free article] [PubMed] [Google Scholar]
- 40.Beebe TJ, Davern ME, McAlpine DD, Call KT, Rockwood TH. Increasing response rates in a survey of Medicaid enrollees: the effect of a prepaid monetary incentive and mixed modes (mail and telephone) Med Care. 2005;43(4):411–414. doi: 10.1097/01.mlr.0000156858.81146.0e. [DOI] [PubMed] [Google Scholar]
- 41.Mindell J, Aresu M, Becares L, Tolonen H. Representativeness of participants in a cross-sectional health survey by time of day and day of week of data collection. Eur J Pub Health. 2012;22(3):364–369. doi: 10.1093/eurpub/ckr093. [DOI] [PubMed] [Google Scholar]