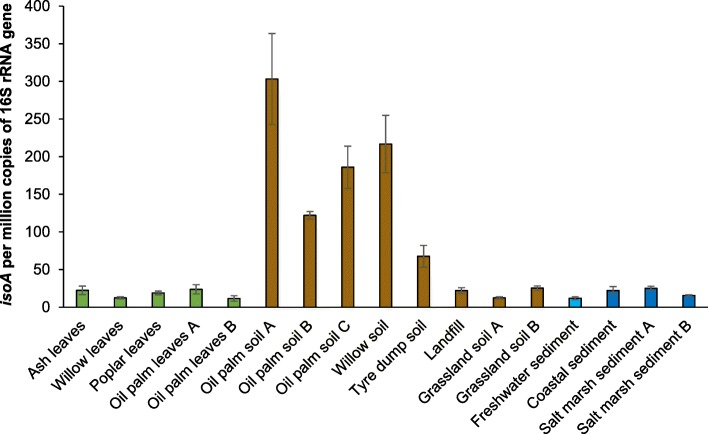
Fig. 4.
Relative abundance of isoprene degraders in natural (non-enriched) environmental samples estimated by qPCR. isoA copies are normalised to the 16S rRNA gene copy number in each sample. Results shown are the average of triplicate samples. Error bars represent standard deviations. Leaf samples are represented in green, soils in brown, freshwater environments in light blue and marine sediments in dark blue

