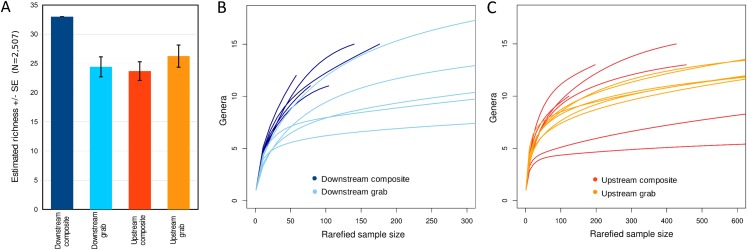
Figure 5. Expected eukaryotic richness by site and sampling method with rarefaction, considering all loci together.
(A) Expected total richness with standard errors, calculated at the genus level for 15 downstream or 18 upstream sample units per sampling method. Expected total richness reflects rarefaction to the smallest total eukaryotic sequence counts of the four samplers, which was N = 2,507 from the downstream composite sampler. The standard error for this sampler is therefore zero by definition. Sample sizes are the same for each method at a site but not between sites, as there is no expectation that richness should be the same between sites. (B) Taxon accumulation curves for downstream time-matched samples. Curves represent expected richness under different levels of rarefaction, incremented in steps of 10 sequence counts. (C) Taxon accumulation curves for upstream time-matched samples.

