

Abstract
Wireless capsule endoscopy represents a color imaging technology in the field of medical endoscopy that is extensively used to detect lesions of the human digestive tract. It is the golden standard in evaluating small bowel lesions, offering a set of digital snapshots difficult to get using other investigation methods. Its major drawbacks are the time consumed for image analysis and the burden for the physicians that must spot and classify lesions within more than 55000 images. This paper carries out a study on the detection of telangiectasia in the small bowel, based on an adapted color slicing technique applied not only on unique frames, but on series of successive frames, performing a global analysis suitable on partial sequences or entire wireless capsule endoscopy movies. We have quantified the extracted features and determined a weighting algorithm to find telangiectasia lesions. For frames containing potential lesions, we have determined features not only for the global image, but also for the normal mucosa surrounding the lesion extracted from the image. This approach allows the physician to see variations of parameters within a frame or a sequence that contains lesions. Experimental results prove that the algorithm is effective in detecting telangiectasia patterns of different images, with an accuracy of 93.88%, reducing thus the time spent for the analysis of the images acquired by wireless capsule endoscopy.
Keywords: Wireless Capsule Endoscopy, telangiectasia detection, color slicing technique, medical image analysis
Introduction
The past decade represented a step forward in small bowel examination, due to a miniature wireless camera-equipped device that made possible the investigation of the entire digestive tract, including some of its segments that were most difficult to explore. Wireless Capsule Endoscopy (WCE) investigation technique allows physicians to see the entire small bowel in a non-invasive way, being safe, painless and with minimum discomfort for the patient [1]. WCE represents an ideal symbiosis between medicine, technology and software development, all in a permanent evolution during the past years.
The main part of the WCE set consists of an „ingestible” capsule weighting less than 4 grams. The set is completed by a series of sensors that are directly attached to the patient’s abdomen or chest, a dedicated belt designed to hold a lightweight digital recorder that attenuates radio signal loss [2], a work station equipped with a software application whose purpose is to acquire and record all frames captured by the capsule’s onboard imaging sensors [3]. The capsule also has an optical system, a LED light source with advanced light controls and adjustments (for newer models), control chips, antennas and a battery pack. Recent WCE systems offer view angles up to 156o, 1:8 magnification and 1-30mm depth of view. With an acquisition rate of 2-14 frames per second (according to its model and producer), the capsule acquires and transmits around 55.000 frames during its batteries’ lifetime of 7-8 hours [4].
The procedure begins with the capsule’s activation; immediately afterwards, it starts transmitting acquired images. The patient swallows it with a glass of water-the capsule is similar to a large pill, with a diameter around 11mm and a length that varies from 26 to 27.9mm. It has no propulsion mechanism of its own, thus it is propelled only by the peristaltic movements of the digestive segments. During its travel through the digestive tract, it continuously captures and transmits images along the way. Within a period of 1-7 days from ingestion, the patient eliminates it naturally. The overall WCE examination procedure is concluded by the analysis of the acquired frames, in search of potential lesions and abnormalities. This analysis is conducted by experienced physicians.
The primary indication for WCE investigation is occult or overt gastrointestinal bleeding. It is also recommended for the diagnosis of a series of other conditions, like Crohn’s disease, benign and malign tumors of the small bowel, celiac disease [5]. Among the most frequent lesions identified using images provided by WCE are aphtae, intestinal mucosa erosions, ulcers, fistulae, polyps, telangiectasia [6].
One of the main disadvantages in the WCE examination is the time spent for the analysis of more than 55.000 frames acquired by the capsule. A trained physician must view all images, identify lesions, annotate specific frames, define a diagnosis and generate a final report. Thus, the examination time and the proper interpretation of the images may take several hours.
Another challenge in image analysis is given by the fact that a lesion may be either too small to be spotted with the naked eye, or incompletely captured. In case it is present in only a very small number of frames, it might be overseen by the examiner.
All these problems motivate software engineers to develop applications capable of automatic image analysis and support in possible lesions detection and classification. An intelligent system able to analyze the entire set of images, to identify abnormal frames and to classify potential lesions, is needed to support the physician with his investigation of the digestive tract. Many authors have tried to figure solutions for automatic segmentation of frames’ content, followed by lesion classification. Color histograms, chrominance moments, color invariants, morphological operators, spatial pyramids, neural network or support vector classifiers are just a few examples of approaches tried so far [7,8,9,10,11]. The variability of images and lesions is however too large to be covered by a single method.
Material and Method
This paper proposes a quantitative analysis of WCE videos, expressed as charts displaying various parameters and features extracted from individual frames. Based on these parameters, a weighting algorithm is exemplified in order to perform a preliminary classification of frames presenting telangiectasia (vascular lesions characterized by a permanent dilation of small blood vessels located near the surface of the mucous intestinal membrane, generating focal red lesions). This approach brings the advantage of taking into account “normal” parameters corresponding to “normal” lesion-free frames.
We have previously performed a study on 54 consecutive patients who were investigated using Olympus EndoCapsules EC [12]. This study, conducted in conformity with the Declaration of Helsinki, took place within the Research Center of Gastroenterology and Hepatology, University of Medicine and Pharmacy of Craiova, where a team of physicians defined the diagnostic for all patients, based on clinical and imagistic data, after having the approval of the Ethics Committee of the University of Medicine and Pharmacy of Craiova. Thus, we obtained 13 video files containing telangiectasia lesions. We have tested our new proposed solution on more than 3.000 frames, grouped in sequences, extracted from all video files, with or without lesions, in order to demonstrate the applied processing techniques.
Overall algorithm
Fig. 1 emphasizes the phases of our proposed analysis. The original input frames extracted from WCE files are individually processed in order to remove noise resulted from the acquisition and transmission processes. Each frame is subsequently analyzed in order to extract features needed for lesion detection.
Figure 1.

Overall flowchart
We have computed color, saturation and hue for all original images, for potential lesions extracted from the original frames following a segmentation process, and for normal intestinal mucosa surrounding potential lesions within the same frame. The next step performed a quantification of all extracted features for the subsequent numerical analysis and the preliminary classification phase.
Noise reduction
Noise present in digital images may result either from the image acquisition process (due to physical sensing elements), or during transmission. A series of factors like environmental conditions or the quality of sensing elements may directly influence the efficiency of image sensors [13]. Due to the environment specific to the digestive tract and also technical miniaturization restrictions of the physical equipment, WCE images are usually corrupted and degraded by noise and blurs [14].
Current versions of WCE use either Complementary Metal Oxide Semiconductor (CMOS) sensors or Charge Coupled Device (CCD) sensors for image acquisition. Both technologies have advantages and drawbacks when it comes to power consumption and acquisition quality. CCD technology is characterized by a high signal to noise ratio (i.e. a high level of signal and low level of noise), despite the fact that, for CCD, the amount of noise present in the acquired image is very sensitive to light levels and sensor temperature [1]. On the other hand, CMOS capsules have a better power management due to dedicated ASIC imager chips, with dynamic light and exposure adjustments but, in order to acquire good quality images, a more uniform illumination is required in regard to CCD [2].
Transmission means contribute to the amount of noise in an image mainly due to the different interferences present in used channels. Transmission using a wireless network tends to increase the noise, which is the case of the WCE acquired images [13].
A pre-processing stage meant to provide neat images by reducing the noise is therefore optimal before specific image processing techniques are applied.
Features identification, extraction and analysis
When it comes to telangiectasia detection, the main criterion used by physicians in making a diagnostic decision is the color appearance. These lesions do not present active bleeding, so they are not characterized by bright red colors, but more likely fall into a range of dark red to brown shades (Fig. 2).
Figure 2.
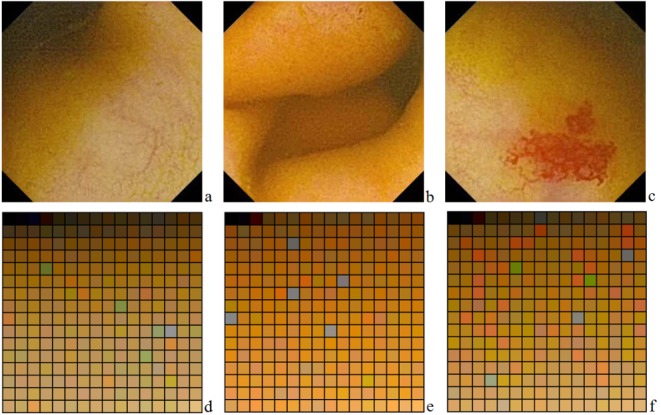
a,b,c-Three images acquired by WCE, presenting normal intestinal mucosa, normal intestinal folds and a telangiectasia lesion; d,e,f-Three color palettes, corresponding to previous WCE images
From a digital point of view, this information is expressed through standard spaces (or models) that define a coordinate system and an associated subspace within this system, where every color is identified by a single point [13]. Thus, each color is numerically expressed by the values of the coordinates in that specific system. In relation to the most common color space-RGB (red, green, blue)-telangiectasia lesions are characterized by a dominant red color, therefore R has a high value (and thus reflects more light), compared to G and B. On the other hand, the surrounding normal intestinal mucosa has a low value of R [11,15].
However, from a human point of view, color is not interpreted as the sum of the tristimulus values (R, G, B) composing it, but is rather described using its brightness and chromaticity (hue and saturation) [11,16]. Hue is a color attribute describing the pure color (yellow, orange or red), whereas saturation defines the degree to which a pure color is diluted by white light. Bleeding regions are characterized by high saturation and low brightness values, whereas normal tissue regions present low values for saturation and high values for brightness. Thus, saturation is another important feature that differentiates potential telangiectasia lesions [17].
We have performed the separation of potential telangiectasia lesions from the surrounding tissue by highlighting the predefined range of colors, using the color slicing technique. This technique divides the color space in two non-overlapping sections, according to a set of specific criteria [13]. The range of neighboring red shades that must be detected in an image represents a section from the color space that must be separated from the rest. For the ease of computation, we will consider this range as a sphere of interest within the color space, based on the Euclidian Distance (ED), as it is not very sensitive to variations in hue and saturation, but more to variations in intensity [18]. The radius of this sphere was determined individually, for each sequence, based on the color analysis of all frames included. This radius reflects the difference between the average red values for all pixels in the sequence and the pure red color.
The quantification phase determines the numerical expression of all extracted features. Specific red shade colors of potential telangiectasia lesions are extracted from the color palette. All frames are modified so that every pixel with a color outside this range is replaced by a black pixel. Then we count all non-black pixels, thus we determine the number of pixels that fall into the determined red shades range. The quantification of the bleeding lesions is actually the expression of pixels whose color is a shade of red, located in a specific range.
The red shades range is used also to segment the original image into two complementary sub-images: one contains only the potential lesion (only bits included in the sphere of interest), and the other contains the rest of the original image. This segmentation is also used for the computation of saturation and hue parameters, expressed as mean values for both the entire image and the extracted sections.
The analysis and classification process was made based on a weighting algorithm. The weights and thresholds were determined experimentally. The main criterion of telangiectasia detection is a significant number of bits inside the sphere of interest, greater than a predefined threshold, which is determined according to the color palette of the entire sequence.
Results
After the analysis of half of the sequences with telangiectasia lesions, we have concluded that the threshold must be determined from the count of red pixels and the total number of neighboring frames indicating the same potential lesion. An experimental value of 84.6% from the radius was used in the classification algorithm.
The variation of the saturation parameter corresponds to the variation reported in literature (higher values of the parameter for frames containing potential telangiectasia lesions). The general behavior of the hue parameter seems to be inverted unto the previous parameter. Lower values are determined for frames containing potential telangiectasia lesions. The weight of these parameters was computed based on the current value extracted from a frame, combined with the average difference between values corresponding to 10 successive neighboring frames. Experimental values were used in the classification algorithm: 2.2875 for saturation and 1.1824 for hue.
Based on these weights, the remaining sequences were analyzed using the classification algorithm and achieved an accuracy of 93.88%, defined as the number of correct classifications of the frames containing telangiectasia lesions, divided by the number of frames actually containing lesions. The algorithm has a sensitivity of 97.18% and a specificity of 99.71%.
Discussion
Automatic detection of telangiectasia lesions in WCE videos must be guided by a series of aspects. Telangiectasia lesions are defined by reddish colors, different from the color palette normally present in a lesion free WCE snapshot. Color may also be potentially altered by intestinal fluids or food dregs. The illuminating light source varies in intensity, and this may also affect the efficiency of lesion detection, as the tissue closer to the light source is brighter; thus a descriptor robust to light variation is needed. Two more major factors involved in a correct automatic identification are: texture of telangiectasia lesions and location of the wireless capsule, as the normal aspect of the mucosa in several segments (esophagus, stomach, small intestine, and colon) may differ and may influence the final result [7].
That is why we have determined the range of red shade colors corresponding to a potential telangiectasia lesion based on the color palette of the mucosa, modelling it as a sphere. However, the separation of telangiectasia lesions is not exact, thus pixels belonging to the normal mucosa, but with more reddish colors, may be considered as pixels belonging to lesions. This drawback may be addressed by modelling the area of interest through various geometric elements, not only spheres, thus leading to the extension of the area and to an enhanced flexibility needed to apply the algorithm to various patients presenting this type of lesions.
Prior to feature extraction, we have determined the dominant colors of the frames, based on different segments of the digestive tract, and we have computed the differences related to a pure red color. As a conclusion, dominant yellow shades determine a larger red shades range, meaning also a higher rate of success for telangiectasia lesion detection. Due to these arguments, we believe it is a good approach to perform a global analysis of the entire video file prior to lesion identification, in order to take correctly into account the color particularities of each film.
Also, the global analysis and the computation of individual parameters for lesions and non-lesions areas present a visual advantage for the examining physician. Fig. 3 shows a chart only for a sub-set of frames; for all parameters, except the red pixels count, the scales were adjusted in order to have similar value ranges for all parameters and to allow a proper graphical comparison.
Figure 3.

Chart identifying a set of frames with a high content of red pixels (telangiectasia lesion present), and the quantified features extracted from the same frames
Global charts comprising all numerical parameters computed for all frames seem to be a good indicator for the examining physicians, allowing them to focus their attention upon specific sequences from the entire films.
Conclusion
The quantification of features and the global analysis of sets of frames instead of individual frames turned out to be optimum, especially due to taking into account the normal lesion-free frames in the neighborhood of one or more frames containing a lesion.
Individuality and uniqueness of the patient’s characteristics are also taken into account by adjusting the red shades range according to the color palette of the entire sequence. The color slicing technique allows a proper definition of a sphere of interest that regroups multiple shades of red-normally encountered in telangiectasia lesions.
Overall, the proposed algorithm reduces the number of images that are analyzed by the physician, allowing him to concentrate on potential lesion frames and to determine the diagnosis. Future work and improvements concern the use of several different spheres of interest, based on other potential lesions and the extraction of new features related to the texture characteristics, in order to improve the accuracy of the classification algorithm.
Acknowledgements
Mihaela Ionescu and C.T. STreba contributed equally to this paper.
This work was supported from one research grant funded by the National Research Council (CNCS), Romania, entitled “Intelligent Imagistic Diagnosis Support Infrastructure (INDISIO)”, contract number 209/2014. The funders had no role in study design, data collection and analysis, decision to publish, or preparation of the manuscript.
Acknowledgments
All authors had equal contribution
References
- 1.Jang B, Graham DY, Lee S, Kim K. Capsule Endoscopy: Strategies and Pitfalls of Interpretation. In: Jang B, Graham DY, Lee S, Kim K, editors. Rijeka, Croatia: nTech; 2011. pp. 1–84. [Google Scholar]
- 2.Vere CC, Streba CT, Rogoveanu I, Ionescu AG. Videocapsule Endoscopy of the Small Bowel. In: Vere CC, Streba CT, Rogoveanu I, Ionescu AG, editors. Rijeka, Croatia: nTech; 2011. pp. 25–148. [Google Scholar]
- 3.Rondonotti E, Capsule endoscopy-The revolution of small bowel endoscopy. Vrije Universiteit. 2008. 2008 [Google Scholar]
- 4.Hadithi M, Heine GD, Jacobs MA, van Bodegraven AA, Mulder CJ. A prospective study comparing video capsule endoscopy with double-balloon enteroscopy in patients with obscure gastrointestinal bleeding. Gastroenterology. 2006;131(1):327–329. doi: 10.1111/j.1572-0241.2005.00346.x. [DOI] [PubMed] [Google Scholar]
- 5.Vere CC, Sima F, Tapu F, Ciurea T. Videocapsula endoscopica si enteroscopia cu balon, metode moderne de explorare a intestinului subtire. Craiova Medicala. 2008;10(1):57–63. [Google Scholar]
- 6.Tersigni R, Prantera C. Crohn's Disease: A Multidisciplinary Approach. Italia: Springer-Verlag; 2010. [Google Scholar]
- 7.Mackiewicz M, Fisher M Jamieson C. Bleeding detection in wireless capsule endoscopy using adaptive color histogram model and support vector classification. Medical Imaging Image Processing, Proceedings of SPIE. 2008:69140R–69140R. [Google Scholar]
- 8.Li B, Meng M QH. Computer-Aided Detection of Bleeding Regions for Capsule Endoscopy Images. IEEE Transactions on Biomedical Engineering. 2009;56(4) doi: 10.1109/TBME.2008.2010526. [DOI] [PubMed] [Google Scholar]
- 9.Lv G, Yan G, Wang Z. 33rd Annual International Conference of the IEEE EMBS. 2011. Bleeding detection in wireless capsule endoscopy images based on color invariants and spatial pyramids using support vector machines . [DOI] [PubMed] [Google Scholar]
- 10.Shah SK, Rajauria PP, Lee J, Celebi ME. URI- NE ASEE Conference. 2007. Classification of Bleeding Images in Wireless Capsule Endoscopy using HIS Color Domain and Region Segmentation . [Google Scholar]
- 11.Lee YG, Yoon G. Bleeding detection algorithm for capsule endoscopy . World Academy of Science Engineering and Technology. 2011:81–81. [Google Scholar]
- 12.Constantinescu AF, Ionescu M, Iovanescu VF, Ciurea ME, Ionescu AG, Streba CT, Bunescu MG, Rogoveanu I, Vere CC. A computer-aided diagnostic system for intestinal polyps identified by wireless capsule endoscopy. Rom J Morphol Embryol; 2016;57(3):979–984. [PubMed] [Google Scholar]
- 13.Gonzalez RC, Woods RE. Digital image processing. 3. Pearson Education International; 2012. [Google Scholar]
- 14.Liu H, Lu WS, Meng M Q-H. Communications, Computers and Signal Processing (PacRim) IEEE Pacific Rim Conference. 20111. De-blurring wireless capsule endoscopy images by total variation minimization. [Google Scholar]
- 15.Lau PY, Correia PL. 6th Conf. on Telecommunications Peniche. 2007. Analyzing gastrointestinal tissue images using multiple features; pp. 435–438. [Google Scholar]
- 16.Hanbury A. The taming of the Hue, Saturation and Brightness Color Space. Proceedings of the 7th CVWW. 2002:234–243. [Google Scholar]
- 17.Pan G, Yan G, Qui X, Cui J. Bleeding detection in wireless capsule endoscopy based on probabilistic neural network. Journal of Medical Systems; 2010;35(6):1477–1484. doi: 10.1007/s10916-009-9424-0. [DOI] [PubMed] [Google Scholar]
- 18.Wesolkowski S, Jernigan E. Color edge detection in RGB using jointly Euclidean Distance and vector angle. Vision Interface; Canada: 1999. [Google Scholar]