

Abstract
Based on extended theory of Derjaguin, Landau and Overbeeck (xDLVO) concerning aggregation of colloids and biological cells it was hypothesized that platelet antiaggregant agents have to reduce the aggregation of erythrocytes also. Applying Einstein-Stokes theory of sedimentation of spheres in viscous media it was concluded that sedimentation of erythrocytes is in fact sedimentation of aggregates of the approximately same size. Consequently, an expected outcome was that addition of antiaggregants in vitro to blood samples from patients with rheumatic or cardiovascular diseases will be the decrease of erythrocytes sedimentation. Starting from usual practice of dual antiaggregant therapy (aspirin and clopidogrel) effects of clopidogrel were compared with effects of clopidogrel plus small concentrations of aspirine and dipyridamole (smaller that their concentrations in plasma after in vivo administration) in order to put in evidence a possible synergic effect at platelet membrane level. Whole blood (0.8ml) was collected on 0.1ml 1% EDTA and then was added 25 or 50µl normal saline solution of clopidogrel or of the combination acetylosalycilic acid, clopidogrel and dypyridamole. The final concentrations were 1, 2 and µg/ml, of the same order as cumulated concentration of clopidogrel and its metabolites in clinical pharmacokinetics. Experiments were performed on a number of 40 human blood samples obtained from 2 groups of 20 patients. Sedimentation of erythrocytes was recorded using a camera and captured data were stored on a computer. Global analysis evidenced that in presence of antiaggregants the clusters of the sedimentation curves shifted down and into right, indicating a decrease and delay of sedimentation. Initial slopes and extent of sedimentation decreased linearly on clopidogrel concentration within the 1-3µg/ml range. For comparison of mean curves corresponding to different clopidogrel concentrations it was applied a metric from biopharmacy: areas under plasma concentrations curves (AUC) of drugs. The areas under average sedimentation curves decreased linearly at clopidogrel concentration within the 1-3µg/ml range. The same experiments were performed and similar results were obtained with the triple antiaggregant combination (clopidogrel, acetylosalycilic acid and dipyridamole). Apparently, a synergism between the tested antiaggregants appeared at studied concentration but the number of data was not sufficient to prove the statistical significance of the difference between clopidogrel alone and in triple combination.
Keywords: Clopidogrel, Erythrocyte Sedimentation Curves, Blood Cells Aggregation, Bioequivalence Metrics, xDLVO
Introduction
Antiplatelet drugs such as clopidogrel (CLO), aspirin (ASA) and dypiridamole (DYP) are currently being used for preventing and blocking thrombocytes aggregation, especially after ischemic events like myocardial infarction and ischemic stroke. Clopidogrel doses for coronary artery diseases vary over large intervals, starting from 75mg/day and up to 900mg in cases of percutaneous coronary intervention [1]. The challenge of antiaggregant therapy is the variability of clinical effect and frequent “resistance” to treatment [2] that implies an increased risk of recurrent atherothrombotic events [3]. Screening for hypo/non-responsiveness has not been shown to improve the clinical outcomes [4]. Genetic polymorphism studies offered some hopes regarding the possibility of individualizing the therapy and avoid the resistance onset [5], but finally, the results were far from satisfactory [6,7].
After oral administration, clopidogrel is extensively biotransformed to at least eight metabolites [8]. It is accepted that clopidogrel itself has no antiaggregant properties [9], and that its therapeutic effect is dues to its active metabolite: 2-{1-1{1-(2-clorofenil)-2-metoxi-2-oxoetil}-4-sulfanil-3-piperidiniliden acid acetic [8] obtained from intermediate2-oxoclopidogrel (Fig.1), which is not active in vitro [10].
Fig. 1.
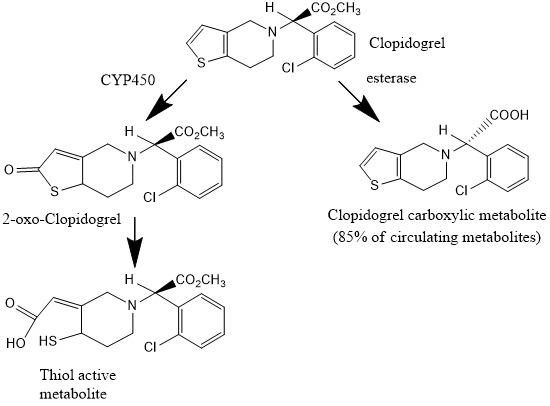
Schematic representation of clopidogrel metabolism
Since the lack of antiaggregant effect of clopidogrel was not unequivocally proved, we hypothesized that clopidogrel has an antiaggregant effect both on platelets and erythrocytes that can be tested using the effect on erythrocyte sedimentation. Consequently, we expected that clopidogrel would have an effect of decreasing the erythrocyte sedimentation rate.
Dual platelet inhibition (CLO and ASA) is the generally accepted standard therapy to avoid stent thrombosis [11]. Since aspirin and clopidogrel have complementary mechanisms of action to inhibit platelet function, indications that have been studied included coronary artery disease, atherosclerotic ischemic stroke, and atrial fibrillation [12].
Objectives of the present study include an evaluation of direct effect of clopidogrel on the erythrocytes sedimentation rate as surrogate of platelet aggregation test as well as research of the synergism between clopidogrel and small, sub-therapeutic doses of dypiridamole and asprin.
Experimental methods
Erythrocyte sedimentation curves method
The erythrocyte sedimentation curves were determined on blood samples from normal volunteers and patients with rheumatic or coronary artery disease. Whole blood (0.8ml) was collected on 0.1ml 1% EDTA and then were added 25 or 50µl solutions of antiaggregants. EDTA was used instead of citrate due to the limited solubility of both clopidogrel and dypiridamole in the presence of sodium citrate. The final concentrations were in the range 1-4µg/ml for clopidogrel, 1 and 2µg/ml for dipyridamole and aspirin. The concentrations of clopidogrel were selected as equivalent with plasma total concentration (clopidogrel plus metabolites) in antiaggregant therapy [13].
Experiments were completed within three hours of sample collection to avoid artifacts from possible irreversible aggregation of red cells.
Sedimentation curves were determined using the standard Westergren method. Experimentally, the standardized methoduses a 200-mm open-ended glass or plastic Westergren-type pipette at 25±2oC, with an internal diameter of at least 2.55mm, filled with undilutedblood with a packed cell volume fraction≤0.35 that has been collected on EDTA anticoagulant.
The effect of antiaggregants was tested by determination of sedimentation curve for a 60 minutes interval, then agitation, addition of a concentrated solution of antiaggregant and again determination of time course of the height of sediment.
The moving boundary in tubes was followed every 15 minutes for 60-minute interval. The measurements mainly determined the sedimentation delay, rate and extent (measured by maximum sedimentation and/or area under curve). Control, no-drug samples were prepared and the sedimentation measured in parallel, under identical conditions.The method validation was performed by testing the reproducibility of curves following repeated additions of phosphate buffer volumes corresponding to those of clopidogrel solutions.
Reproducibility of sedimentation method.In order to verify the precision of the method, experimental determinations were undertaken additionally four times after agitation and sedimentation.
Analysis checked that there was not a statistical significant change in the means of measured parameters. It was verified the hypothesis , H0 : β = 0, where β is the slope of the possible linear regression paramter = α + β * number of replication
The obtained value for F test comparison of Mean Square due to regression and Mean Square Error which resulted indicated that, with probability>0.99, slope is zero, and data corresponding to successive determinations, differed only following a random error.
Robustness of results to moderate dilution.
The sedimentation after addition of 0.025ml and 0.050ml saline solution to 2ml of blood were compared with control sedimentation curves at each time points of measurement.
Dilution had no effect on sedimentation process, the results being approximately constant and the regression line fitting data had a slope very closed to 1.
Microscope visualization and recording of sedimentation
Sedimentation of erythrocytes was followed at microscope IOR ML-4M using 4 and 10X objectives and images shoot 16-Megapixel (software interpolated) camera web A4Tech, CMOS640x480, mounted on a lens free eyepiece. Movie was performed at 640 x 480 resolution 30 fps) and stored on a computer. Ulterior, data were analyzed as single or sequences of images.
Results
Effect of clopidogrel on sedimentation curves
Sedimentation curves in absence (control) and in presence of 1, 2 and 3µg/ml are shown in Fig.2. It can be seen that the clusters of curves shifted down with increasing of antiagregant concentration. Addition of clopidogrel led practically for all patients, to a decrease of sedimentation but the effect was not the same in all cases. It can be observed, that the second and the third clusters appear to be splitted into three sub-clusters and, at highest concentration (3µg/ml), the curves become again homogeneously distributed inside cluster.
Fig. 2.
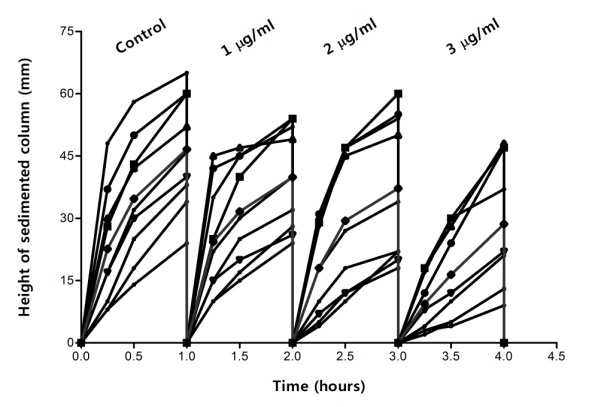
Effect of clopidogrel on sedimentation curves
The conclusions from evaluation of clusters movement were confirmed after analyzing of mean sedimentation curves (Fig.3). A more in-depth examination reveals that slopes and maximum values (observed after 1 hour) are decreasing when concentration of antiagregant increases.
Fig. 3.

Effect of clopidogrel on mean sedimentation curves
Sedimentation curves have to be characterized with at least three parameters: time-lag before sedimentation start, initial slope of curve and extent of sedimentation after a fixed time interval. It was observed that slope is decreasing continuously at the addition of clopidogrel. Decrease appeared to be linear, with a good correlation coefficient. It concerns the absolute value of decrease at 3µg/ml, from 46mm/h to less than 30mm/h (Table 1), the result can be considered as clinical significant.
Table 1.
Linear regression models of mean sedimentation curves for 1-, 2 - and 3µg/ml of CLO
| Conc. (µg/mL) | Regression equation | Height of sedimentation at 1 hour (H60) |
| Control | y = 30.8x + 16.7 | 46.6 |
| 1.0 | y = 20.2x + 20.2 | 39.9 |
| 2.0 | y = 24.2x + 14.1 | 37.2 |
| 3.0 | y = 22.1x + 4.5 | 26.3 |
In 1-3µg/ml concentration range, decrease could be statistically significant but an absolute decrease of 10mm/h for two consecutive concentrations could be clinically significant or non-significant. For example, a decrease from 30 to 20mm/h is more significant that a decrease from 50 to 40mm/h.
Effect on maximum sedimentation in a period of one hour
Maximum sedimentation in one hour (H60) is in fact the erythrocyte sedimentation rate (ESR) parameter, used in clinical practice. In this context, clinical evaluation of the effect of clopidogrel has to be related with this parameter also. In Table 1 is presented this parameter for mean curves.
It is clear a decrease of H60 with increasing concentration of clopidogrel. Much more, dependence was linear for the entire 0-3µg/ml interval.
Area Under Sedimentation Curve (AUC0 -1h).
The gold standardendpoint in case of pharmacokinetics clinical studies, used for evaluation of in vitro-in vivo correlations [14] for predicting safety and efficacy of drugs starting from physiological models [15,16], for comparison of administration schedules, evaluation of liver-or renal impairment, comparison of special populations, etc.is the Area Under Curve (AUC) [17,18,19,20,21]. Since the hierarchy of the sedimentation curves and their space distribution is less modified after first hour, and since ICSH takes as a marker for sedimentation the value obtained after 1 hour, the influence of antiaggregant concentrations on erythrocyte sedimentation was measured in almost cases only during one hour interval after starting the process. AUC is a global parameter which can integrate the effects on time-lag, slope and extent of curves.
Results concerning effect of clopidogrel on AUCs for a group of 20 subjects are presented in Fig. 4.
Fig. 4.
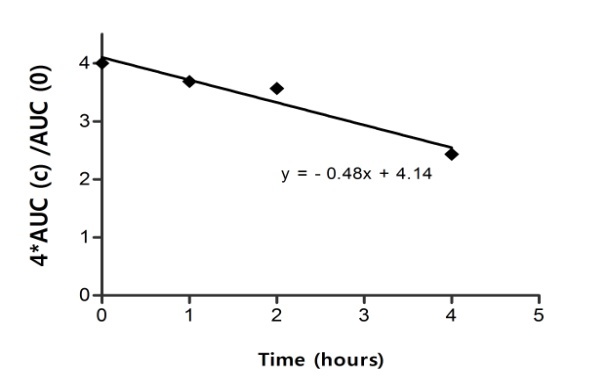
AUC (c) dependence on 1-,2- and 3µg/ml CLO
The effect increased linearly with concentration of clopidogrel to 3µg/ml. Lowering of AUCs was correlated with global effect observed on the main size and shape parameters of clusters of curves.
A parallel evaluation of all presented effects as function of clopidogrel concentration, suggests, as a global characterization, the conclusion that sedimentation is decreased linearly with approximately 30-40% by clopidogrel in 1-3µg/ml interval.
Effect of clo+asa+dyp combination on sedimentation curves
In case of subjects with low or moderate sedimentation rate, as can be seen in Fig. 5, a good linear dependence appeared between height of sedimented column and time within first hour after beginning of process.
Fig. 5.
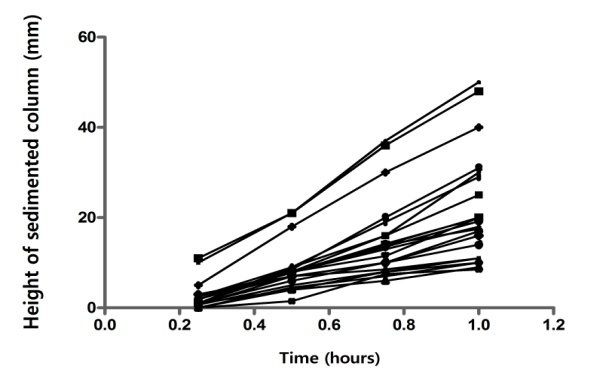
Liniarity of the sedimentation process
Practically all individual curves were approximately straight lines. The hierarchy of the mean curves confirms the global perception regarding the downshift of curves following the addition of clopidogrel(Fig. 6).
Fig. 6.
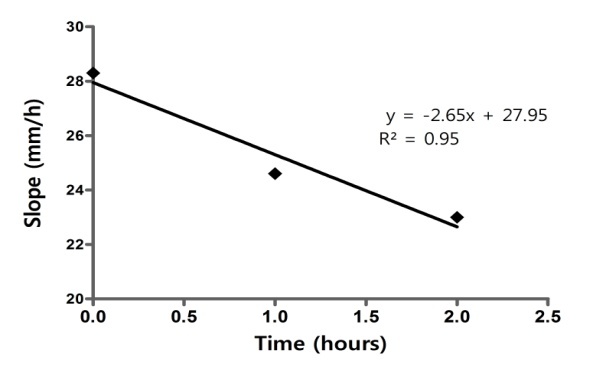
CLO+ASA+DYP. Dependence of slope on antiaggregant concentration during the first interval
Maximum sedimentation (“extent” of sedimentation) and slopes of regressions depended linear on concentration of antiaggregant combination (Fig.7 and Fig. 8), similar with the effect of CLO alone.
Fig. 7.
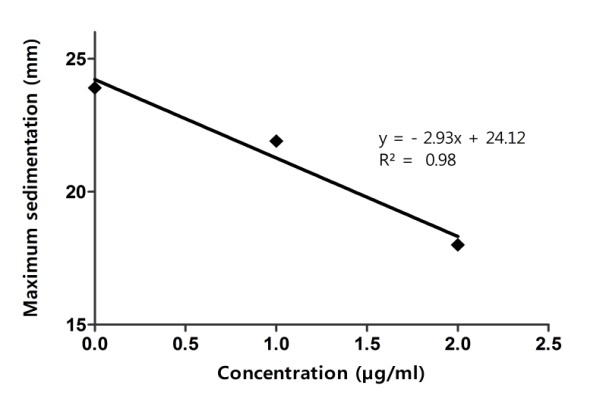
CLO+ASA+DYP dependence of maximum sedimentation on concentration
Fig. 8.

CLO+ASA+DYP.Dependence of AUC normalized to control, on antiaggregant concentration
Discussion
Specific Endpoints
The International Council for Standardization in Hematology (ICSH) recommendations defines the erythrocyte sedimentation rate (ESR) as the height of the sedimented column of erythrocytes at a given time (usually one or two hours) [22].The single-parameter characterization of erythrocyte sedimentation by ESR represents a simplified approach of a complex phenomenon closely related to erythrocyte and platelet aggregation, but offers useful clinical information for cancer, cardiovascular, inflammatory and many other diseases. However, the clear interpretation of the ESR is only apparent since in practice many difficulties are associated with the estimation of the “sedimentation rate”. For example, if the sedimentation rate reaches saturation before one hour, the apparent ESR represents an underestimation of the actual ESR. Consequently, it appeared justified to integrate the data corresponding to a curve, i.e. area under the sedimentation curve (AUSC0 - 1h).
Mechanisms of the effect of clopidogrel on erythrocyte aggregation and sedimentation
Erythrocytes “uniform sedimentation”
Increased rate of erythrocytes sedimentation was attributed to increases of some plasma proteins in blood. However, the correlation between the concentration of proteins and rate is poor [23].
Fabry [24] presented photomicrographs of approximately spherical associations of rouleaux of erythrocytes formed in the blood cell sediment. Our microscopic analysis of sedimentation support such interpretation, as can be seen on Figure 9, but it is difficult to conclude that aggregates are spherical. However, it seems that the distribution of size of aggregates is narrow enough.
Fig. 9.
Orthokinetic aggregation by capture of the smaller complexes by the large ones
If it is considered a single erythrocyte in plasma, its sedimentation velocity can be calculated by equalizing the dragging force, given by the classical Stokes law for sedimentation of a sphere in a viscous fluid, and the gravity force:
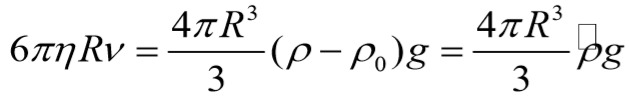
where η-fluid viscosity; R-radius of sphere; ρ-density of sphere; ρ0-density of fluid; g-gravitational acceleration.
Applying this formula to condition of erythrocytes in plasma, it obtains for v a value of approximately 3mm/h. Consequently, we have to accept that the high sedimentation rate values observed in clinical practice represent in fact the sedimentation velocities of erythrocyte aggregates, and maybe the greater the number of erythrocytes in the aggregate the higher the sedimentation velocity. Thus, the sedimentation rate is an indirect estimation of erythrocytes aggregability.
Effect of clopidogrel on erythrocytes and platelets aggregation based on extended DLVO theory
Erythrocyte aggregation is a reversible process under low shear forces determined by in vivo hemodynamics or at stasis. The erythrocytes aggregate into a first phase, in a special way forming rouleaux, i.e. stacks of red blood cells (RBCs). This phenomenon is termed “RBC aggregability” and it is used to describe the cell’s intrinsic tendency to aggregate [25].
The heterotypic aggregation of cell mixtures or colloidal particles such as proteins occurs in a variety of settings such as thrombosis, immunology, cell separations, and diagnostics. Monte Carlo (MC) algorithm permitted [26] exact calculation of the decay rates of monomers and the temporally evolving distribution of sizes and compositions of the aggregates. Assuming that all aggregation events result from binary collisions, the kinetics may be derived by treating all such events as elementary chemical reactions.
Population balance discrete equation (PBE) defines the rate of change of number density, Ni, of aggregates comprised of i singlets (cells) and is given as:
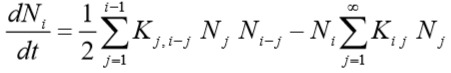
where Kij (called “coagulation kernel”) is much like a rate constant for an elementary secondorder “chemical reaction” and can be interpreted as the successful collision frequency (probability of actual aggregation) between aggregates comprised of i and jsinglet, respectively.
The first term represents the formation of particles with i singlets by aggregation of particles having fewer than i singlets (factor of 1/2 prevents double counting). The second term describes disappearance of i singlets as a result of them aggregating with other particles to form even larger particles.
Assuming particles follow linear trajectories in shear flows by neglecting hydrodynamic interactions, Smoluchowski [27] suggested the following expression for the collision frequency for two spheres of volume v1 and v2 undergoing shear-induced aggregation:
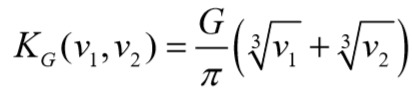
G is the shear rate. Belval & Hellums [28] and Huang & Hellums [29, 30, 31] have used equation to model the platelet population dynamics of heparinized platelet-rich plasma (PRP).
The probability πij that collision of complexes to provoke their fusion, is determined by the exponential of energy of activation of “fusion reaction”, which is sum between attraction and repulsion energy between RBC.
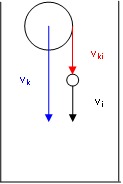
In fact, the processes are more complex since, after some time appears an orthokinetic aggregation by caption of smaller aggregates by greater ones (Fig.9, Fig 10.) during their sedimentation with velocities vk and vi : ( vki = vk - vi).
Fig. 10.
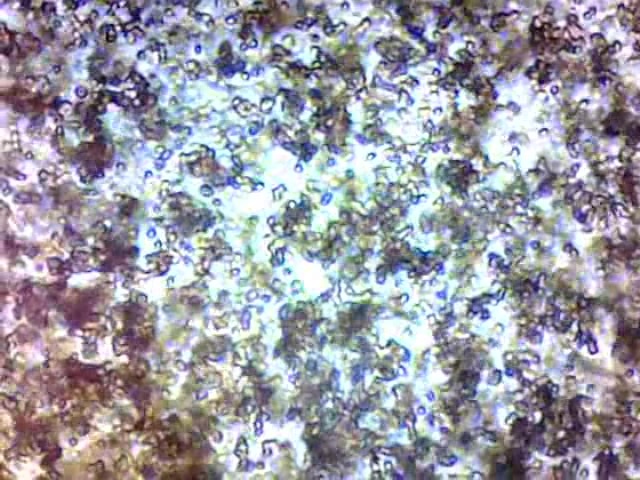
Aggregates of approximately same size in sedimenting blood
Moving boundary sedimentation of erythrocytes implies the rapid appearance of approximately equal size assemblies of rouleaux which sediment which the same velocity.
In fact, the actual evolution of the system is slightly different. In case of erythrocytes aggregation and sedimentation, appears a shear stress which induces disaggregation and the system reaches steady-state, when aggregates have practically all the same size and sedimentation velocity.
Additionally, in our experiments, analysing the videos recorded during the process of sedimentation was observed that, in presence of clopidogrel, orthokinetic aggregation concerns large and medium size assemblies. Single erythrocytes or small assemblies are “pushed away” or accelerated by large complexes.
Proposed mechanisms for the effect of clopidogrel on erythrocyte aggregation and sedimentation
Under physiological conditions the platelet membrane has an overall negative charge, and it has been suggested that this charge may play a role in the adhesion and aggregation processes [8,32].
As a rule, antiplatelet drugs decrease the sedimentation rate of erythrocytes and pro-aggregants increase the sedimentation rate [33]. Consequently, the effect of clopidogrel could likely be due to an increase of ζ following its absorption in the double layer of the erythrocyte membrane. Increasing of repulsion potential leads further to decreasing of aggregates size. It was found experimentally [34] that erythrocytes sedimentation is determined by aggregation, a good correlation between logarithm of time of aggregation and logarithm of ESR appearing in almost cases.
Regardless of the existence or not of a specific biochemical mechanism, all amphiphilic substances accumulate at membrane interfaces and modify the structure of the electrical double layer. Furthermore, this could induce a decrease of the probability πij for aggregates to collide and lead to their fusion. Negatively charged molecules increase the zeta potential and repulsive forces, increasing the stability of RBC suspension.
Conclusion
Clopidogrel added in vitro to whole blood at 1-3µg/ml concentrations decreased the rate and the extent of erythrocyte sedimentation. These results could be considered as a confirmation of the hypothesis that platelet antiagregantclopidogrel has to decrease the aggregation and consequently, the sedimentation of erythrocytes.
The effect of clopidogrel or antiaggrenat triplet estimated by a global, cluster analysis was a downshifting of the erythrocyte sedimentation curves. The analysis of parameters (initial rate, maximum sedimentation) of mean curves confirmed the conclusions of the global analysis. The effect was a continuous decrease of the sedimentation rate with increasing concentrations of clopidogrel for the 1-3µg/ml concentration range.
The dependence between global parameter of curves, AUC, and the concentration of clopidogrel was linear. The effect of clopidogrel observed in vitro could be explained in terms of an inhibition of erythrocytes aggregation.
The effect of antiaggregant triplet combination on AUC was greater but it was not possible to prove that this increase is statistically sufficient.
Correlation of the herein presented results with previously experiments of authors suggests that, farther, sedimentation of erythrocytes could become an alternative ex vivo simple, “point-of-care” and rapid method for screening non-responsiveness or resistance to clopidogrel therapy in vivo.
Acknowledgments
This work received financial support through the project entitled "CERO-Career profile: Romanian Researcher", grant number POSDRU/159/1.5/S/135760, cofinanced by the European Social Fund for Sectoral Operational Programme Human Resources Development 2007-2013”, coordinator “Carol Davila” University of Medicine and Pharmacy, Bucharest.
References
- 1.von Beckerath N, Taubert D, Pogatsa-Murray G, Schömig E, Kastrati A, Schömig A. Absorption, metabolization, and antiplatelet effects of 300-, 600-, and 900-mg loading doses of clopidogrel: results of the ISAR-CHOICE (Intracoronary Stenting and Antithrombotic Regimen: Choose Between 3 High Oral Doses for Immediate Clopidogrel Effect) Trial. Circulation. 2005;112(19):2946–2950. doi: 10.1161/CIRCULATIONAHA.105.559088. [DOI] [PubMed] [Google Scholar]
- 2.Tantry US, Bliden KP, Gurbel PA. Resistance to antiplatelet drugs: current status and future research. Expert OpinPharmacother. 2005;6:2027–2027. doi: 10.1517/14656566.6.12.2027. [DOI] [PubMed] [Google Scholar]
- 3.Matetzky S, Shenkman B, Guetta V, Shechter M, Beinart R, Goldenberg I, Novikov I, Pres H, Savion N, Varon D, Hod H. Clopidogrel resistance is associated with increased risk of recurrent atherothrombotic events in patients with acute myocardial infarction. Circulation. 2004;109(25):3171–3175. doi: 10.1161/01.CIR.0000130846.46168.03. [DOI] [PubMed] [Google Scholar]
- 4.Sibbing D, Braun S, Morath T, Mehilli J, Vogt W, Schömig A, Kastrati A, von Beckerath N. Platelet reactivity after clopidogrel treatment assessed with point-of-care analysis and early drug-eluting stent thrombosis. J Am CollCardiol. 2009;53(10):849–858. doi: 10.1016/j.jacc.2008.11.030. [DOI] [PubMed] [Google Scholar]
- 5.Bauer T, Bouman HJ, van Werkum JW, Ford NF, ten Berg JM, Taubert D. Impact of CYP2C19 variant genotypes on clinical efficacy of antiplatelet treatment with clopidogrel: systematic review and meta-analysis. BMJ. 2011;343:d4588–d4588. doi: 10.1136/bmj.d4588. [DOI] [PMC free article] [PubMed] [Google Scholar]
- 6.Nissen SE. Pharmacogenomics and clopidogrel: irrational exuberance? JAMA. 2011;306(24):2727–2728. doi: 10.1001/jama.2011.1865. [DOI] [PubMed] [Google Scholar]
- 7.Krishna V, Diamond GA, Kaul S. Do platelet function testing and genotyping improve outcome in patients treated with antithrombotic agents? The role of platelet reactivity and genotype testing in the prevention of atherothrombotic cardiovascular events remains unproven. Circulation. 2012;125(10):1288–1303. doi: 10.1161/CIRCULATIONAHA.111.075242. [DOI] [PubMed] [Google Scholar]
- 8.Pereillo J-M, Maftouh M, Andrieu A, Uzabiaga M-F, Fedeli O, Savi P, Pascal M, Herbert J-M, Maffrand J-P, Picard C. Structure and stereochemistry of the active metabolite of clopidogrel. Drug MetabDispos. 2002;30(11):1288–1295. doi: 10.1124/dmd.30.11.1288. [DOI] [PubMed] [Google Scholar]
- 9.Plavix Summary of product characteristics. 2013 [Google Scholar]
- 10.Savi P, Pereillo JM, Uzabiaga F, Combalbert J, Picard C, Maffrand JP, Pascal M, and Herbert JM. Identification and biological activity of the active metabolite of Clopidogrel. ThrombHaemostasis. 2000;84(5):891–899. [PubMed] [Google Scholar]
- 11.Baer FM, Erdmann E. Dual platelet aggregation inhibition in coronary artery stent implantation--what is evidence-based. Dtsch Med Wochenschr. 2007;132(23):1275–1280. doi: 10.1055/s-2007-982027. [DOI] [PubMed] [Google Scholar]
- 12.Reaume KT, Regal RE, Dorsch MP. Indications for dual antiplatelet therapy with aspirin and clopidogrel: evidence-based recommendations for use. Ann Pharmacother. 2008;42(4):550–557. doi: 10.1345/aph.1K433. [DOI] [PubMed] [Google Scholar]
- 13.Karazniewicz-Lada M, Danielak D, Burchardt P, Kruszyna L, Komosa A, Lesiak M, Glówka F. Clinical pharmacokinetics of clopidogrel and its metabolites in patients with cardiovascular diseases. ClinPharmacokinet. 2014;53(2):155–164. doi: 10.1007/s40262-013-0105-2. [DOI] [PMC free article] [PubMed] [Google Scholar]
- 14.Mircioiu C, Voicu V, Miron D, Mircioiu I. Non-standard correlations: in vitro in vivo correlations for immediate release products: comparison of different bioequivalence experiments. Basic ClinPharmacolToxicol. 2005;96(3):265–267. doi: 10.1111/j.1742-7843.2005.pto9603223.x. [DOI] [PubMed] [Google Scholar]
- 15.Mircioiu C, Ionica G, Danilceac A, Miron D, Mircioiu I, Radulescu F. Pharmacokinetic and mathematical outliers for drugs with active metabolites. Model independent analyses for pentoxifylline. Farmacia. 2009;58(3):264–278. [Google Scholar]
- 16.Tvrdonova M, Chrenova J, Rausova Z, Miklovicova D, Durisova M, Mircioiu C, Dedik L. Novel approach to bioequivalence assessment on based physiologically motivated model. Int J Pharm. 2009;380(1-2):89–95. doi: 10.1016/j.ijpharm.2009.07.004. [DOI] [PubMed] [Google Scholar]
- 17.FDA proposes to depart from conventional bioequivalence metrics. 2011 Available from: http://www.fdalawblog.net/
- 18.Polli JE, McLean AM. Novel direct curve comparison metrics for bioequivalence. Pharm Research. 2001;18(6):734–741. doi: 10.1023/a:1011067908500. [DOI] [PubMed] [Google Scholar]
- 19.Karalis V, Macheras P. Pharmacodynamic considerations in bioequivalence assessment: comparison of novel and existing metrics. Eur Jour of Pharm Scie. 2003;19(1):45–56. doi: 10.1016/s0928-0987(03)00064-2. [DOI] [PubMed] [Google Scholar]
- 20.Bayoud HA and Awad AM. Performance of several bioequivalence metrics for assessing the rate and extent of absorption. J BioequivAvailab. 2011;3(7):174–177. [Google Scholar]
- 21.Endrenyi L, Tothfalusi L. Metrics for the evaluation of bioequivalence of modified-release formulations. AAPS J. 2012;14(4):813–819. doi: 10.1208/s12248-012-9396-8. [DOI] [PMC free article] [PubMed] [Google Scholar]
- 22.ICSH recommendations for measurement of erythrocyte sedimentation rate. International Council for Standardization in Haematology (Expert Panel on Blood Rheology) Clin Pathol. 1993;46(3):198–203. doi: 10.1136/jcp.46.3.198. [DOI] [PMC free article] [PubMed] [Google Scholar]
- 23.Linderkamp O, Ozanne P, Wu PY, Meiselman HJ. Red blood cell aggregation in preterm and term neonates and adults. Pediatr Res. 1984;18(12):1356–1360. doi: 10.1203/00006450-198412000-00028. [DOI] [PubMed] [Google Scholar]
- 24.Fabry TL. Mechanism of erythrocyte aggregation and sedimentation. Blood; 1987;70(5):1572–1576. [PubMed] [Google Scholar]
- 25.Rampling MW, Meiselman HJ, Neub B, Baskurt OK. Influence of cell-specific factors on red blood cell aggregation. Biorheology. 2004;41(2):91–112. [PubMed] [Google Scholar]
- 26.Laurenzi IJ, Diamond SL. Monte Carlo simulation of the heterotypic aggregation kinetics of platelets and neutrophils. Biophys J. 1999;77(3):1733–1746. doi: 10.1016/S0006-3495(99)77019-0. [DOI] [PMC free article] [PubMed] [Google Scholar]
- 27.Smoluchowski M. DreiVorträgeüber Diffusion, BrownscheMolekularbewegung und Koagulation von Kolloidteilchen. Physik. Z (in German); 1917;17:557–571–557–571. [Google Scholar]
- 28.Belval TK, Hellums JD. Analysis of shear induced platelet aggregation with population balance mathematics. Biophys J. 1986;50(3):479–487. doi: 10.1016/S0006-3495(86)83485-3. [DOI] [PMC free article] [PubMed] [Google Scholar]
- 29.Huang PY, Hellums JD. Aggregation and disaggregation kinetics of human blood platelets. Part I. Development and validation of a population balance method. Biophys J. 1993;65(1):334–343. doi: 10.1016/S0006-3495(93)81078-6. [DOI] [PMC free article] [PubMed] [Google Scholar]
- 30.Huang PY, Hellums JD. Aggregation and disaggregation kinetics of human blood platelets. Part II. Shear-induced platelet aggregation. Biophys J. 1993;65(1):344–353. doi: 10.1016/S0006-3495(93)81079-8. [DOI] [PMC free article] [PubMed] [Google Scholar]
- 31.Huang PY, Hellums JD. Aggregation and disaggregation kinetics of human blood platelets. Part III. Disaggregation under shear stress of platelet aggregation. Biophys J. 1993;65(1):354–361. doi: 10.1016/S0006-3495(93)81080-4. [DOI] [PMC free article] [PubMed] [Google Scholar]
- 32.Larcan A, Stoltz JF, Streiff F. La charge électrique des élémentsfigurés du sang. E M Int (Paris) 1974;170 [Google Scholar]
- 33.Voicu VA, Mircioiu C, Jiquidi M, Gref R, Olteanu M. Studies concerning some effects of drugs, colloid vectors for drugs and decorporators on some physicochemical parameters of blood. In: Sohns T, Voicu V, editors. Current capabilities and future perspectives for protection. Amsterdam: Kluwer Academic; 1999. pp. 311–330. [Google Scholar]
- 34.Potron G, Jolly D, Nguen P, Mailliot JL, Pignon B. Approche de l’aggregationerythrocytaire par mesure automatique de la vitesse de sedimentation. Application d’unemodele de calculdans le cadre de differantes pathologies, in 8 Reunion de la Societe Francaise de Biorheologie Fondamentale et Clinique. Saint-Malo. 1993;73-83 [Google Scholar]