Abstract
OBJECTIVES:
Use machine learning to more accurately predict survival after echocardiography.
BACKGROUND:
Predicting patient outcomes (e.g. survival) following echocardiography is primarily based on ejection fraction (EF) and comorbidities. However, there may be significant predictive information within additional echocardiography-derived measurements combined with clinical electronic health record data.
METHODS:
We studied mortality in 171,510 unselected patients who underwent 331,317 echocardiograms in a large regional health system. We investigated the predictive performance of non-linear machine learning models compared with that of linear logistic regression models using 3 different inputs: 1) clinical variables (CV), including 90 cardiovascular-relevant ICD-10 codes, age, sex, height, weight, heart rate, blood pressures, LDL, HDL, smoking; 2) CV plus physician-reported EF; and 3) CV, EF, plus 57 additional echocardiographic measurements. Missing data were imputed with a multivariate imputation by chained equations (MICE) algorithm. We compared models to each other and baseline clinical scoring systems using a mean area under the curve (AUC) over 10 cross-validation folds and across 10 survival durations (6–60 months).
RESULTS:
Machine learning models achieved significantly higher prediction accuracy (all AUC>0.82) over common clinical risk scores (AUC=0.61−0.79) with the non-linear random forest models outperforming logistic regression (p<0.01). The random forest model including all echocardiographic measurements yielded the highest prediction accuracy (p<0.01 across all models and survival durations). Only 10 variables were needed to achieve 96% of the maximum prediction accuracy, with 6 of these variables being derived from echocardiography. Tricuspid regurgitation velocity was more predictive of survival than LVEF. In a subset of studies with complete data for the top 10 variables, MICE imputation yielded slightly reduced predictive accuracies (difference in AUC of 0.003) compared to the original data.
CONCLUSIONS:
Machine learning can fully utilize large combinations of disparate input variables to predict survival after echocardiography with superior accuracy.
Keywords: Echocardiography, electronic health records, mortality, machine learning
INTRODUCTION
Echocardiography is fundamental to the practice of cardiology, with over 10 million echocardiograms performed annually in Medicare patients alone (1). From these image data, cardiologists often derive hundreds of measurements, in addition to a patient’s demographics and relevant clinical history, to arrive at a final clinical interpretation. This clinical interpretation helps to provide a diagnosis, prognosticate patient outcomes and ultimately guide therapeutic decisions. With the increasing amount of acquired image data and measurements derived from the images, along with the rapidly growing amount of electronic health record (EHR) data, humans may no longer be able to fully and accurately interpret these data.
For example, there are over 500 measurements derived from echocardiography at our institution, each echocardiogram consists of thousands of images, and there are 76 international classification of diseases version 10 (ICD-10) high-level diagnostic codes that fall into the category of “diseases of the circulatory system.” With this amount of data and the limited time available to physicians for interpretation, it is highly likely that the full potential of echocardiographic data is not being realized in current clinical practice.
Machine learning can help to overcome these limitations by providing automated analysis of large clinical datasets (2). In fact, machine learning has been gradually permeating into cardiovascular research already with recent examples in the literature showing its ability to 1) provide assistance with challenging differential diagnoses such as restrictive cardiomyopathy vs constrictive pericarditis (3) and physiologic vs pathologic cardiac hypertrophy (4), 2) predict survival from coronary CT data (5), 3) predict in-hospital mortality in patients undergoing surgery for abdominal aortic aneurysm (6), and 4) develop refined classifications or “phenotypes” of patients with heart failure and preserved ejection fraction (7). These studies demonstrated the promise of machine learning in cardiovascular medicine. However, sample sizes in these studies are relatively small for machine learning to efficiently learn from dozens of features, especially given tendencies for overfitting small datasets (8). Additionally, most of these studies used clean and complete datasets acquired prospectively, which may not render immediate clinical application like EHR data.
To date, there has been no effort to use machine learning to take advantage of standard clinical and echocardiographic data to help physicians predict outcomes in the broad population of patients who undergo echocardiography during routine clinical care. We hypothesized that nonlinear machine learning models would have superior accuracy to predict all-cause mortality compared to linear models, and that utilizing all measurements obtained from routine echocardiograms would provide superior prediction accuracy compared to standard clinical data (including common clinical risk scores (9–12)) and physician-reported left ventricular ejection fraction (LVEF). We built on previous machine learning studies in cardiology by using a large, clinically-acquired dataset (331,317 echocardiograms from 171,510 patients) linked to extensive outcome data (median follow-up duration of 3.7 years). We also used machine learning to uncover new pathophysiological insights by quantifying the relative importance of input variables to predicting survival in patients undergoing echocardiography. Finally, we assessed how many and which variables were most informative for accurate survival prediction.
METHODS
ELECTRONIC HEALTH RECORD DATA.
We identified all echocardiograms performed over 19 years (1998 – June 2017) from the EHR of a large regional health system centered in Danville, PA (Geisinger). Echocardiograms were required to have a resting (unstressed), physician-reported LVEF. Structured fields in the EHR (installed in 1996) were collected at the time of echocardiogram, including age, sex, smoking status, height, weight, vital signs (heart rate, diastolic and systolic blood pressures), cholesterol (LDL and HDL acquired within 6 months of echocardiograms) and 90 cardiovascular-relevant ICD-10 codes from patient problem lists (diseases of the circulatory system, diabetes, chronic kidney disease, dyslipidemia, and congenital heart defects; Online Table 1). We used the dates of all echocardiograms and the date of death (checked monthly against national databases) or last living encounter (for censoring) to study all-cause mortality. Patients with unknown survival status for the specified survival period were excluded. Additionally, all measurements recorded in the echocardiographic database (Xcelera) were extracted. This database is vendor neutral and therefore includes echocardiograms from multiple vendor platforms, collected by numerous different clinical providers throughout our large health system. The qualitative assessment of diastolic function from echocardiography was categorized into ‘normal’, ‘stage I’, ‘stage II’, or ‘stage III’ as an ordinal variable. The assessments of regurgitation and stenosis of 4 valves (aortic, mitral, tricuspid, pulmonary) were categorized into 5 groups: ‘absent’, ‘mild’, ‘moderate’, ‘severe’, and ‘not assessed’. These categorical assessments of the 4 valves and other categorical variables (sex, smoking status, and 90 ICD-10 codes) were converted to binary variables. This retrospective study was approved by the Geisinger IRB and performed with a waiver of consent.
PRE-PROCESSING OF EHR DATA.
We removed physiologically impossible values (e.g. LVEF <0% or >100% likely due to human error). We also removed measurements above the average plus 3-standard deviations to eliminate extreme cases in unbounded measurements such as the aortic root diameter (where a maximum, erroneous measurement was 85cm). We also removed ambiguous measurements used as placeholders in the Xcelera database, which did not carry specific meaning (for example, a variable named “area” not specific to a location).
Since the models required complete datasets, missing data for each remaining measurement were imputed using 2 steps. First, missing values in between echocardiography sessions for an individual patient were linearly interpolated if complete values were found in the adjacent echocardiograms. Next, we removed all echocardiographic measurements that were missing in 90% or more samples. The remaining missing values were imputed using multivariate imputation by chained equations (MICE) (13), implemented in the “fancy_impute” package (https://pypi.python.org/pypi/fancyimpute). Briefly, MICE predicts missing values by iteratively optimizing a series of regression models using other, potentially predictive, variables. The effect of imputing missing values on the prediction accuracy was investigated in a subgroup analysis (Appendix). The missing categorical values of diastolic function were imputed using logistic regression. Finally, we removed redundant variables that were derived solely from other measured variables (for example, the right ventricular systolic pressure is derived from the estimated right atrial pressure and maximum tricuspid regurgitation pressure gradient and is therefore redundant).
LINEAR VS NON-LINEAR PREDICTIVE MODELS.
For model comparisons, 3 different forms of input data (Online Table 2) were used: 1) clinical variables alone (n=100), 2) clinical variables plus physician-reported LVEF (n =101), and 3) clinical variables plus LVEF plus 57 non-redundant, echocardiographic variables (n=158). We tested performances of 6 different machine learning classifiers (linear and non-linear, Online Table 3) to predict 5-year all-cause mortality for the 3 forms of input data and chose the superior non-linear model, random forest, for subsequent analyses. The predictive performance of a random forest classifier was compared with that of a widely used linear predictive model, logistic regression.
STATISTICAL ANALYSIS AND MODEL PERFORMANCE.
The performance of the machine learning predictive models (described below) was evaluated using a 10-fold cross-validation scheme (5,14). Echocardiography studies were divided into 10 separate, equally-sized folds. No patient had an echocardiogram in both the training and test folds. The hyper-parameters of the predictive models such as regularization type and level, or number of trees, were tuned within the training set following a nested cross-validation (15). An open source package called “scikit-learn” (16) was used to implement the machine learning pipeline and evaluate the models. We used Wilcoxon signed-rank tests (17) to statistically compare the model predictive accuracies using the 10 AUCs obtained from the 10 cross-validation folds described below. A p value of less than 0.05 was considered statistically significant. Overall performance was reported as the mean AUC and standard deviation over 10 cross-validation folds.
OPTIMIZING SURVIVAL PREDICTION USING CLINICAL, LVEF AND ECHOCARDIOGRAPHIC DATA.
We calculated Framingham risk score (FRS) using the low-density lipoprotein cholesterol categorical model as in Wilson et al. (12) using 8 input variables (age, sex, LDL, HDL, systolic and diastolic blood pressures, diabetes and smoking status). First, we obtained the AUC for the FRS to predict mortality at 10 sequential survival durations ranging from 6 months to 60 months in 6-month increments. Compared to FRS as a baseline, we then investigated the accuracy to predict all-cause mortality using 3 random forest models corresponding to the 3 forms of input data discussed in the previous section. Each of the 3 random forest models was trained and tested using 10-fold cross-validation to predict all-cause mortality up to 5 years after echocardiography. Since the FRS is not defined in patients older than 74 years of age, we excluded patients over 74 years old at the time of echocardiogram for FRS analysis. Later, we performed an additional comparison between the machine learning models after excluding patients above 74 years of age in order to evaluate this potential limitation.
We subsequently evaluated 5-year survival prediction performance of 3 additional clinical risk scoring systems: 1) the Seattle Heart Failure Model (11), 2) the Charlson Comorbidity Index (CCI) (10), and 3) the ACC/AHA cardiovascular risk guideline score (9,18). The Seattle Heart Failure Model was applied only to the subgroup of heart failure patients obtained from a previous study at our institution (19).
VARIABLE IMPORTANCE RANKING.
The relative importance of all predictor variables were obtained based on the “Mean decrease impurity” technique using the random forest classifier (20). Briefly, the proportion of total samples appearing at each decision node contributes to the importance of the variable defining the node, which was averaged across all decision trees. Since we maintained an equal number of samples across folds, we averaged the quantitative importance of an individual variable over the 10 test folds to obtain an average predictive importance and to rank the top 10 predictive variables separately for 1 and 5-year survival models. To summarize these variable importance rankings across all 10 survival prediction models, we obtained the rank ordering of the variables for each model, and then averaged these ranks across the 10 models. The top 10 variables with the highest average ranks were reported.
RESULTS
STUDY POPULATION.
We identified 331,317 echocardiographic studies from 171,510 unique patients within the Geisinger EHR that fit enrollment criteria. The median age of the patients was 65 years with 49% of them being males (see Online Table 4 for details). Each patient underwent 2.05 echocardiograms on average (range: 1–34). The median follow-up duration was 3.7 years [IQR: 1.2–7.8] using inverse Kaplan-Meier (21), and 23% of the patients had a recorded death. The overall missing-ness of the original dataset prior to any preprocessing and imputation was 22%. Figure 1 shows the overall study design and key findings.
FIGURE 1: Analytical Framework for Survival Prediction.
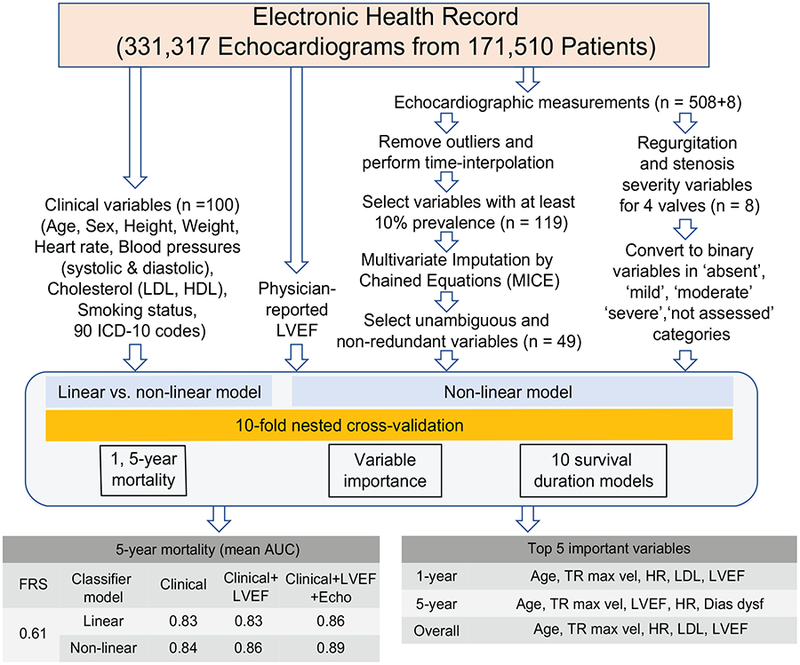
A machine learning pipeline was used to evaluate prediction of multi-duration all-cause mortality after echocardiography using clinical variables, physician-reported LVEF, and echocardiographic measurements from electronic health records. The predictive performance was evaluated using linear (logistic regression) and nonlinear (random forest) machine learning models and the area under the curve (AUC) was reported. The top 5 most important variables were reported for different models.
Dias func = Diastolic function, FRS = Framingham risk score, HR = heart rate, LDL = low-density lipoprotein, LVEF = left ventricular ejection fraction, TR max vel = tricuspid regurgitation jet maximum velocity
OPTIMIZING SURVIVAL PREDICTION USING CLINICAL, LVEF AND ECHOCARDIOGRAPHIC DATA.
Machine learning models showed large improvements in the prediction accuracy over that achieved using FRS (Figure 2) and any of the 4 clinical scoring systems (Table 1). Excluding patients above 74 years of age from the machine learning models, for which FRS is technically not defined, did not change the relative order of prediction accuracy (Online Table 5). When compared to the linear classifier, the non-linear random forest model showed significantly better (p<0.01 for all comparisons) accuracy for predicting all-cause mortality for all 3 sets of variable inputs (Table 2). The superiority of the non-linear model was evident across all 3 variable inputs for predicting both 1 and 5-year all-cause mortality. Because of the superiority of non-linear models, we used random forest classifiers in subsequent analyses. Figure 2 demonstrates that, using the non-linear random forest model, adding clinically-assessed LVEF as an input variable modestly improved prediction performance across all 10 survival duration models when compared to using just the 100 clinical variables alone. Inclusion of the additional 57 echo measurements to LVEF and clinical variables provided substantial additive benefit to the prediction accuracy, across all 10 survival models (all p<0.01).
FIGURE 2: All-cause Mortality Prediction Performance Across 10 Survival Durations.
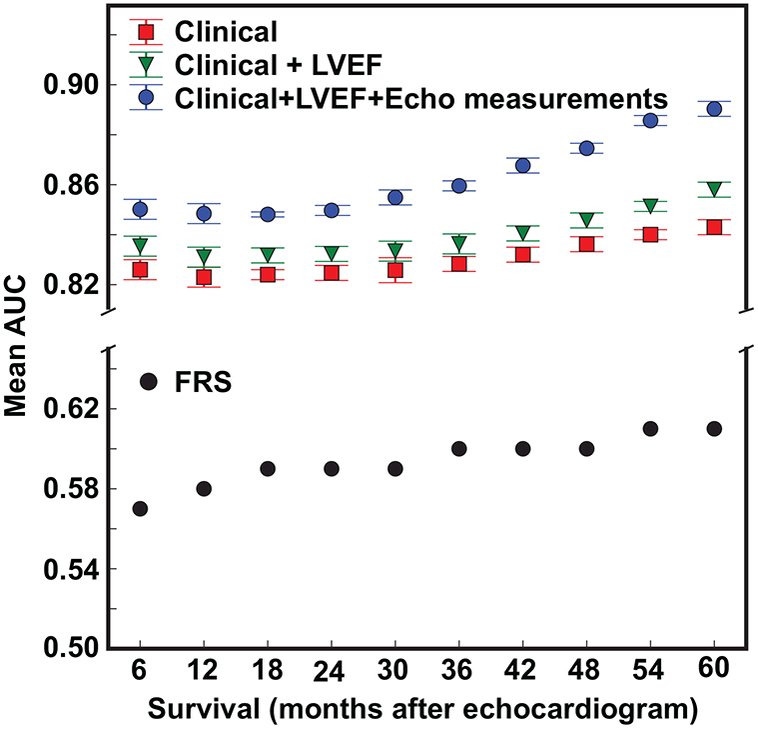
Mean AUC of 10 survival duration models for 3 different sets of variable inputs using random forest.
TABLE 1.
Comparing baseline clinical scores with machine learning in 5-year mortality prediction.
| Patient population | Predictive models | Area under ROC curve |
|---|---|---|
| All patients | Framingham Risk Score | 0.61 |
| ACC/AHA guideline score | 0.74 | |
| Charlson Comorbidity Index | 0.79 | |
| Machine learning with echocardiographic measurements | 0.89 | |
| 15942 patients with heart failure | Seattle Heart Failure Model | 0.63 |
| Machine learning with echocardiographic measurements | 0.80 |
ROC = receiver operating characteristic.
TABLE 2.
Comparing the Predictive Performance of Different Inputs and Models.
| 1-year mortality (AUC) | 5-year mortality (AUC) | |||
|---|---|---|---|---|
| FRS | 0.58 | 0.61 | ||
| Inputs | Linear | Non-linear | Linear | Non-linear |
| Clinical only | 0.791 | 0.820** | 0.827 | 0.843** |
| Clinical + LVEF | 0.800 | 0.831** | 0.831 | 0.858** |
| Clinical +LVEF + Echo | 0.824 | 0.848** | 0.864 | 0.893** |
Values in [] denote 95% confidence intervals across 10 cross-validation folds.
(p<0.01), Wilcoxon signed-rank test significance compared to baseline linear model. AUC = area under the curve, Echo = echocardiographic measurements, FRS = Framingham risk score, LVEF = left ventricular ejection fraction
VARIABLE IMPORTANCE.
The relative importance of different input variables was determined using the best classifier (non-linear random forest) and variable inputs (clinical + LVEF + echocardiographic measurements). For shorter survival durations (1-year), equal numbers (5 vs. 5) of clinical and echocardiographic variables (including LVEF) were in the top 10 variable-ranking (Figure 3A). However, echocardiographic measurements outnumbered (6 vs. 4) clinical variables for the longer 5-year survival duration model (Figure 3B). The relative importance of patient age, compared to other variables, was higher for the 5-year survival duration model compared to the 1-year survival duration model (Figures 3A,B).
FIGURE 3: Variable Importance.
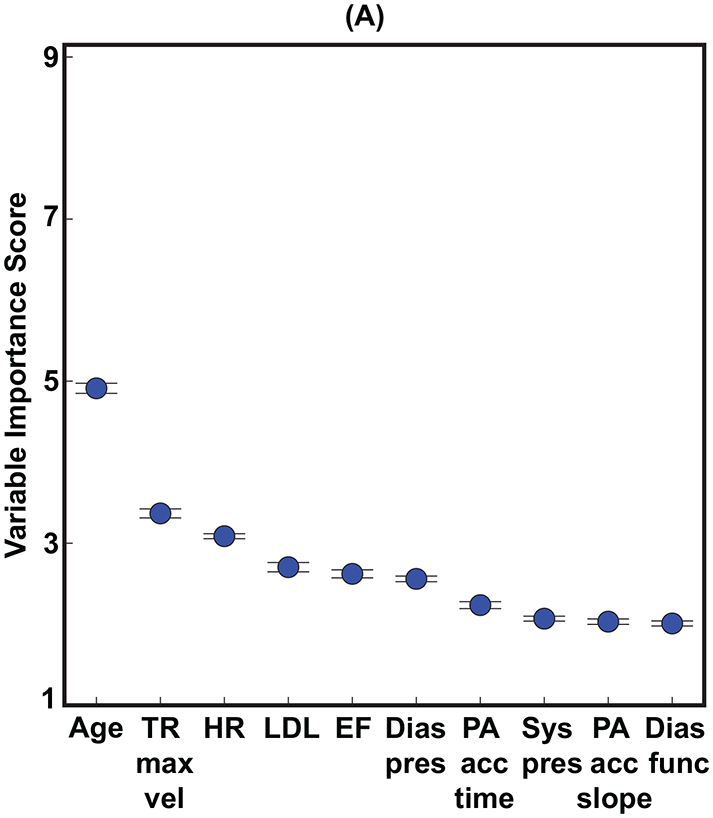
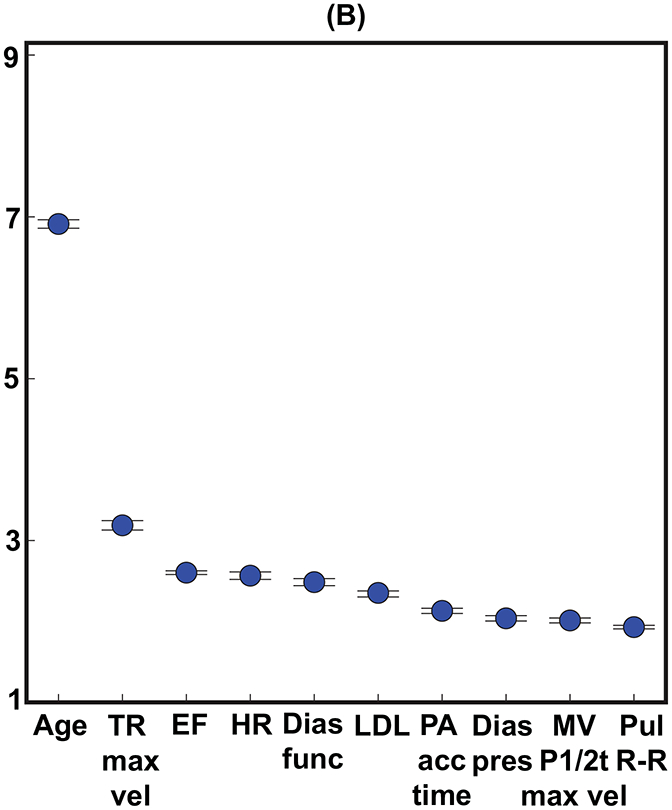
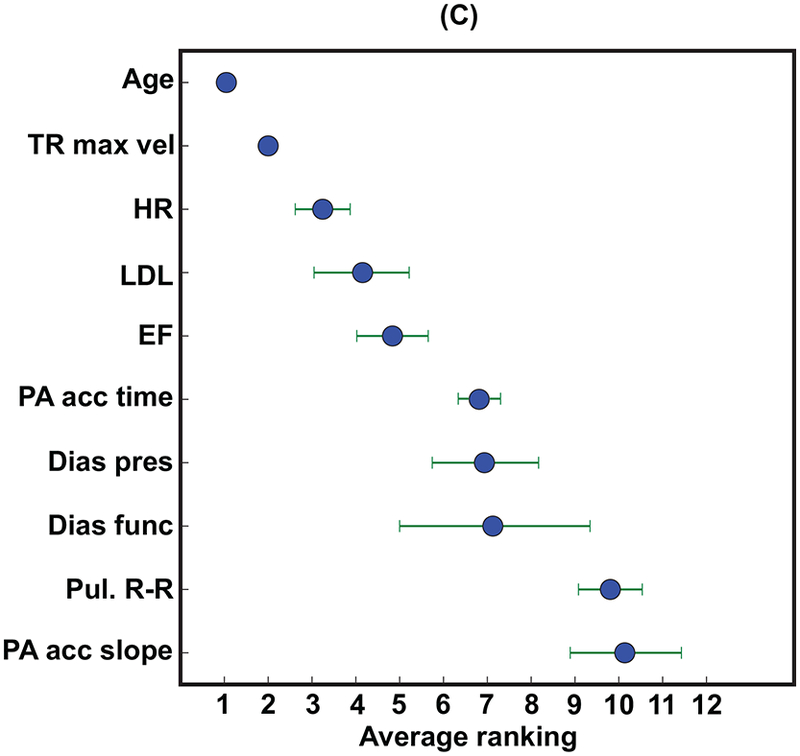
The top 10 variables for predicting both (A) 1-year and (B) 5-year all-cause mortality. (C) shows the average rank order of the input variables over all 10 survival models. Importance scores are scaled to show relative importance.
Dias func = diastolic function, Dias pres = diastolic blood pressure, EF = ejection fraction (left ventricular), HR = heart rate, LDL = low-density lipoprotein, MV P1/2t max vel = maximum velocity of mitral valve flow, PA acc = pulmonary artery acceleration, Pul R-R = pulmonary R-R time interval, Sys pres = systolic blood pressure, TR max vel = tricuspid regurgitation jet maximum velocity.
The aggregate rank ordering of the variables over time averaged across all 10 survival duration models (Figure 3C) showed that age and an indirect measure of pulmonary systolic pressure (tricuspid regurgitation jet maximum velocity) were uniformly the two most important variables across all 10 survival duration models. The physician-reported LVEF was, on average, the fifth most important variable following heart rate and LDL. Four clinical variables were in the top 10 (age, heart rate, LDL, and diastolic blood pressure) and none of the ICD codes were within the top 10. Thus, 6 of the top 10 variables were echocardiographic measurements (including the physician-reported LVEF), and 3 of these variables were indirect measures of pulmonary systolic pressure (tricuspid regurgitation jet maximum velocity, pulmonary artery acceleration time, and slope). Figure 4 shows that using the top 10 out of the 158 input variables (Figure 3B) achieved 95.5% of the accuracy for predicting 5-year all-cause mortality.
FIGURE 4: Cumulative Predictive Performance of Top Ranked Variables in Predicting 5-year All-cause Mortality Using Random Forest.
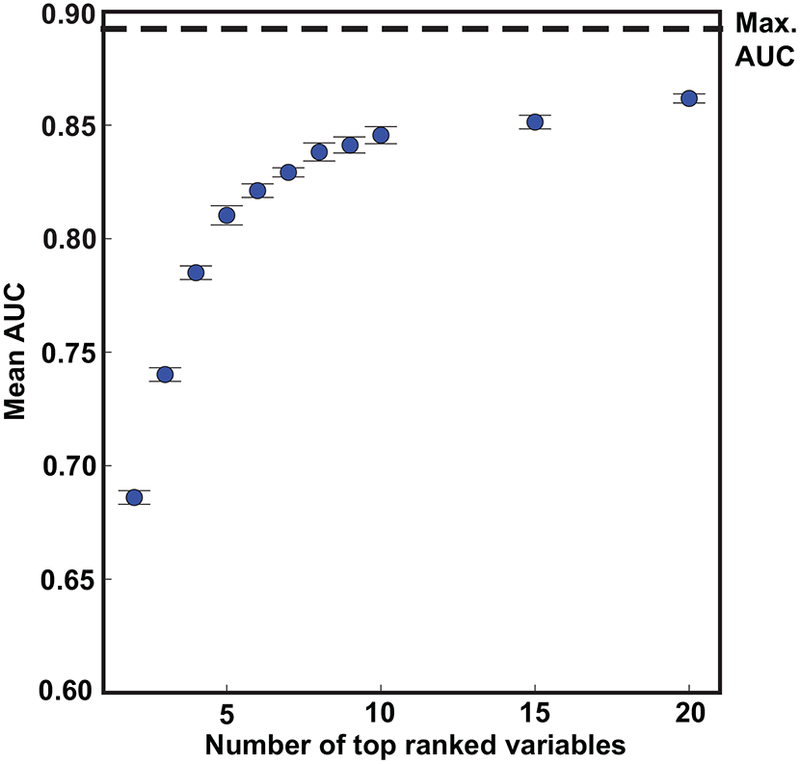
The maximum AUC (max. AUC) was achieved using all 158 variables.
DISCUSSION
To our knowledge, this is the first large scale study leveraging a machine learning framework to generate accurate outcome predictions based on “real world” clinical cardiology data. Clinicians, and cardiologists in particular, are becoming overwhelmed by the amount of data that is now being collected and documented about patients, particularly within clinical databases such as electronic health records (EHR) or imaging archives. Machine learning technology can assist physicians with digesting this large amount of information and will be critical to fully utilizing these growing datasets to help transform and optimize medical practice. While previous studies have supported this concept (3–5), we built on prior studies by using an order of magnitude larger sample size of clinically-acquired data linked to patient survival.
SUPERIORITY OF NON-LINEAR MODELS.
Similar to at least one prior study (14), our data show that nonlinear models are superior to traditional linear logistic regression for predicting survival from a broad range of EHR input variables. This is not surprising since non-linear models can learn complex discriminative patterns from large volumes of data without assuming linearity. However, at least two prior studies have shown contradicting results, reporting superior performance of logistic regression for predicting mortality after acute myocardial infarction (22) and in-hospital mortality of heart failure patients (23) when compared to regression trees. This discrepancy may be due to the fact that our random forest models were built on the ensemble of many decision trees (a variant of regression trees) to significantly boost the predictive performance by reducing overfitting.
IMPORTANCE OF FULLY UTILIZING ECHOCARDIOGRAPHIC MEASUREMENTS.
A broad array of echocardiographic measurements are clinically recorded in the EHR, yet the sheer number of these measurements makes it challenging for a physician to fully interpret these data within the context of the large amount of additional available clinical data. Traditional clinical practice has dealt with this, in part, by using various risk prediction scoring systems (9–12). However, all of these scoring systems are limited by the amount of clinically available measurements that are ignored, particularly imaging data. We showed that machine learning models have far superior accuracy to predict survival after echocardiography compared to these standard clinical approaches (Table 1), which is in line with previous studies (5,18,24). In the past, these clinical risk scoring systems were used out of simplicity, when the data were not readily available or easily automated as inputs into large models. However, with improved information technology systems and computational power available in healthcare, more complicated and accurate models, such as the one proposed in our study, can be implemented in many health systems and may soon be ubiquitous.
To our knowledge, our study is the first to show the relative value of echocardiography-derived measurements as inputs to machine learning models for predicting important clinical outcomes. Recently, Motwani et al. used 44 variables derived from coronary computed tomography angiography (CCTA) in a similar fashion to predict 5-year all-cause mortality (5) in 10,030 patients who had undergone CCTA prospectively. The authors obtained an AUC of 0.61 with FRS for predicting 5-year all-cause mortality, which is identical to our result. However, the highest mean AUC reported in the Motwani paper was 0.79 using both CCTA and clinical variables for predicting 5-year all-cause mortality (compared to 0.89 in our study). Previously, Hadamitzky et al. studied 2-year all-cause mortality prediction using clinical scores and a few CCTA variables and reported an AUC of 0.68 using a linear logistic regression model (24). Kennedy et al. studied the ability to predict 5-year cerebral and cardiovascular mortality using a dataset from 100,000 patients, but also failed to achieve a mean AUC over 0.80 (14).
Thus, our AUC of 0.89 for predicting 5-year mortality is superior to all reported prior studies in this area. This superior accuracy is possibly related to our large sample size, along with the improved performance achieved by utilizing measurements derived from echocardiography. This speculation is supported by the findings from our variable rank order importance analysis showing that 5 out of the top 10 most important variables were derived from echocardiography, with no clinical diagnostic codes in the top 10. Importantly, only the top 10 variables were required in order to achieve 95.5% of the maximum prediction accuracy.
One of our major findings is the relative importance of the tricuspid regurgitation jet maximum velocity over the physician-reported LVEF in predicting patient survival after echocardiography. Three other measures of pulmonary artery systolic pressure, the pulmonary artery acceleration time and slope, were also within the 10 most important variables for predicting survival. These high rankings suggest that measures of pulmonary systolic pressure derived from echocardiography may in fact be more important than previously recognized. Prior studies have shown that the degree of tricuspid regurgitation is associated with an increased risk of mortality independent of LVEF (25,26), particularly in patients with chronic heart failure (27). Moreover, recent evidence showing that monitoring pulmonary artery pressure continuously with implantable devices reduces morbidity and mortality in patients with heart failure lends further support to our findings (28).
STUDY LIMITATIONS
Like any other EHR-based study, there were missing values for different variables at varying levels below 90%. A previous study on data imputation found that having actual values, not surprisingly, yielded the best accuracy (29). We used a sophisticated 2-step imputation technique (time interpolation and MICE) to fill in the missing values with as much patient-specific data as available. The use of these imputation techniques thus represents an imperfect but pragmatic trade-off, enabling the analysis of such a large dataset. Note that the overall missingness of 22% is within the range of prior studies imputing 5%−50% missing data (29–31). Moreover, in agreement with previous literature (29), we showed in a subgroup analysis that imputation of missing data results in a slight under-estimation (AUC difference of 0.003) of the overall predictive ability of the fully complete dataset (Online Appendix).
Unfortunately, due to technical limitations of the XCelera database, e’ was not available in the majority of patients. However, assessment of e’ was accounted for by including the “diastolic function” variable which clinicians base in part on e’. New and potentially more predictive variables such as cardiac strains were also not available on a large scale in our system. Despite these limitations, our models achieved high accuracy. Future studies may be able to improve the prediction accuracy using deep learning. However, our preliminary work suggests that the random forest model has equivalent accuracy to deep neural networks in this setting.
This is a predictive study which showed how machine learning can help identify patients at highest risk for mortality and can also identify the most important factors related to this elevated risk. However, this work does not provide solutions for how to manage these patients clinically to ultimately reduce mortality. Future, prospective studies can study whether we can improve patient outcomes by using machine learning models to risk stratify patients and target higher levels of care to those at the highest risk.
CONCLUSIONS
Machine learning models can be used to predict survival after echocardiography with superior accuracy by using a large combination of clinical and echocardiography-derived input variables. The accuracy of machine learning models is superior to standard linear regression models and currently utilized clinical risk scoring systems such as the Framingham risk score. Importantly, only 10 variables were needed to achieve 96% of the maximum prediction accuracy, with 5 of these variables being derived from echocardiography. The models also suggest that the contribution of echocardiographic measurements of pulmonary pressure may be superior to LVEF for predicting survival after echocardiography.
PERSPECTIVES
Competency in Patient Care and Procedural Skills:
A machine learning pipeline can integrate vast amounts of clinically acquired electronic health records data, including echocardiographic data, to optimally predict survival with superior accuracy compared to standard clinical scoring systems and traditional linear regression models.
Translational Outlook:
The clinical adoption of validated machine learning models to predict outcomes may assist healthcare providers in recognizing at-risk patients and ultimately enable earlier, targeted interventions.
Supplementary Material
Acknowledgements:
None
Funding: This work was supported by a National Institutes of Health (NIH) Director’s Early Independence Award (DP5 OD-012132). The content is solely the responsibility of the authors and does not necessarily represent the official views of NIH.
Abbreviations and Acronyms
- AUC
area under the curve
- CCTA
coronary computed tomography angiography
- Echo
echocardiography
- EF
ejection fraction
- EHR
electronic health record
- FRS
Framingham risk score
- ICD-10
international classification of diseases version 10
- MICE
multivariate imputation by chained equations
- PA acc. time
pulmonary artery acceleration time
- TR max. vel.
tricuspid regurgitation maximum velocity
Footnotes
Publisher's Disclaimer: This is a PDF file of an unedited manuscript that has been accepted for publication. As a service to our customers we are providing this early version of the manuscript. The manuscript will undergo copyediting, typesetting, and review of the resulting proof before it is published in its final citable form. Please note that during the production process errors may be discovered which could affect the content, and all legal disclaimers that apply to the journal pertain.
Disclosures: None
References:
- 1.Andrus BW, Welch HG Medicare services provided by cardiologists in the united states: 1999–2008. Circ Cardiovasc Qual Outcomes 2012;5(1):31–6. Doi: 10.1161/CIRCOUTCOMES.111.961813. [DOI] [PubMed] [Google Scholar]
- 2.Shameer K, Johnson KW, Glicksberg BS, Dudley JT, Sengupta PP Machine learning in cardiovascular medicine: are we there yet? Heart 2018:heartjnl-2017–311198. Doi: 10.1136/heartjnl-2017-311198. [DOI] [PubMed] [Google Scholar]
- 3.Sengupta PP, Huang Y-M, Bansal M, et al. Cognitive Machine-Learning Algorithm for Cardiac Imaging. Circ Cardiovasc Imaging 2016;9(6):e004330. [DOI] [PMC free article] [PubMed] [Google Scholar]
- 4.Narula S, Shameer K, Salem Omar AM, Dudley JT, Sengupta PP Machine-Learning Algorithms to Automate Morphological and Functional Assessments in 2D Echocardiography. J Am Coll Cardiol 2016;68(21):2287–95. Doi: 10.1016/j.jacc.2016.08.062. [DOI] [PubMed] [Google Scholar]
- 5.Motwani M, Dey D, Berman DS, et al. Machine learning for prediction of all-cause mortality in patients with suspected coronary artery disease: a 5-year multicentre prospective registry analysis. Eur Heart J 2016;52(4):468–76. [DOI] [PMC free article] [PubMed] [Google Scholar]
- 6.Monsalve-Torra A, Ruiz-Fernandez D, Marin-Alonso O, et al. Using Machine Learning Methods for Predicting Inhospital Mortality in Patients Undergoing Open Repair of Abdominal Aortic Aneurysm. J Biomed Informatics 2016;62(C):195–201. [DOI] [PubMed] [Google Scholar]
- 7.Shah SJ, Katz DH, Selvaraj S, et al. Phenomapping for novel classification of heart failure with preserved ejection fraction. Circulation 2015;131(3):269–79. Doi: 10.1161/CIRCULATIONAHA.114.010637. [DOI] [PMC free article] [PubMed] [Google Scholar]
- 8.Lever J, Krzywinski M, Altman N Points of Significance: Model selection and overfitting. Nat Methods 2016;13(9):703–4. Doi: 10.1038/nmeth.3968. [DOI] [Google Scholar]
- 9.Goff DC, Lloyd-Jones DM, Bennett G, et al. 2013 ACC/AHA guideline on the assessment of cardiovascular risk: A report of the American college of cardiology/American heart association task force on practice guidelines. Circulation 2013;0:000–000. Doi: 10.1161/01.cir.0000437741.48606.98. [DOI] [PMC free article] [PubMed] [Google Scholar]
- 10.Charlson ME, Pompei P, Ales KL, MacKenzie CR A new method of classifying prognostic comorbidity in longitudinal studies: development and validation. J Chronic Dis 1987;40(5):373–83. Doi: 10.1016/0021-9681(87)90171-8. [DOI] [PubMed] [Google Scholar]
- 11.Levy WC, Mozaffarian D, Linker DT, et al. The Seattle Heart Failure Model: Prediction of survival in heart failure. Circulation 2006;113(11):1424–33. Doi: 10.1161/CIRCULATIONAHA.105.584102. [DOI] [PubMed] [Google Scholar]
- 12.Wilson PW, D’Agostino RB, Levy D, Belanger AM, Silbershatz H, Kannel WB Prediction of coronary heart disease using risk factor categories. Circulation 1998;97(18):1837–47. Doi: 10.1161/01.cir.97.18.1837. [DOI] [PubMed] [Google Scholar]
- 13.van Buuren S, Groothuis-Oudshoorn K mice : Multivariate Imputation by Chained Equations in R. J Stat Softw 2011;45(3). Doi: 10.18637/jss.v045.i03. [DOI] [Google Scholar]
- 14.Kennedy EH, Wiitala WL, Hayward RA, Sussman JB Improved cardiovascular risk prediction using nonparametric regression and electronic health record data. Med Care 2013;51(3):251–8. Doi: 10.1097/MLR.0b013e31827da594. [DOI] [PMC free article] [PubMed] [Google Scholar]
- 15.Varma S, Simon R Bias in error estimation when using cross-validation for model selection. BMC Bioinformatics 2006;7(1):91 Doi: 10.1186/1471-2105-7-91. [DOI] [PMC free article] [PubMed] [Google Scholar]
- 16.Pedregosa F, Varoquaux G Scikit-learn: Machine learning in Python. vol. 12 2011. [Google Scholar]
- 17.Demšar J Statistical Comparisons of Classifiers over Multiple Data Sets. J Mach Learn Res 2006;7:1–30. Doi: 10.1016/j.jecp.2010.03.005. [DOI] [Google Scholar]
- 18.Weng SF, Reps J, Kai J, Garibaldi JM, Qureshi N Can Machine-learning improve cardiovascular risk prediction using routine clinical data? PLoS One 2017;12(4). Doi: 10.1371/journal.pone.0174944. [DOI] [PMC free article] [PubMed] [Google Scholar]
- 19.Williams BA, Agarwal S Applying the Seattle Heart Failure Model in the Office Setting in the Era of Electronic Medical Records. Circ J 2018;82(3):724–31. Doi: 10.1253/circj.CJ-17-0670. [DOI] [PubMed] [Google Scholar]
- 20.Louppe G, Wehenkel L, Sutera A, Geurts P Understanding variable importances in forests of randomized trees. Adv Neural Inf Process Syst 26 2013:431–9. Doi: NIPS2013_4928. [Google Scholar]
- 21.Schemper M, Smith TL A note on quantifying follow-up in studies of failure time. Control Clin Trials 1996;17(4):343–6. Doi: 10.1016/0197-2456(96)00075-X. [DOI] [PubMed] [Google Scholar]
- 22.Austin PC A comparison of regression trees, logistic regression, generalized additive models, and multivariate adaptive regression splines for predicting AMI mortality. Stat Med 2007;26(15):2937–57. Doi: 10.1002/sim.2770. [DOI] [PubMed] [Google Scholar]
- 23.Austin PC, Tu JV, Lee DS Logistic regression had superior performance compared with regression trees for predicting in-hospital mortality in patients hospitalized with heart failure. J Clin Epidemiol 2010;63(10):1145–55. Doi: 10.1016/j.jclinepi.2009.12.004. [DOI] [PubMed] [Google Scholar]
- 24.Hadamitzky M, Achenbach S, Al-Mallah M, et al. Optimized prognostic score for coronary computed tomographic angiography: Results from the CONFIRM registry (COronary CT angiography evaluation for clinical outcomes: An international multicenter registry). J Am Coll Cardiol 2013;62(5):468–76. Doi: 10.1016/j.jacc.2013.04.064. [DOI] [PubMed] [Google Scholar]
- 25.Nath J, Foster E, Heidenreich PA Impact of tricuspid regurgitation on long-term survival. J Am Coll Cardiol 2004;43(3):405–9. Doi: 10.1016/j.jacc.2003.09.036. [DOI] [PubMed] [Google Scholar]
- 26.Sadeghpour A, Hassanzadeh M, Kyavar M, et al. Impact of severe tricuspid regurgitation on long term survival. Res Cardiovasc Med 2013;2(3):121–6. Doi: 10.5812/cardiovascmed.10686. [DOI] [PMC free article] [PubMed] [Google Scholar]
- 27.Hu K, Liu D, Störk S, et al. Echocardiographic Determinants of One-Year All-Cause Mortality in Patients With Chronic Heart Failure Complicated by Significant Functional Tricuspid Regurgitation. J Card Fail 2017;23(6):434–43. Doi: 10.1016/j.cardfail.2016.11.005. [DOI] [PubMed] [Google Scholar]
- 28.Givertz MM, Stevenson LW, Costanzo MR, et al. Pulmonary Artery Pressure-Guided Management of Patients With Heart Failure and Reduced Ejection Fraction. J Am Coll Cardiol 2017;70(15):1875–86. Doi: 10.1016/j.jacc.2017.08.010. [DOI] [PubMed] [Google Scholar]
- 29.Farhangfar A, Kurgan L, Dy J Impact of imputation of missing values on classification error for discrete data. Pattern Recognit 2008;41(12):3692–705. [Google Scholar]
- 30.Lakshminarayan K, Harp SA, Samad T Imputation of missing data in industrial databases. Appl Intell 1999;11(3):259–75. [Google Scholar]
- 31.Kurgan LA, KJ. Cios, Sontag MK, Accurso FJ Mining the Cystic Fibrosis Data 2005:415–44. [Google Scholar]
Associated Data
This section collects any data citations, data availability statements, or supplementary materials included in this article.


