Abstract
Background
Glioblastoma is a highly aggressive central nervous system neoplasm characterized by extensive infiltration of malignant cells into brain parenchyma, thus preventing complete tumor eradication. Cysteine cathepsins B, S, L and K are involved in cancer progression and are overexpressed in glioblastoma. We report here for the first time that cathepsin X mRNA and protein are also abundantly present in malignant glioma.
Materials and methods
Gene expression of cathepsins K and X was analyzed using publically-available tran-scriptomic datasets and correlated with glioma grade and glioblastoma subtype. Kaplan-Maier survival analysis was performed to evaluate the predictive value of cathepsin K and X mRNA expression. Cathepsin protein expression was localized and semi-quantified in tumor tissues by immunohistochemistry.
Results
Highest gene expression of cathepsins K and X was found in glioblastoma, in particular in the mesenchymal subtype. Overall, high mRNA expression of cathepsin X, but not that of cathepsin K, correlated with poor patients’ survival. Cathepsin K and X proteins were abundantly and heterogeneously expressed in glioblastoma tissue. Immuno-labeling of cathepsins K and X was observed in areas of CD133-positive glioblastoma stem cells, localized around arterioles in their niches that also expressed SDF-1α and CD68. mRNA levels of both cathepsins K and X correlated with mRNA levels of markers of glioblastoma stem cells and their niches.
Conclusions
The presence of both cathepsins in glioblastoma stem cell niche regions indicates their possible role in regulation of glioblastoma stem cell homing in their niches. The clinical relevance of this data needs to be elaborated in further prospective studies.
Key words: cathepsins, glioblastoma, immunohistochemistry, patient survival, cancer stem cell niches
Introduction
Glioblastoma (GBM, WHO grade IV) is the most aggressive and also most common primary brain tumor.1 Despite present treatment strategies, such as surgical removal, radiotherapy and chemotherapy, only 5% of GBM patients survive 5 years and mean patient survival after diagnosis is approximately 1.4 years.2 These poor survival rates are mainly due to infiltrating type of growth of GBM cells into surrounding brain parenchyma, and extensive tumor heterogeneity.3,4
The invasive spread of GBM cells is tightly associated with production and secretion of proteolytic enzymes5, including lysosomal cysteine cathepsins, belonging to the C1A family of papa-in-like proteases.6,7 The cysteine cathepsin family comprises of 11 proteases, sharing the same proteolytic mechanism, based on similar structural elements. However, these proteases have distinct conformations and catalytic activity (Figure S1) and are different with respect to their tissue and cellular distribution patterns and their physiological roles. Cathepsins play distinct roles in cancer progression, including invasion, the development of therapeutic resistance8 and apoptosis.9,10 Besides the hydrolysis of selective proteins, cysteine cathepsins participate in proteolytic cascades, where one protease activates one or several others in sequences that finally regulate hydrolysis of peptide and protein substrates, which is called protease signaling.10 For example, secreted cathepsins can be considered as initiators of extracellular matrix (ECM)-degrading cascades during cell invasion, by cleaving and activating serine proteases, and modifying the tumor microenvironment by cleaving ECM proteins, shedding cell-cell adhesion molecules and processing relevant cytokines and growth factors to enhance tumor progression.8,11,12 On the other hand, cathepsins may also possess tumor-suppressive roles13, depending on the cellular context, which emphasizes the importance of in vivo analysis to understand functions of cathepsins in GBM pathobiology.14 We have extensively investigated expression of cathepsins B, L an S at the mRNA and protein levels15,16 and found considerable differences in the correlation between expression of cathepsins B, L or S in specific end-points of GBM progression. For example, cathepsin B is involved in GBM cell invasion7, whereas the nuclear fraction of cathepsin L plays a role in apoptotic threshold regulation in GBM cells.9,10 Cathepsin S also contributes to GBM progression in vitro17, although its inhibition did not impair GBM cell invasion.7 Very little is known about the expression and the role of two other cathepsins, i.e cathepsins K and X, in GBM progression.
Cathepsin K has recently been identified as one of the most differentially-expressed proteases in GBM tissue and cell lines as compared to normal counterparts.18 Cathepsin K belongs to the cathepsin L-like cluster of the C1A family. Highly-positive charged basic residues in its structure allow allos-teric accommodation of negatively-charged resident glycosaminoglycans, enabling formation of complexes with unique collagenolytical activity, and unwinding of triple helical collagens19, thereby participating in ECM degradation, in particular in bone metastasis.20 Cathepsin K as a monomer also degrades growth factors and chemokines, such as stromal-derived factor 1α (SDF-1α)21,22, thereby indirectly affecting signaling pathways and migration.
The structure and activity of cathepsin X (also called cathepsin Z) show several unique features that distinguish it from other cysteine cathepsins.23 Cathepsin X exhibits solely carboxypeptidase activity and is activated by other lysosomal endo-peptidases. Cathepsin X expression seems to be restricted to cells of the immune system and it regulates their proliferation, maturation, migration, adhesion, phagocytosis and signal transduction.24 Various molecular targets of cathepsin X exopepti-dase activity have been identified, including the β-chain of integrin receptors, y-enolase, profilin-1, chemokine SDF-1α and others.23,24 Furthermore, cathepsin X has been detected in the brain where it is localized in neurons, glial cells and ependy-mal cells.23,25 Increased cathepsin X expression has been associated with various types of cancer, such as lung, colorectal and gastric cancers.26, 27, 28
Cathepsins have been reported to be involved in migration and self-renewal of tumor-initiating and therapy-resistant GBM stem cells (GSCs).29,30 GSC stemness and malignancy are maintained in specific microenvironments, so-called GSC niches, where these cells are protected from the immune system and therapy.4,31,32 The final goal of GSC niche targeting as a new anti-GBM approach is to disintegrate GSC niches to increase GBM therapeutic sensitivity.22 Since cathepsins are potent modifiers of the tumor microenvironment, we speculate that they may exert specific functions in GSC niches by modifying ECM and processing cytokines and growth factors.
The aim of this study was to explore expression patterns of cathepsins K and X in GBM tissue at the mRNA and protein level. At the transcriptome level, the data were obtained from publicly-available databases to determine if there is any association with survival of GBM patients. At the protein level, the immunohistochemistry was performed on serial sections of 21 human GBM samples, focusing on cathepsin localization in peri-arteriolar GSC niches. Moreover, we aimed to find correlations between gene expression of cathepsins K and X and GSC niche markers in GBM tissue samples.
Materials and methods
Expression of cathepsins K and X at the mRNA level and correlations with glioma stages and survival of glioma patients
Analysis of expression of cathepsin K and X mRNA in glioma tissue and its association with patient survival was performed using the publically-available GlioVis data portal.36,37 Briefly, two datasets (RNA-seq) were used, TCGA_LGGGBM (RNA-seq platform) to compare expression of cathepsins in glioma grades II-IV and TCGA_GBM (RNA-seq platform) for all the other analyses. Two hundred twenty-six (226) patients with grade II, 244 patients with grade III, 156 patients with GBM (grade IV) and 4 non-tumor patients were included in the query. All statistical analyses were performed in GlioVis data portal using pairwise comparisons between group levels with corrections for multiple testing (p-values with Bonferroni correction), and the log-rank test for Kaplan-Meier survival curve analysis. Correlation analyses (Pearson correlation coefficient, r) were performed between mRNA expression of cathepsins and the mRNA expression of GSC niche markers.
Patients and brain tumor samples
Paraffin-embedded tissue sections were obtained from biopsies of GBM patients, who were operated at the Department of Neurosurgery, University Clinical Centre of Ljubljana, Slovenia in the period 2013−2016. The study was approved by the National Medical Ethics Committee of the Republic of Slovenia (Approval No. 92/06/13). All procedures followed the Helsinki Declaration. Altogether, 21 patients with newly diagnosed glioblastoma (WHO grade IV) before radio and/or chemotherapy were included in this study. All patients gave informed consent to be included in the study. The histological diagnosis was established by standard protocols at the Institute of Pathology, Medical Faculty, University of Ljubljana. Diagnoses and tumor sample data are shown in Table S1.
Immunohistochemistry
Immunohistochemistry was performed on serial GBM paraffin sections. Five μm-thick sections of GBM biopsy samples were prepared according to routine procedures of the Institute of Pathology, University of Ljubljana. Paraffin sections were de-waxed in 100% xylene (3 min) and then rehydrated in 100%, 96%, 50% and 0% ethanol (in each ethanol dilution for 3 min). Heat-mediated antigen retrieval was achieved with sodium citrate buffer (pH 6.0). Blockage of endogenous peroxidase activity in the tissue was performed by incubation with 3% H2O2 in 100% methanol for 30 min at room temperature. To reduce non-specific background staining, sections were incubated with 10% goat or rabbit normal serum (Sigma) in phosphate-buffered saline containing 0.1% bovine serum albumin. After tapping off the serum-containing buffer, sections were incubated overnight at 4°C with primary antibodies: rabbit anti-SMA (1:200; Abcam, ab5694), mouse anti-CD133 (1:10; Miltenyi Biotec, W6B3C1), rabbit anti-SDF-1α (1:200; Abcam, ab9797), mouse anti-CD68 (1:50; Dako, EBM 11), rabbit anti-cathepsin K (1:200; Abcam, ab19027) and goat anti-cathepsin X (1:200; R&D Systems, AF934). This step was followed by incubation with the anti-mouse, anti-rabbit or anti-goat secondary horseradish peroxidase–conjugated antibodies (1:200; Dako) for 1 h. Protein expression was detected using DAB (Abcam) or AEC (Vector Laboratories) as peroxidase substrate, and hematoxylin was used for counterstaining. The negative-control staining was performed in the absence of primary antibodies (Figure S2). All sections were analyzed by light microscopy and images were taken using a Ti Eclipse inverted microscope (Nikon) and NIS elements software (Nikon). Expression of cathepsins is presented as percentage (%) of immunostained areas of tumor sections. Twenty visual fields per tumor section (20x magnification) in non-necrotic areas were quantified using ImageJ software (https:// imagej.nih.gov/ij/) and the Immunohistochemistry Image Analysis Toolbox.6,38,39
Statistical analyses
All statistical analyses were performed using R and GraphPad Prims 7. Overall survival of GBM patients was calculated from the date of surgery to the date of death or last follow-up. Survival analyses were estimated by Kaplan-Meier survival curves and these curves were compared with log-rank tests. A p value of < 0.05 was considered to indicate statistically significant differences.
Results
Expression of cathepsins K and X at the mRNA level is upregulated in glioblastoma as compared with low grade gliomas and normal brain tissue
Expression of cathepsins K and X in GBM was compared with expression in lower grade gliomas (WHO II and III), as well as with expression in normal brain tissue in publically-available transcrip-tomic datasets (The Cancer Genom Atlas –TCGA) using the GlioVis data portal.36,37 We found higher cathepsin mRNA expression in GBM (WHO grade IV) than in lower-grade gliomas (WHO grade II and III) (Figure 1A,D) and higher cathepsin K and X mRNA expression in GBM as compared to normal brain (Figure 1B,E). Furthermore, we observed overexpression of both cathepsins in the mesenchymal subtype (Figure 1C,F), which has been reported in the literature as being therapy-resistant and a more aggressive subtype of GBM.40 Expression of cathepsin K and X mRNA was lowest in the classical and the proneural GBM subtype (Figure 1C,F).
Figure 1.
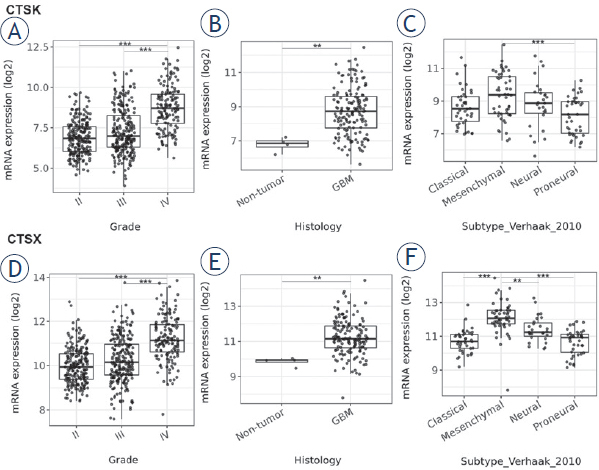
mRNA expression of cathepsins K and X in gliomas of different grades and GBM subtypes. Public transcriptomic datasets were used as described in Materials and methods. Higher cathepsin K and X mRNA expression was found in GBM (grade IV glioma) versus grade II and III glioma (A, D), in GBM versus normal brain (B, E), and in the mesenchymal subtype of GBM versus the classical, proneural and neural subtypes, as classified according to Verhaak et al.39 (C, F). Boxplots show the distribution of mRNA expression (log2) in glioma grade II and III and GBM. Data were retrieved from GlioVis portal.37 The significance was set at p < 0.01 (**), p < 0.001 (***).
Inter- and intratumoral heterogeneity of cathepsin K and X protein expression in GBM tissues
To determine protein expression of cathepsins K and X in GBM, we performed semi-quantitative immunohistochemistry on serial sections of 21 paraffin-embedded GBM samples. We observed that the expression of cathepsin X in GBM tissue was higher (38.0% of immunostained areas), as compared to that of cathepsin K (11.6% of immunostained areas) (Figure 2A). Protein expression of both cathepsins was heterogeneous across tumors as well as within the same tumor (Figure 2B-G). Cathepsin K and X proteins were detected in cancer cells and stromal cells of the tumor microenvironment (Figure 2B-G).
Figure 2.
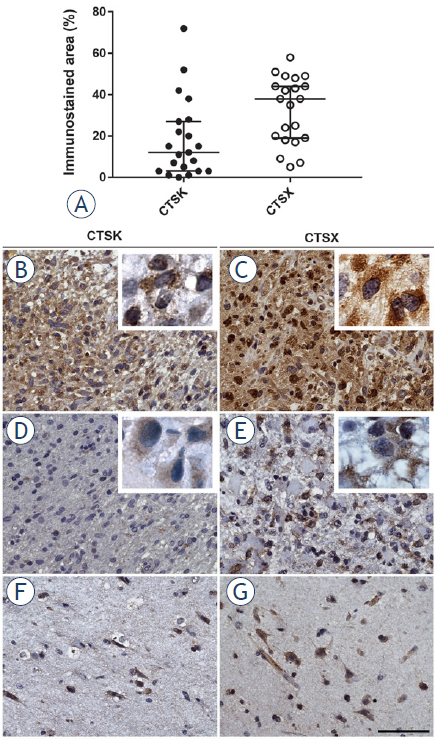
Immunohistochemical staining of cathepsins K and X in serial paraffin-embedded GBM sections. The expression of cathepsins K and X in 21 GBM samples, quantified as percentage (%) of immunostained areas and box plots show the distribution of cathepsin expression in GBMs (A). Heterogeneous imunohistochemical staining was found in different parts of GBM samples for cathepsin K (B, D) and for cathepsin X (C, E). Inserts present high magnification images of GBM cells containing cathepsin K and X protein. Cathepsin K (F) and cathepsin X (G) expression was present in specific cells in normal brain tissue of GBM patients. These cells were not further identified. Immunohistochemical labelling of cathepsins was performed with DAB as substrate (brown color). Cell nuclei were stained using hematoxylin (blue/purple). Scale bar = 50 μm.
Predictive value of mRNA expression of cathepsins K and X is GBM-subtype dependent
In order to evaluate the predictive value of expression of cathepsins K and X at the mRNA level in GBM, we performed Kaplan-Maier survival analysis, using public GBM cDNA microarray datasets. Cathepsin K mRNA expression did not correlate with survival of all GBM patients (Figure 3A). When the GBMs were stratified into different GBM subtypes according to Verhaak et al41, again no correlation of cathepsin K mRNA expression and patient survival was found (data not shown). In contrast, significant differences in survival were found in GBMs with different cathepsin X mRNA levels. Kaplan-Meier estimates of median patient survival was 11.8 months for high cathepsin X tumors and 14.9 months for low cathepsin X tumors (log-rank p = 0.027) (Figure 3B). This correlation was dependent on the GBM subtype, as high mRNA levels of cathepsin X correlated only with the shorter survival of GBM patients of the classical subtype (median survival being 10.8 months for cathepsin X high-expressing tumors and 15.8 months for cath-epsin X low-expressing tumors, log-rank p = 0.049). In mesenchymal and proneural GBM subtypes, the cathepsin X mRNA expression did not have predictive value for patient survival (Figure 3C).
Figure 3.
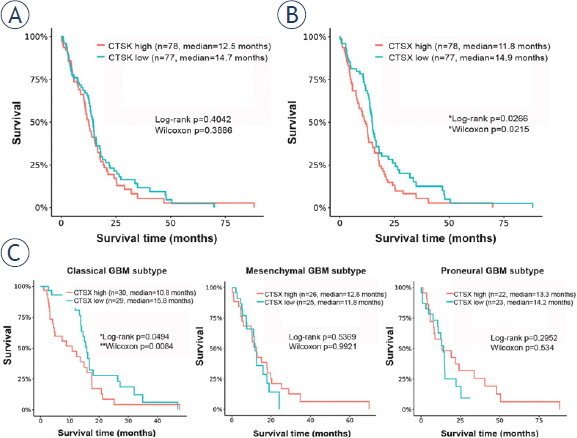
Kaplan-Meier survival curves of overall survival in relation to cathepsin K and X mRNA expression. Cathepsin K mRNA expression did not correlate with survival of all GBM patients (A), whereas patients with tumors expressing high cathepsin X mRNA levels exhibited poorer survival than patients with low cathepsin X mRNA expression (B) When we stratified GBMs in the different subtypes, cathepsin X mRNA expression had predictive value in the classical GBM subtype only (p = 0.049 by log-rank and p = 0.0084 by Wilcoxons’ test) (C). Data for the Kaplan-Maier survival curves were obtained from GlioVis data portal.36,37 GBM tumors were stratified into two groups, tumors with high and with low cathepsin K or X mRNA expression, using median values as cutoff.
Cathepsins K and X in peri-arteriolar GSC niches
Cathepsins K and X were not only present in GBM cells (Figure 2), but also in stromal cells, such as endothelial cells of the tumor vasculature (Figure 4). Furthermore, the expression of both cathepsins was found in special regions of GBM tumors adjacent to the tunica adventitia of arterioles, in peri-arteriolar GSC niches, as identified by immunohistochemical localization of CD133/Prominin1 as the most-widely used GSC marker, α-smooth muscle actin (SMA) as smooth muscle cell marker, and SDF-1α/ CXCL12, which have been shown to be present in GSC niches (Figure 4).22,34,35 Briefly, CD133 is localized on GSC plasma membranes42, SMA is specifically localized in smooth muscle cells in the tunica media of arteriolar and venular walls34,35, whereas SDF-1α, a chemotactic cytokine, is produced by endothelial cells and is involved in angiogenesis43 and in the retention of GSCs within their niches adjacent to the tunica adventitia of arterioles.22,44 We also show here that macrophages and/or microglia cells were present in the regions of GSC niches
Figure 4.
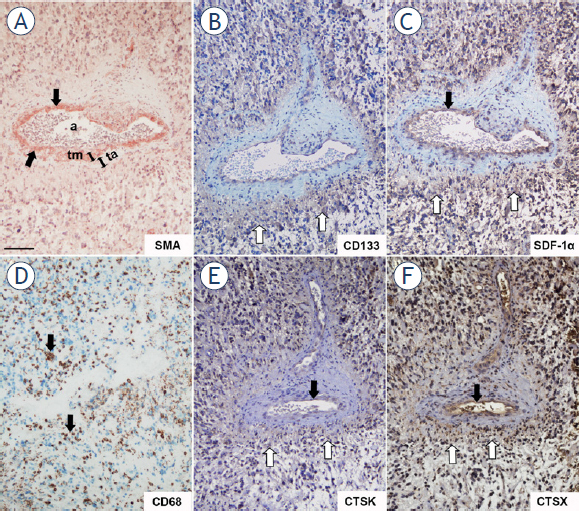
Serial GBM sections immunohistochemically stained for peri-arteriolar GSC niche markers and cathepsins K and X. SMA-positive smooth muscle cells were present in the tunica media of the arteriolar wall as indicated by black arrows (A) CD133- and SDF-1α-positive cells (B, C) were present in the cellular layers adjacent to the tunica adventitia of the arteriole. CD68-positive macrophages and microglia were found in peri-arteriolar regions as indicated by black arrows (D) Cathepsins K (E) and X (F) were expressed in a CD133-, SDF-1α- and CD68-positive areas around the arteriole and their expression overlapped that of CD133-positive cells as indicated by white arrows (B, E, F). Cathepsins and SDF-1α were present in the endothelial cells of arterioles as indicated by black arrows (C, E, F). Immunohistochemical labelling of SMA (A) was performed with AEC as substrate (red color) and of the other proteins (B-F) with DAB as substrate (brown color). Cell nuclei were stained using hematoxylin (blue/ purple). a, lumen of arteriole; ta, tunica adventitia; tm, tunica media. Scale bar = 100 μm. A B C D
Cathepsins K and X were localized in CD133-, SDF-1α- an CD68-positive regions around arterioles, defined by the tunica media containing SMA-positive smooth muscle cells (Figure 4). Cathepsins were present in astrocyte-like cells and endothelial cells (Figure 4) as well as extracellularly (Figure 5) in regions of GSC niches adjacent to the tunica adventitia of arterioles (Figure 5). Overlap of CD133, cathepsin K and cathepsin X immunostaining in GSC niches was observed (Figure 4B,E,F). Higher magnification images of CD133, SDF-1α, cathepsin K and X staining are shown in Figure 5. Taken together, GSC marker CD133, cytokine SDF-1α and macrophage marker CD68 are localized around arterioles where cathepsins K and X are also present.
Figure 5.
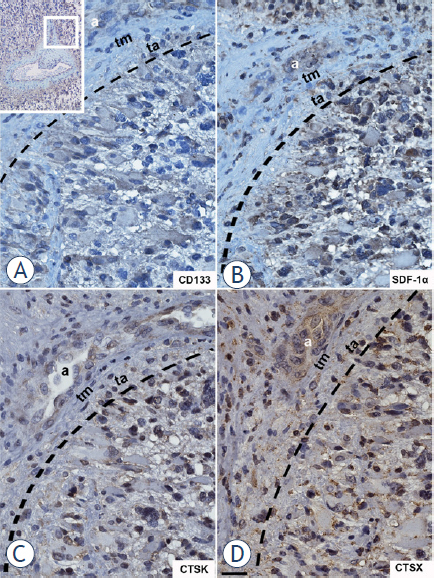
High-magnification images of serial GBM sections labelled for CD133, SDF-1α and cathepsins K and X. The region around the arteriole as shown in upper left corner of the Figure was magnified. CD133- (A), SDF-1α- (B), cathepsin K- (C) and cathepsin X- (D) positive cells were adjacent to the tunica adventitia of the arteriole. Immunohistochemical labelling of proteins was performed with DAB as substrate (brown color). Cell nuclei were stained using hematoxylin (blue/purple). a, lumen of arteriole; ta, tunica adventitia; tm, tunica media. The interrupted black line indicates the outer border of the tunica adventitia. Scale bar = 20 μm. around arterioles using the macrophage and microglia marker CD68 (Figure 4A-D).
Correlation between gene expression of cathepsin K and X, selected GSC markers and peri-arteriolar GSC niche markers
The statistical correlation between gene expression levels of cathepsins K and X and gene expression levels of GSC markers and peri-arteriolar GSC niche markers was determined using public microarray datasets as describe in Materials and methods.36,37 We analyzed gene expression of GSC markers CD133/PROM1 and SOX2, endothelial cell marker CD31/PECAM1, α-smooth muscle actin SMA/ACTA2, chemotactic cytokine SDF-1α/ CXCL12 and its receptor CXCR4 and macrophage/ microglia markers CD68 and Iba1/AIF1. Cathepsin K mRNA expression correlated negatively with GSC marker SOX2 (Pearson’s r = -0.38, *** p < 0.001) and positively with several GSC niche markers: PECAM1 (Pearson’s r = 0.40, *** p < 0.001), ACTA2 (Pearson’s r = 0.23, *** p < 0.001), CXCL12 (Pearson’s r = 0.35, ** p < 0.01), CXCR4 (Pearson’s r = 0.23, *** p < 0.001), CD68 (Pearson’s r = 0.22, *** p < 0.001) and AIF1 (Pearson’s r = 0.29, *** p < 0.001) (Figure 6). On the other hand, cathepsin X negatively correlated with GSC markers PROM1 (Pearson’s r = -0.18, * p < 0.05) and SOX2 (Pearson’s r = -0.23, *** p < 0.001). A strong positive correlation was observed between cathepsin X gene expression and the endothelial cell markers PECAM1 (Pearson’s r = 0.49, *** p < 0.001) and ACTA2 (Pearson’s r = 0.45, *** p < 0.001), CXCL12 (Pearson’s r = 0.45, *** p < 0.001) and CXCR4 (Pearson’s r = 0.46, *** p < 0.001). The strongest positive correlation was found for cathepsin X and the macrophage and microglia marker CD68 (Pearson’s r = 0.80, *** p < 0.001) and AIF1 (Pearson’s r = 0.65, *** p < 0.001) (Figure 7). Taken together, gene expression of cathepsins K and X negatively correlated with gene expression of GSC markers and positively correlated with several markers of GSC niches. The positive correlation between gene expression of cathepsin X and GSC niche markers was much stronger than that of cathepsin K and GSC niche markers.
Figure 6.
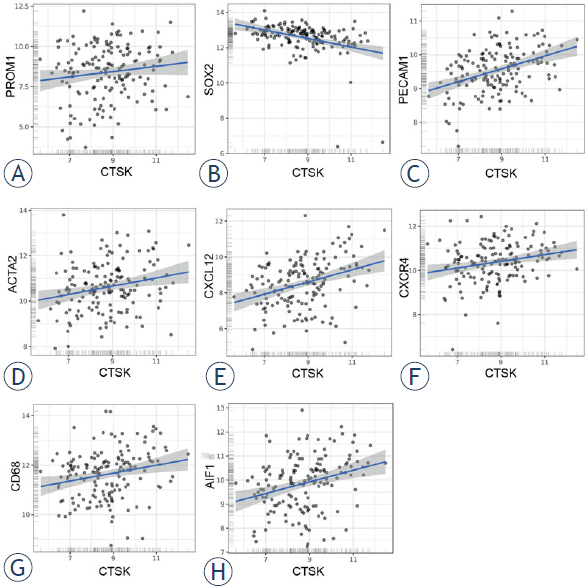
Correlation of microarray-based gene expression levels of cathepsin K and GSC niche markers. Cathepsin K did not correlate with GSC marker CD133/ PROM1 (A), but negatively correlated with GSC marker SOX2 (B) and positively correlated with GSC niche markers CD31/PECAM1 (C), α-smooth muscle actin SMA/ ACTA2 (D), chemotactic cytokine SDF-1α/CXCL12 (E) and its receptor CXCR4 (F), as well as with macrophage/microglia markers CD68 (G) and Iba1/AIF1 (H). Trend lines indicate linear regression estimates. Log2-transformed mRNA expression data were obtained via GlioVis portal.
Figure 7.
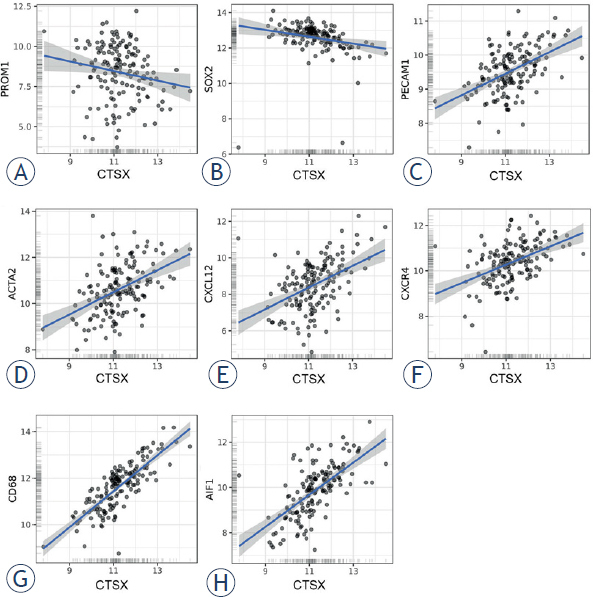
Correlation of microarray-based gene expression levels of cathepsin X and GSC niche markers. Cathepsin X negatively correlated with GSC markers CD133/PROM1 (A) and SOX2 (B) and positively correlated with GSC niche markers CD31/PECAM1 (C), α-smooth muscle actin SMA/ACTA2 (D), chemotactic cytokine SDF-1α/CXCL12 (E) and its receptor CXCR4 (F), as well as with macrophage/microglia markers CD68 (G) and Iba1/AIF1 (H). Trend lines indicate linear regression estimates. Log2-transformed mRNA expression data were obtained via GlioVis portal.
Discussion
Despite intensive research and the introduction of multimodal therapy with surgery, irradiation and chemotherapy, GBM patients survival has not significantly increased.45 A better understanding of GBM pathobiology and the discovery of cancer biomarkers with predictive value are thus crucial for the improvement of GBM treatment. Such markers may become targets for personalized therapy. In the search for new biomarkers, “omics” analyses, followed by molecular validation is the usual approach. Immunohistochemistry is the most common type of analysis in oncology, due to its relative simplicity in the assessment of biomarkers for diagnosis, prognosis and prediction of responses to therapy. Therefore, we attempted to assess the predictive value of two potential protease biomarkers, cysteine cathepsins K and X. The selection of these cathepsins was based on the fact that a related protease cathepsin B has been consistently found to be predictive at the mRNA and protein level in various types of cancer, including gliomas and GBM.6,46 High cathepsin B expression in the endothelial cells correlated with low survival rate of glioma patients and enables the identificaton of patients at higher risk in order to follow these patients more carefully or treat them more aggressively. Although cathepsin B is involved in cancer cell and endothelial cell migration and invasion15, it is unlikely candidate as selective treatment target because it is widely distributed in normal cells.
The high cathepsin K expression as was found in the present study confirmed our previous findings on cathepsin K mRNA upregulation in GBM cells and tissues as compared to their normal counterparts.18 However, we did not find any association of cathepsin K mRNA expression with survival of GBM patients, as was shown for various other types of cancers, such as lung carcinoma and squamous cell carcinoma.19 Similar results have been reported for the cysteine cathepsin L by Strojnik and co-workers47, showing high cathepsin L expression in astrocytomas and GBM, but these high levels were not predictive. We have also shown that cathepsin K is expressed in normal brain cells as has been reported for all brain regions of wild type mice48 where it has been associated with neurobe-havioral disorders such as schizophrenia.49 At the protein level, cathepsin K was detected in vesicles of neuronal and non-neuronal cells throughout the mouse brain and its deficiency was associated with a marked decrease in differentiated astrocytes, indicating a possible role of cathepsin K in stem cell differentiation.
Cathepsin X has been linked to cancer progression as its upregulation has been found in several types of cancer.23,28 Previously, high cathepsin X levels in serum and cancer tissues of patients with colorectal cancer and hepatocellular carcinoma, respectively, have been associated with shorter overall survival.28,50 In present study, we confirmed the same trend for cathepsin X mRNA levels in 156 GBM patients. When GBM were stratified according to subtype41, high cathepsin X expression in classical GBM subtype showed predictive potential for poor survival.
Cathepsin X promotes tumor processes by enhancing epithelial-to-mesenchymal transition (EMT) and by cleaving integrin receptors and profilin 1.23,51,52 Moreover, invasion-promoting functions of cancer cell- and stromal cell-derived cathepsin X are mediated via RGD motifs in the protease prodomain, that binds to integrins and the ECM.53 This is the first observation that cathepsin X gene expression is significantly higher in GBM than in lower-grade gliomas and in normal brain, which is in line with studies in other types of cancer, such as hepatocellular carcinoma and melanoma, revealing the correlation between cathepsin X overexpression in cancer tissue and advanced tumor stages.50 In addition to the presence of cathepsin X in cancer cells in GBM tissues, its high levels were detected in endothelial cells of the tumor vasculature as well, which implies the involvement of cathepsin X in GBM angiogenesis, as has been found for cathepsin B.46 Interestingly, highest cathepsin X expression was observed in the mesenchymal subtype of GBM, which represents the most aggressive and therapy-resistant GBM subtype.40,41
As already mentioned, GBM is heterogeneous at the molecular and cellular levels. Cathepsin K and X expression exhibited high inter- and intratumoral heterogeneity, which may be explained by differential infiltration rates of stromal cells, such as macrophages, endothelial cells, fibroblasts and lymphocytes that are also important sources of proteases.11 In addition, GBM subtypes may significantly differ in their microenvironment, for example, the mesenchymal GBM subtype exhibits a higher immune cell infiltration than all other subtypes.41,54 At present, the only organized multicellular structures where cathepsins K and X have been found to be clustered, are the peri-arterioral regions that function as GSC niches.22,33, 34, 35 In these niches, GSCs are surrounded predominantly by endothelial cells, pericytes, smooth muscle cells, fibroblasts and macrophages.4,55 In particular, cross-talk between endothelial cells and cancer cells is crucial for GSC propagation within the niches.55,56 Furthermore, the chemotactic cytokine SDF-1α and its receptors CXCR4 and CXCR7 are important for the retention and maintenance of GSCs in their niches as well as for their radiotherapy resistance.44,57 We localized cathepsin K and X in peri-arteriolar regions, positive for GSC marker CD133, smooth muscle cell marker SMA, SDF-1α and macrophage marker CD68. Thus, we confirmed our previous observations that cathepsin K is present in GSC niche regions and proposed that it is involved in GSC trafficking in/out of niches by proteolytic processing and inactivation of SDF-1α.22 Interestingly, we found an inverse correlation between cathepsin K and X mRNA expression and mRNA expression of GSC markers CD133 and SOX2 in GBM tissues. This is in line with our previous data58, showing an inverse correlation between CD133 mRNA levels and mRNA levels and activity of cathepsins B, L and S in isolated primary CD133-positive versus CD133-negative GBM cells. On the other hand, a positive correlation was found between the expression of cathepsins K and X and that of other GSC niche markers. Based on these results and the fact that cathepsin K cleavage of SDF-1α inhibits its chemotactic activity towards CXCR4-positive GSCs, we speculate that cathepsins K and X may both enhance GSC migration out of their niches. This is a similar scenario that was reported by Kollet et al59 for the mobilization of hematopoietic progenitor cells from bone marrow niches.
In conclusion, our data support the concept that cathepsins K and X are associated with glioma progression, as both are progressively upregulated from low grade to high grade glioma GBM, as we demonstrated by their significantly increased mRNA expression. High expression of cathepsin X on the mRNA level had predictive value for the survival of GBM patients. Furthermore, we have shown that cathepsin K and X proteins clustered in regions of peri-arteriolar GSC niches, and their mRNA expression levels correlated with expression of niche markers, implying a role of these two cathepsins in maintaining/trafficking of GSCs in or out of niches. The results of this study have to be confirmed in a further prospective study.
Acknowledgements
This work was supported by the Slovenian Research Agency (ARRS), Program P1-0245 (TTL) and ARRS young researcher grant (BB), and the European Program of Cross-Border Cooperation for Slovenia-Italy Interreg TRANS-GLIOMA.
Disclosure
No potential conflicts of interest were disclosed.
Author's contribution
All authors revised the manuscript and approved the final version of the manuscript. Specifically, BB designed the study, performed experiments, analyzed and interpreted the data and wrote the manuscript; CL provided GBM sections and optimized the immunohistochemical experiments; MKK performed experiments and analyzed the data; AB contributed to statistical analyses and interpretation of the data; AP, JK, RB provided GBM samples/patients data/sections/antibodies, analyzed and interpreted the data; TTL and CJFVN conceived and designed the study, analyzed and interpreted the data and wrote the final version of the manuscript.
Supplementary Material.
References
- 1.Louis DN, Perry A, Reifenberger G, von Deimling A, Figarella-Branger D, Cavenee WK. The 2016 World Health Organization classification of tumors of the central nervous system: a summary. Acta Neuropathol. 2016;131:803. doi: 10.1007/s00401-016-1545-1. et al. –. [DOI] [PubMed] [Google Scholar]
- 2.Czarnek N, Clark K, Peters KB, Mazurowski MA. Algorithmic three-dimensional analysis of tumor shape in MRI improves prognosis of survival in glioblastoma: a multi-institutional study. J Neurooncol. 2017;132:55. doi: 10.1007/s11060-016-2359-7. –. [DOI] [PubMed] [Google Scholar]
- 3.Cuddapah VA, Robel S, Watkins S, Sontheimer H. A neurocentric perspective on glioma invasion. Nat Rev Neurosci. 2014;15:455. doi: 10.1038/nrn3765. –. [DOI] [PMC free article] [PubMed] [Google Scholar]
- 4.Roos A, Ding Z, Loftus JC, Tran NL. Molecular and microenvironmental determinants of glioma stem-like cell survival and invasion. Front Oncol. 2017;7:120. doi: 10.3389/fonc.2017.00120. [DOI] [PMC free article] [PubMed] [Google Scholar]
- 5.Mentlein R, Hattermann K, Held-Feindt J. Lost in disruption: role of proteases in glioma invasion and progression. Biochim Biophys Acta. 2012;1825:178. doi: 10.1016/j.bbcan.2011.12.001. –. [DOI] [PubMed] [Google Scholar]
- 6.Colin C, Voutsinos-Porche B, Nanni I, Fina F, Metellus P, Intagliata D. High expression of cathepsin B and plasminogen activator inhibitor type-1 are strong predictors of survival in glioblastomas. Acta Neuropathol. 2009;118:745. doi: 10.1007/s00401-009-0592-2. et al. –. [DOI] [PubMed] [Google Scholar]
- 7.Gole B, Huszthy PC, Popović M, Jeruc J, Ardebili YS, Bjerkvig R. The regulation of cysteine cathepsins and cystatins in human gliomas. Int J Cancer. 2012;131:1779. doi: 10.1002/ijc.27453. et al. –. [DOI] [PubMed] [Google Scholar]
- 8.Olson OC, Joyce JA. Cysteine cathepsin proteases: regulators of cancer progression and therapeutic response. Nat Rev Cancer. 2015;15:712. doi: 10.1038/nrc4027. –. [DOI] [PubMed] [Google Scholar]
- 9.Kenig S, Frangež R, Pucer A, Lah T. Inhibition of cathepsin L lowers the apoptotic threshold of glioblastoma cells by up-regulating p53 and transcription of caspases 3 and 7. Apoptosis. 2011;16:671. doi: 10.1007/s10495-011-0600-6. –. [DOI] [PubMed] [Google Scholar]
- 10.Lankelma JM, Voorend DM, Barwari T, Koetsveld J, Van der Spek AH, De Porto AP. Cathepsin L, target in cancer treatment? Life Sci. 2010;86:225. doi: 10.1016/j.lfs.2009.11.016. et al. –. [DOI] [PubMed] [Google Scholar]
- 11.Breznik B, Motaln H, Turnšek TL. Proteases and cytokines as mediators of interactions between cancer and stromal cells in tumours. Biol Chem. 2017;398:709. doi: 10.1515/hsz-2016-0283. –. [DOI] [PubMed] [Google Scholar]
- 12.Kramer L, Turk D, Turk B. The future of cysteine cathepsins in disease management. Trends Pharmacol Sci. 2017;38:873. doi: 10.1016/j.tips.2017.06.003. –. [DOI] [PubMed] [Google Scholar]
- 13.López-Otín C, Matrisian LM. Emerging roles of proteases in tumour suppression. Nat Rev Cancer. 2007;7:800. doi: 10.1038/nrc2228. –. [DOI] [PubMed] [Google Scholar]
- 14.Quail DF, Joyce JA. The microenvironmental landscape of brain tumors. Cancer Cell. 2017;31:326. doi: 10.1016/j.ccell.2017.02.009. –. [DOI] [PMC free article] [PubMed] [Google Scholar]
- 15.Lah TT, Duran Alonso MB, Van Noorden CF. Antiprotease therapy in cancer: hot or not? Expert Opin Biol Ther. 2006;6:257. doi: 10.1517/14712598.6.3.257. –. [DOI] [PubMed] [Google Scholar]
- 16.Lah TT, Obermajer N, Duran Alonso MB, Kos J. Edwards D, Hoyer-Hansen G, Blasi F, Sloane BF, editors. The cancer degradome: proteases and cancer biology. New York: Springer; 2008. Cysteine cathepsins and cystatins as cancer biomarkers; pp. 575–613. –. [Google Scholar]
- 17.Flannery T, McQuaid S, McGoohan C, McConnell RS, McGregor G, Mirakhur M. Cathepsin S expression: an independent prognostic factor in glioblastoma tumours - a pilot study. Int J Cancer. 2006;119:854. doi: 10.1002/ijc.21911. et al. –. [DOI] [PubMed] [Google Scholar]
- 18.Verbovšek U, Motaln H, Rotter A, Atai NA, Gruden K, Van Noorden CJ. Expression analysis of all protease genes reveals cathepsin K to be overexpressed in glioblastoma PLoS One. 2014;9:e111819. doi: 10.1371/journal.pone.0111819. et al. [DOI] [PMC free article] [PubMed] [Google Scholar]
- 19.Verbovšek U, Van Noorden CJ, Lah TT. Complexity of cancer protease biology: cathepsin K expression and function in cancer progression. Semin Cancer Biol. 2015;35:71. doi: 10.1016/j.semcancer.2015.08.010. –. [DOI] [PubMed] [Google Scholar]
- 20.Novinec M, Lenarčič B. Cathepsin K: a unique collagenolytic cysteine peptidase. Biol Chem. 2013;394:1163. doi: 10.1515/hsz-2013-0134. –. [DOI] [PubMed] [Google Scholar]
- 21.Staudt ND, Maurer A, Spring B, Kalbacher H, Aicher WK, Klein G. Processing of CXCL12 by different osteoblast-secreted cathepsins. Stem Cells Dev. 2012;21:1924. doi: 10.1089/scd.2011.0307. –. [DOI] [PMC free article] [PubMed] [Google Scholar]
- 22.Hira VV, Verbovšek U, Breznik B, Srdič M, Novinec M, Kakar H. Cathepsin K cleavage of SDF-1α inhibits its chemotactic activity towards glioblastoma stem-like cells. Biochim Biophys Acta. 2017;1864:594. doi: 10.1016/j.bbamcr.2016.12.021. et al. –. [DOI] [PubMed] [Google Scholar]
- 23.Kos J, Vižin T, Fonović UP, Pišlar A. Intracellular signaling by cathepsin X: molecular mechanisms and diagnostic and therapeutic opportunities in cancer. Semin Cancer Biol. 2015;31:76. doi: 10.1016/j.semcancer.2014.05.001. –. [DOI] [PubMed] [Google Scholar]
- 24.Kos J, Jevnikar Z, Obermajer N. The role of cathepsin X in cell signaling. Cell Adh Migr. 2009;3:164. doi: 10.4161/cam.3.2.7403. –. [DOI] [PMC free article] [PubMed] [Google Scholar]
- 25.Wendt W, Zhu XR, Lübbert H, Stichel CC. Differential expression of cathepsin X in aging and pathological central nervous system of mice. Exp Neurol. 2007;204:525. doi: 10.1016/j.expneurol.2007.01.007. –. [DOI] [PubMed] [Google Scholar]
- 26.Nägler DK, Krüger S, Kellner A, Ziomek E, Menard R, Buhtz P. Up-regulation of cathepsin X in prostate cancer and prostatic intraepithelial neoplasia. Prostate. 2004;60:109. doi: 10.1002/pros.20046. et al. –. [DOI] [PubMed] [Google Scholar]
- 27.Krueger S, Kalinski T, Hundertmark T, Wex T, Küster D, Peitz U. Up-regulation of cathepsin X in Helicobacter pylori gastritis and gastric cancer. J Pathol. 2005;207:32. doi: 10.1002/path.1820. et al. –. [DOI] [PubMed] [Google Scholar]
- 28.Vizin T, Christensen IJ, Nielsen HJ, Kos J. Cathepsin X in serum from patients with colorectal cancer: relation to prognosis. Radiol Oncol. 2012;46:207. doi: 10.2478/v10019-012-0040-0. –. [DOI] [PMC free article] [PubMed] [Google Scholar]
- 29.Gopinath S, Malla R, Alapati K, Gorantla B, Gujrati M, Dinh DH. Cathepsin B and uPAR regulate self-renewal of glioma-initiating cells through GLI-regulated Sox2 and Bmi1 expression. Carcinogenesis. 2013;34:550. doi: 10.1093/carcin/bgs375. et al. –. [DOI] [PMC free article] [PubMed] [Google Scholar]
- 30.Alapati K, Kesanakurti D, Rao JS, Dasari VR. uPAR and cathepsin B-mediated compartmentalization of JNK regulates the migration of glioma-initiating cells. Stem Cell Res. 2014;12:716. doi: 10.1016/j.scr.2014.02.008. –. [DOI] [PMC free article] [PubMed] [Google Scholar]
- 31.Lathia JD, Mack SC, Mulkearns-Hubert EE, Valentim CL, Rich JN. Cancer stem cells in glioblastoma. Genes Dev. 2015;29:1203. doi: 10.1101/gad.261982.115. –. [DOI] [PMC free article] [PubMed] [Google Scholar]
- 32.Godlewski J, Ferrer-Luna R, Rooj AK, Mineo M, Ricklefs F, Takeda YS. MicroRNA Signatures and molecular subtypes of glioblastoma: the role of extracellular transfer. Stem Cell Reports. 2017;8:1497. doi: 10.1016/j.stemcr.2017.04.024. et al. –. [DOI] [PMC free article] [PubMed] [Google Scholar]
- 33.Hira VV, Ploegmakers KJ, Grevers F, Verbovšek U, Silvestre-Roig C, Aronica E. CD133+ and nestin+ glioma stem-like cells reside around CD31+ arterioles in niches that express SDF-1α, CXCR4, osteopontin and cathepsin K. J Histochem Cytochem. 2015;63:481. doi: 10.1369/0022155415581689. et al. –. [DOI] [PubMed] [Google Scholar]
- 34.Hira VVV, Aderetti DA, van Noorden CJF. Glioma stem cell niches in human glioblastoma are periarteriolar. J Histochem Cytochem. 2018;66:349. doi: 10.1369/0022155417752676. –. [DOI] [PMC free article] [PubMed] [Google Scholar]
- 35.Hira VVV, Wormer JR, Kakar H, Breznik B, van der Swaan B, Hulsbos R. Periarteriolar glioblastoma stem cell niches express bone marrow hematopoietic stem cell niche proteins. J Histochem Cytochem. 2018;66:155. doi: 10.1369/0022155417749174. et al. –. [DOI] [PMC free article] [PubMed] [Google Scholar]
- 36.GlioVis: Data visualization tools for brain tumor datasets. 2017. http://gliovis.bioinfo.cnio.es/ [citated 20 Sep 2017]. Available from.
- 37.Bowman RL, Wang Q, Carro A, Verhaak RG, Squatrito M. GlioVis data portal for visualization and analysis of brain tumor expression datasets. Neuro Oncol. 2017;19:139. doi: 10.1093/neuonc/now247. –. [DOI] [PMC free article] [PubMed] [Google Scholar]
- 38.Završnik J, Butinar M, Trstenjak Prebanda M, Krajnc A, Vidmar R, Fonović M. Cystatin C deficiency suppresses tumor growth in a breast cancer model through decreased proliferation of tumor cells. Oncotarget. 2017;8:73793. doi: 10.18632/oncotarget.17379. et al. –. [DOI] [PMC free article] [PubMed] [Google Scholar]
- 39.Chieco P, Jonker A, De Boer BA, Ruijter JM, Van Noorden CJ. Image cytometry: protocols for 2D and 3D quantification in microscopic images. Prog Histochem Cytochem. 2013;47:211. doi: 10.1016/j.proghi.2012.09.001. –. [DOI] [PubMed] [Google Scholar]
- 40.Segerman A, Niklasson M, Haglund C, Bergström T, Jarvius M, Xie Y. Clonal variation in drug and radiation response among glioma-initiating cells is linked to proneural-mesenchymal transition. Cell Rep. 2016;17:29943009. doi: 10.1016/j.celrep.2016.11.056. et al. [DOI] [PubMed] [Google Scholar]
- 41.Verhaak RG, Hoadley KA, Purdom E, Wang V, Qi Y, Wilkerson MD. Cancer Genome Atlas Research Network. Integrated genomic analysis identifies clinically relevant subtypes of glioblastoma characterized by abnormalities in PDGFRA, IDH1, EGFR, and NF1. Cancer Cell. 2010;17:98. doi: 10.1016/j.ccr.2009.12.020. et al. –. [DOI] [PMC free article] [PubMed] [Google Scholar]
- 42.Zeppernick F, Ahmadi R, Campos B, Dictus C, Helmke BM, Becker N. Stem cell marker CD133 affects clinical outcome in glioma patients. Clin Cancer Res. 2008;14:123. doi: 10.1158/1078-0432.CCR-07-0932. et al. –. [DOI] [PubMed] [Google Scholar]
- 43.Kenig S, Alonso MB, Mueller MM, Lah TT. Glioblastoma and endothelial cells cross-talk, mediated by SDF-1, enhances tumour invasion and endothelial proliferation by increasing expression of cathepsins B, S, and MMP-9. Cancer Lett. 2010;289:53. doi: 10.1016/j.canlet.2009.07.014. –. [DOI] [PubMed] [Google Scholar]
- 44.Plaks V, Kong N, Werb Z. The cancer stem cell niche: how essential is the niche in regulating stemness of tumor cells? Cell Stem Cell. 2015;16:225. doi: 10.1016/j.stem.2015.02.015. –. [DOI] [PMC free article] [PubMed] [Google Scholar]
- 45.Saito K, Hirai T, Takeshima H, Kadota Y, Yamashita S, Ivanova A, Yokogami K. Genetic factors affecting intraoperative 5-aminolevulinic acid-induced fluorescence of diffuse gliomas. Radiol Oncol. 2017;51:142. doi: 10.1515/raon-2017-0019. –. [DOI] [PMC free article] [PubMed] [Google Scholar]
- 46.Strojnik T, Kos J, Zidanik B, Golouh R, Lah T. Cathepsin B immunohistochemical staining in tumor and endothelial cells is a new prognostic factor for survival in patients with brain tumors. Clin Cancer Res. 1999;5:559. –. [PubMed] [Google Scholar]
- 47.Strojnik T, Kavalar R, Trinkaus M, Lah TT. Cathepsin L in glioma progression: comparison with cathepsin B. Cancer Detect Prev. 2005;29:448. doi: 10.1016/j.cdp.2005.07.006. –. [DOI] [PubMed] [Google Scholar]
- 48.Dauth S, Schmidt MM, Rehders M, Dietz F, Kelm S, Dringen R. Characterisation and metabolism of astroglia-rich primary cultures from cathepsin K-deficient mice. Biol Chem. 2012;393:959. doi: 10.1515/hsz-2012-0145. et al. –. [DOI] [PubMed] [Google Scholar]
- 49.Dauth S, Sîrbulescu RF, Jordans S, Rehders M, Avena L, Oswald J. Cathepsin K deficiency in mice induces structural and metabolic changes in the central nervous system that are associated with learning and memory deficits. BMC Neurosci. 2011;12:74. doi: 10.1186/1471-2202-12-74. et al. [DOI] [PMC free article] [PubMed] [Google Scholar]
- 50.Wang J, Chen L, Li Y, Guan XY. Overexpression of cathepsin Z contributes to tumor metastasis by inducing epithelial-mesenchymal transition in hepatocellular carcinoma. PLoS One. 2011;6:e24967. doi: 10.1371/journal.pone.0024967. [DOI] [PMC free article] [PubMed] [Google Scholar]
- 51.Sevenich L, Schurigt U, Sachse K, Gajda M, Werner F, Müller S. Synergistic antitumor effects of combined cathepsin B and cathepsin Z deficiencies on breast cancer progression and metastasis in mice. Proc Natl Acad Sci US A. 2010;107:2497. doi: 10.1073/pnas.0907240107. et al. –. [DOI] [PMC free article] [PubMed] [Google Scholar]
- 52.Mitrović A, Pečar Fonović U, Kos J. Cysteine cathepsins B and X promote epithelial-mesenchymal transition of tumor cells. Eur J Cell Biol. 2017;96:622. doi: 10.1016/j.ejcb.2017.04.003. –. [DOI] [PubMed] [Google Scholar]
- 53.Akkari L, Gocheva V, Kester JC, Hunter KE, Quick ML, Sevenich L. Distinct functions of macrophage-derived and cancer cell-derived cathepsin Z combine to promote tumor malignancy via interactions with the extracellular matrix. Genes Dev. 2014;28:2134. doi: 10.1101/gad.249599.114. et al. –. [DOI] [PMC free article] [PubMed] [Google Scholar]
- 54.Euskirchen P, Radke J, Schmidt MS, Schulze Heuling E, Kadikowski E, Maricos M. Cellular heterogeneity contributes to subtype-specific expression of ZEB1 in human glioblastoma. PLoS One. 2017;12:e0185376. doi: 10.1371/journal.pone.0185376. et al. [DOI] [PMC free article] [PubMed] [Google Scholar]
- 55.Calabrese C, Poppleton H, Kocak M, Hogg TL, Fuller C, Hamner B. A perivascular niche for brain tumor stem cells. Cancer Cell. 2007;11:69. doi: 10.1016/j.ccr.2006.11.020. et al. –. [DOI] [PubMed] [Google Scholar]
- 56.Zhu TS, Costello MA, Talsma CE, Flack CG, Crowley JG, Hamm LL. Endothelial cells create a stem cell niche in glioblastoma by providing NOTCH ligands that nurture self-renewal of cancer stem-like cells. Cancer Res. 2011;71:6061. doi: 10.1158/0008-5472.CAN-10-4269. et al. –. [DOI] [PMC free article] [PubMed] [Google Scholar]
- 57.Goffart N, Lombard A, Lallemand F, Kroonen J, Nassen J, Di Valentin E. CXCL12 mediates glioblastoma resistance to radiotherapy in the subventricular zone. Neuro Oncol. 2017;19:66. doi: 10.1093/neuonc/now136. et al. –. [DOI] [PMC free article] [PubMed] [Google Scholar]
- 58.Ardebili SY, Zajc I, Gole B, Campos B, Herold-Mende C, Drmota S. CD133/prominin1 is prognostic for GBM patient’s survival, but inversely correlated with cysteine cathepsins’ expression in glioblastoma derived spheroids. Radiol Oncol. 2011;45:102. doi: 10.2478/v10019-011-0015-6. et al. –. [DOI] [PMC free article] [PubMed] [Google Scholar]
- 59.Kollet O, Dar A, Shivtiel S, Kalinkovich A, Lapid K, Sztainberg Y. Osteoclasts degrade endosteal components and promote mobilization of hematopoietic progenitor cells. Nat Med. 2006;12:657. doi: 10.1038/nm1417. et al. –. [DOI] [PubMed] [Google Scholar]
- 60. https://www.ebi.ac.uk/merops/index.shtml. MEROPS database: The peptidase database. [15 Dec 2017]. Citated.
Associated Data
This section collects any data citations, data availability statements, or supplementary materials included in this article.


