Abstract
Purpose.
Acidification of extracellular space promotes tumor development, progression and invasiveness. pH (Low) Insertion Peptides (pHLIP® peptides) belong to the class of pH-sensitive membrane peptides, which target acidic tumors and deliver imaging and/or therapeutic agents to cancer cells within tumors.
Procedures.
Ex vivo fluorescent imaging of tissue and organs collected at various time points after administration of different pHLIP® variants conjugated with fluorescent dyes of various polarity was performed. Methods of multivariate statistical analyses were employed to establish classification between fluorescently-labeled pHLIP® variants in multidimensional space of spectral parameters.
Results.
The fluorescently-labeled pHLIP® variants were classified based on their biodistribution profile and ability of targeting of primary tumors. Also, sub-millimeter sized metastatic lesions in lungs were identified by ex vivo imaging after intravenous administration of fluorescent pHLIP® peptide.
Conclusions.
Different cargo molecules conjugated with pHLIP® peptides can alter biodistribution and tumor targeting. The obtained knowledge is essential for the design of novel pHLIP® based diagnostic and therapeutic agents targeting primary tumors and metastatic lesions.
Keywords: Imaging, tumor acidity, fluorescent-guided surgery, targeting of submillimeter metastatic lesions
INTRODUCTION
A common specific feature of tumor microenvironment is a hypoxia and an extracellular acidosis [1]. The aggressive and invasive cancer cells are well adapted to grow at low extracellular pH [1–2]. The development of cancer is promoted by an acidic environment because acidic cancer cells have a biological advantage in these conditions as opposed to normal cells [1–3]. Thus, targeting of tumor acidity might be developed as an important predictive clinical marker of tumor aggressiveness and invasiveness, and could be used in design of therapeutic agents. However, the bulk extracellular pH in tumors is just 0.5–0.8 pH units lower than the extracellular pH in healthy tissue [4]. But, the pH at cell surfaces is lower than the bulk extracellular pH [5]. A sharp proton concentration gradient exists near the surface of cancer cells, since protons are extensively pumped from the cytoplasm to the extracellular space, and membrane proteins, carbonic anhydrases, enhance extracellular acidity by hydrating cell-generated CO2 into HCO3− and H+ at cancer cell membranes [1]. As a result, an “acidic crown” is formed around cancer cells. The pH increases with distance from the membrane, and becomes normal in the vicinity of blood vessels [6]. Thus, the best approach is to target acidity in close proximity to cancer cells in tumors.
We have introduced family of pH Low Insertion Peptides (pHLIP® peptides), which represents a unique class of water-soluble membrane polypeptides capable to undergo a pH-dependent membrane-associated folding [7–8]. pHLIP® peptides possess dual delivery capabilities, making use of the energy of folding to translocate polar cargo molecules across phospholipid bilayer of membrane and/or tether molecules to the surface of cancer cells [9]. The process of peptide folding within a membrane ensures a high cooperativity of the transition, which cannot be achieved by simple diffusion [10–12]. Since pHLIP® peptides have affinity to cellular membranes at normal pH they are capable of sensing pH at the cell surface. As soon as pH drops (even on a half of pH unit), the Asp and Glu residues are protonated enhancing affinity of the peptides to membrane, which triggers folding in membrane and formation of transmembrane helix accompanied with the release of energy [13–14]. Depending on pHLIP® sequence, protonatable residues could be differently located on membrane surface, which directly affects the rate of the protonation events at various pHs, and thus pK of peptides insertion into the membrane [10–12]. We have introduced family of pHLIP® peptides with pK of insertion varying from 4.5 to 6.5 [10]. The targeting of primary tumors by pHLIP® peptides and delivery imaging and therapeutic agents has been demonstrated on more than 10 varieties of human and murine tumors [15–17], including lymphoma [18], pancreatic [19], breast [20–21] and prostate [22] transgenic mouse models and human head/neck biopsy samples [23–24]. It was confirmed that tumor targeting by pHLIP® peptides is indeed pH-dependent and could be modulated by bicarbonate and glucose, which affects tumor acidity [15, 20–21, 25–26]. Three pHLIP® variants, WT, Var3 and Va7 were selected as lead candidates for pH-specific delivery of imaging and therapeutic agents to tumors of different origins [10, 16, 19–21].
This work is a continuation of our previous studies, which is designed for the comparison of tumor targeting and biodistribution of lead pHLIP® sequences conjugated with cargoes, fluorescent dyes, of different polarity.
MATERIALS AND METHODS
Conjugation of pHLIP® peptides with fluorescent dyes
pHLIP® variants were prepared by solid-phase peptide synthesis using Fmoc (9-fluorenylmethyloxycarbonyl) chemistry and purified by reverse phase chromatography by CS Bio Co. pHLIP® variants were conjugated with maleimide derivatives of Alexa Fluor® 546 (AF546), Alexa Fluor® 647 (AF647), Alexa Fluor® 750 (AF750) (Molecular Probes), Cy5.5 (Cy5.5) (GE Healthcare Life Sciences), DyLight 680 (Dy680), DyLight 680 4xPEG-conjugate (DyP680) (Thermo Scientific) and IRDye® 680RD (IR680), IRDye® 800CW (IR800) (Li-Cor Biosciences) in DMF (dimethylformamide) at a ratio of 1:1 and incubated at room temperature for about 8 hours and then at 4ºC until the conjugation was completed. The reaction progress and purity was monitored by reverse phase HPLC to ensure absence of free dyes in the final solution. The products were lyophilized and characterized by SELDI-TOF mass spectrometry. The concentration of conjugates was determined by absorbance using the following molar extinction coefficients: ε556=104,000 M−1·cm−1 (for AF546-pHLIPs), ε650=239,000 M−1·cm−1 (for AF647-pHLIPs), ε753=290,000 M−1·cm−1 (for AF750-pHLIPs), ε673=209,000 M−1·cm−1 (for Cy5.5-pHLIPs), ε672=165,000 M−1·cm−1 (for IR680-pHLIPs), ε778=300,000 M−1·cm−1 (for IR800-pHLIPs), ε684=140,000 M−1·cm−1 (for Dy680-pHLIPs) and ε684=180,000 M−1·cm−1 (for DyP680-pHLIPs).
Absorbance and fluorescence measurements
Absorbance and fluorescence measurements were carried out on a Genesys 10S UV-Vis (Thermo Scientific) spectrophotometer and a SpectraMax M2 (Molecular Devices) spectrofluorometer, respectively. The excitation wavelengths were the following for different conjugates: 550 nm for AF546-pHLIPs; 650 nm for AF647-pHLIPs, 673 nm for Cy5.5-pHLIPs; 680 nm for IR680-pHLIPs, Dy680-pHLIPs and DyP680-pHLIPs; 750 nm for AF750-pHLIPs and 780 nm for IR800-pHLIPs.
Cell lines
The 4T1 and 4T1-GFP mouse mammary tumor cell lines were obtained from the American Type Culture Collection and cultured in RPMI medium supplemented with 10% fetal bovine serum, 10 μg/mL of ciprofloxacin in a humidified atmosphere of 5% CO2 and 95% air at 37°C.
Tumor mouse models
Mammary tumors were established by subcutaneous injection of 4T1 cells (8×10⁵ cells/0.1 ml/flank) in the right flank of adult female BALB/c mice (about 20 g weight) obtained from Harlan Laboratories. For the metastatic tumor model, 106 4T1-GFP cells/50 μl were injected subcutaneously in the mammary fat pad. After approximately 3 weeks, the primary tumor metastasized in the lungs.
All animal studies were conducted according to the animal protocol AN04–12-011 approved by the Institutional Animal Care and Use Committee at the University of Rhode Island, in compliance with the principles and procedures outlined by NIH for the Care and Use of Animals.
Fluorescent imaging of organs and tissue
When tumors reached approximately 5–6 mm in diameter tail vein injections of 100 μL of 40 μM of the fluorescent pHLIP® peptides were performed. Animals were euthanized at 2, 4, 24 and 48 hours post-injection, and necropsy was performed immediately after euthanization. The Supplementary Table S1 contains information about the number of animals used for each fluorescently-labeled pHLIP® variant for each time point (the number of animals was 3 and more in each case). Tumors and major organs of BALB/c mice were collected for imaging on a FX Kodak in-vivo image station. Fluorescence intensity was obtained via analysis of images by using Kodak software. The contrast index (CI) was calculated according to the equation:
where Ftumor, Fmuscle and Fbackg are the mean fluorescence intensities of tumor, muscle and background signal of the same organ from untreated mice, respectively.
Fluorescent images of metastatic lesions in lungs were acquired at 4 and 10x magnification using an Olympus IX71 inverted fluorescence microscope.
Multivariate Statistical Analysis
Statistical agglomerative hierarchical clustering algorithm was applied to the database of 24 objects comprising from 3 different pHLIP® variants (WT, Var3, and Var7) conjugated with 8 fluorescent dyes, namely AF546, AF647, AF750, Cy5.5, IR680, IR800, Dy680 and DyP680 spectral parameters of which were measured at time points of 2 and 4 hours. The normalized fluorescent parameters measured in tumor (NFT – normalized fluorescence in tumor), muscle (NFM – normalized fluorescence in muscle), kidney (NFK – normalized fluorescence in kidney), liver (NFL – normalized fluorescence in liver) and averaged over a number of mice tested per experiment were used in the analysis. The Euclidean metric was employed to compute distances and Ward’s minimum within-cluster variance criterion was applied as an amalgamation (linkage) rule. The results are presented in a form of hierarchical tree or dendrogram with height scaled to the percentage for convenience of interpretation. The calculations were performed using the hclust function in R.
Multivariate linear regression analysis was applied on a combined (not averaged) response of four fluorescent variables represented by NFT, NFM, NFL and NFK, and three categorical predictors represented by Time (2, 4 and 24 hours), Dye (8 various fluorescent dyes), and pHLIP® variants (Var3, Var7, and WT). The maximum-likelihood method was used to estimate a matrix of regression coefficients, which in the multivariate linear model is equivalent to equation-by-equation least squares estimation for the individual responses. Commonly employed multivariate analysis of variance (MANOVA) procedures such as Pillai-Bartlett Trace, Hotelling-Lawley Trace, and Wilks’s Lambda [27] were used to take into account correlation between four fluorescent variables and to check overall statistical significance of three categorical predictors. The calculations were performed using the lm and manova functions in R.
RESULTS
We performed comparative study of targeting of mammary tumors by three fluorescently-labeled pHLIP® variants recently selected for further pre-clinical development [8, 10, 19]:
WT: ACEQNPIYWARYADWLFTTPLLLLDLALLVDADEGT
Var3: ACDDQNPWRAYLDLLFPTDTLLLDLLW
Var7: ACEEQNPWARYLEWLFPTETLLLEL
Each peptide has a single Cys residue at the N-terminus for conjugation with cargo, fluorescent dye. We selected fluorophores Alexa Fluor® 546 (AF546), Alexa Fluor® 647 (AF647), Alexa Fluor® 750 (AF750), Cy5.5 (Cy5.5), DyLight 680 (Dy680), DyLight 680 4xPEG-conjugate (DyP680), IRDye® 680RD (IR680) and IRDye® 800CW (IR800) which emit in visible and near-infrared spectral range (Supplementary Information Figure S1). The selected fluorophores have similar molecular weights, but different hydrophobicity reflected by differences in HPLC retention times shown in Table 1.
Table 1.
Spectral properties (position of maximum of excitation, λex, and emission, λem), molecular weights and HPLC retention times of the fluorescent pHLIP® variants are shown.
| Spectral Properties | ||||||||
| AF546 | AF647 | AF750 | Cy5.5 | IR680 | IR800 | Dy680 | DyP680 | |
| λex, nm | 556 | 650 | 753 | 630/673 | 672 | 778 | 680 | 680 |
| λem, nm | 572 | 670 | 778 | 720 | 702 | 797 | 707 | 707 |
| Molecular Weights | ||||||||
| WT | 5146 | 5362 | 5462 | 4853 | 5140 | 5303 | 5084 | 5866 |
| Var3 | 4256 | 4472 | 4572 | 3963 | 4250 | 4413 | 4194 | 4976 |
| Var7 | 4100 | 4316 | 4416 | 3807 | 4094 | 4257 | 4038 | 4820 |
| Var3-C | 4313 | - | - | 4020 | - | - | - | - |
| HPLC Retention Times | ||||||||
| WT | 29.2 | 24.8 | 25.3 | 29.4 | 25.5 | 25.0 | 26.2 | 24.9 |
| Var3 | 27.6 | 23.3 | 23.6 | 28.4 | 24.3 | 23.4 | 25.0 | 23.7 |
| Var7 | 25.7 | 21.6 | 22.0 | 26.9 | 22.8 | 21.6 | 23.9 | 22.0 |
| Var3-C | 27.5 | - | - | 29.8 | - | - | - | - |
With the selected fluorescent dye, AF750, we also investigated performance of the following pHLIP® sequences, where the N-terminal end of the peptides contains six negatively-charged Asp residues for the enhancement of peptide solubility:
Var3M: ACDDDDDDPWQAYLDLLFPTDTLLLDLLW
Var7M: ACDDDDDDPWQAYLDLFPTDTLALDLW
In addition, we investigated biodistribution of the conjugates, where AF546 and Cy5.5 fluorescent dyes are attached to the single Cys residue at the membrane-inserting C-terminal end of the Var3 pHLIP® peptide (Var3-C: ADDQNPWRAYLDLLFPTDTLLLDLLCW) to access ability of Var3 to move cargo across lipid bilayer of membrane and compare fluorescent signals from the dye transferred to the cytoplasm and the dye, which stays in the extracellular space.
To test tumor targeting by the fluorescent pHLIP® peptides we selected the highly tumorigenic and invasive 4T1 mammary carcinoma model, which mimics stage IV of human breast cancer [28–30], and is known to be acidic [31] and targeted very well by pHLIP® peptides [20]. The fluorescent pHLIP® peptides were administrated intravenously and at different time points ranging from 2 to 48 hours, animals were euthanized, tumor, kidney, liver and muscle were collected and imaged immediately. The images were processed to calculate values of the mean surface fluorescence for each fluorescent pHLIP® variant at each time point presented in Supplementary Table 1 together with the number of animals used in each case.
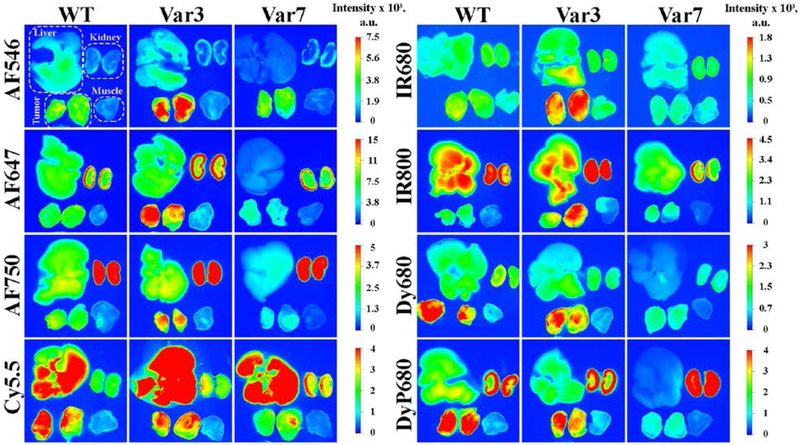
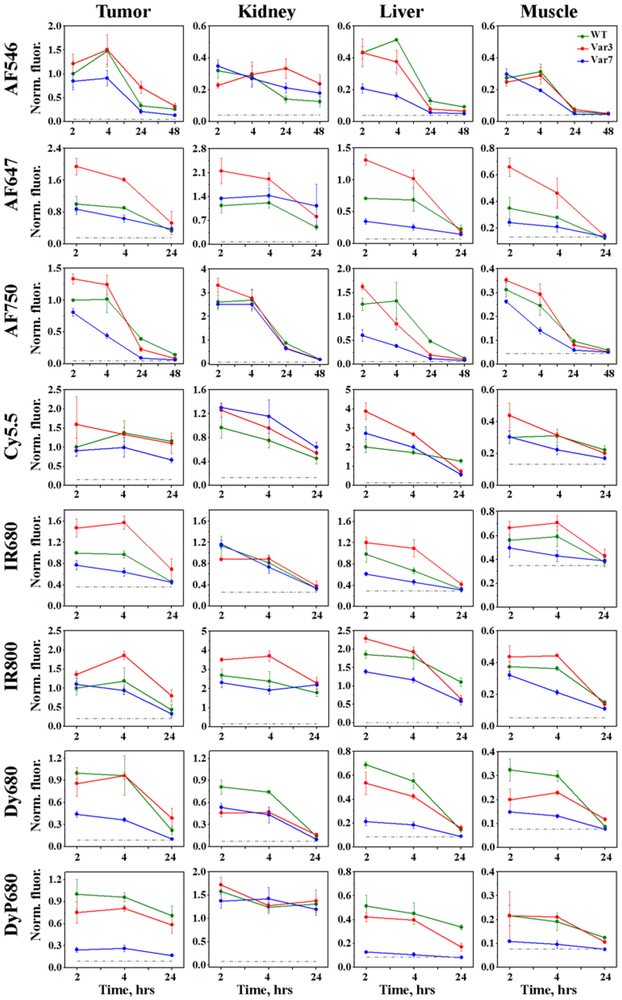
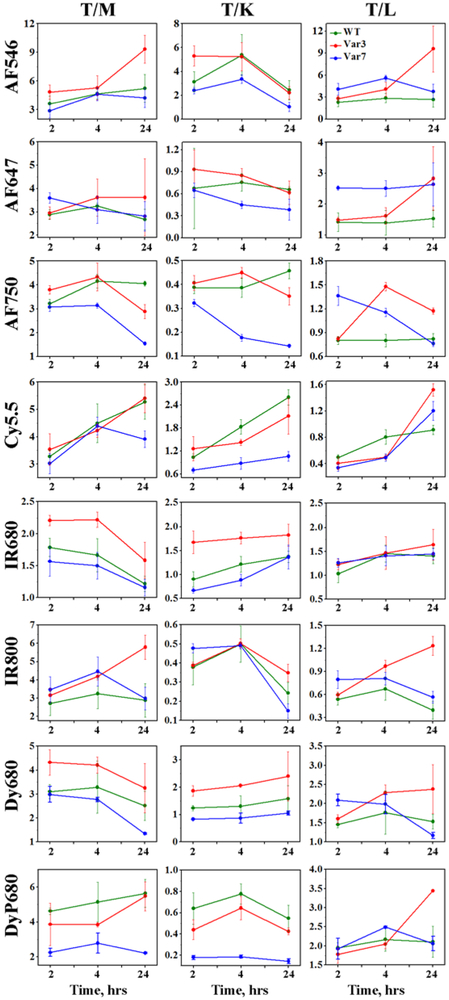
Different fluorescent pHLIP® peptides demonstrate slightly different kinetic profiles (Figure 1). The highest tumor targeting is observed at 2 or 4 hours post-injection with subsequent decay of the signal. The representative fluorescent images of tissue and organs obtained at 4 hours after the conjugates administration are shown on Figure 2. Significant tumor targeting was observed by all fluorescent pHLIP® peptides. Majority of fluorescent pHLIP® peptides have low liver accumulation except of Cy5.5-pHLIPs, which are the most hydrophobic among the investigated fluorescent pHLIP® variants. AF546 pHLIP® peptides showed very low liver, kidney and muscle accumulation with the highest tumor targeting. Tumor to muscle ratio for AF546-Var3 is found to be increasing from ~ 5 to 9 within 24 hrs (see Figure 3 and Supplementary Table S2). The pHLIP® peptides conjugated with AF647, AF750 and IR800 dyes exhibit higher signal in kidney compared to AF546-labeled pHLIP® variants. We also investigated performance of Dy680 and its pegylated version, DyP680. The DyP680 pHLIP® variants are more polar compared to Dy680 pHLIP® peptides. The most noticeable difference was observed in targeting of the kidney: DyP680 pHLIP® peptides demonstrate about twice higher accumulation in the kidney compared to the Dy680 pHLIP® peptides, which could be related to the renal clearance. In overall, the contrast index was enhanced for the pegylated versions of the conjugates compared to the non-pegylated counterparts.
Figure 1. Time-dependent distribution of the fluorescent pHLIP® peptides in 4T1 mammary tumors, kidney, liver and muscle quantified by the ex-vivo surface fluorescence.
The mean values of the normalized fluorescence and St.d. calculated for each fluorescent pHLIP® variant (WT – green, Var3 – red, Var7 – blue) at each time point are presented. Normalization was performed to the intensity in tumor of the corresponding fluorescent WT pHLIP® peptide at 2 hours p.i.. The numerical values of the non-normalized fluorescent intensities and number of animals used for each fluorescent pHLIP® variant at different time points are given in the Supplementary Table 1.
Figure 2. Distribution of the fluorescent pHLIP® peptides in 4T1 mammary tumors (cut in half), muscle, kidney and liver.
The representative fluorescent images of tissue and organs were obtained at 4 hrs post-injection after single i.v. administration of WT, Var3 and Var7 peptides conjugated with different fluorescent dyes.
Figure 3. Tumor to organ ratios calculated for 2, 4 and 24 hrs time points p.i..
The mean values of tumor to organ ratios and St.d. calculated for each fluorescent pHLIP® variant (WT – green, Var3 – red, Var7 – blue) at each time point are presented. The numerical values of tumor to organ ratios are given in the Supplementary Table 2.
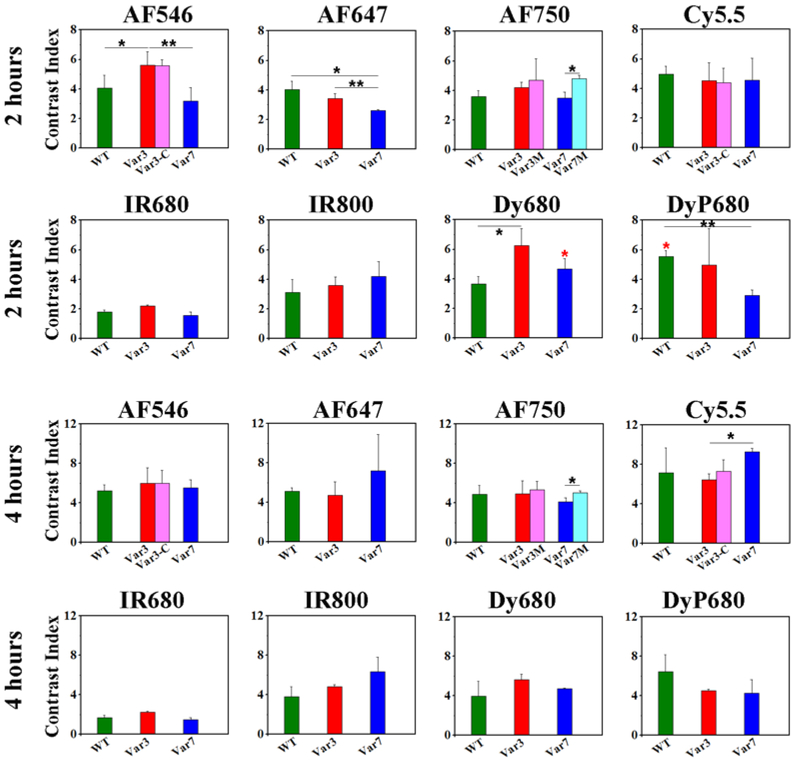
The contrast index was calculated only for two time points, 2 and 4 hours, since fluorescent signal in muscle at 24 and 48 hrs post-injection was at the level of the background fluorescence (Figure 4 and Supplementary Table S3). We did not observe any significant difference in CI between various pHLIP® sequences, except of AF546-Var3, which exhibit statistically significant higher CI compared to AF546-WT and – Var7. The highest contrast (around 6) was observed for AF546, Dy680 and DyP680 at 2 hrs post-injection. At 4 hrs the highest contrast of >8 was found for Cy5.5 pHLIP® peptides. The lowest CI was detected for IR680 pHLIP® peptides.
Figure 4. Contrast index (CI) calculated at 2 and 4 hrs time points p.i..
The mean values of CI and St.d. calculated for each fluorescent pHLIP® variant at each time point are presented. The p-level values were computed based on the two-tailed test, * < 0.05 and ** < 0.005. The red asterisk represents p-level calculated for CI between Dy680-WT and DyP680-WT, Dy680-Var7 and DyP680-Var7. The numerical values of CI are given in the Supplementary Table 3.
We tested ability of pHLIP® peptides to deliver imaging agents into cells. The inserting across membrane C-terminal part of Var3 of pHLIP® peptide was conjugated with AF546 and Cy5.5. We selected the most hydrophobic dyes to avoid complications with their translocation across cellular membrane. Our data indicate that CI was very similar for the conjugates, where AF546 or Cy5.5 dyes are conjugated to the N- or C-terminus of the peptide. We can conclude that Var3 pHLIP® peptide is capable of delivering cargo molecules, including imaging agents, not only to the cellular surface, but also across membrane in cytoplasm. However, the polarity of cargo will affect the efficiency of its cellular delivery. Also, we evaluated performance of modified Var3M and Var7M pHLIP® variants, where several Asp residues were added to the N-terminus of the peptides. The statistically significant improvement of CI was observed only for AF750-Var7M compared to AF750-Var7 (see Figure 4).
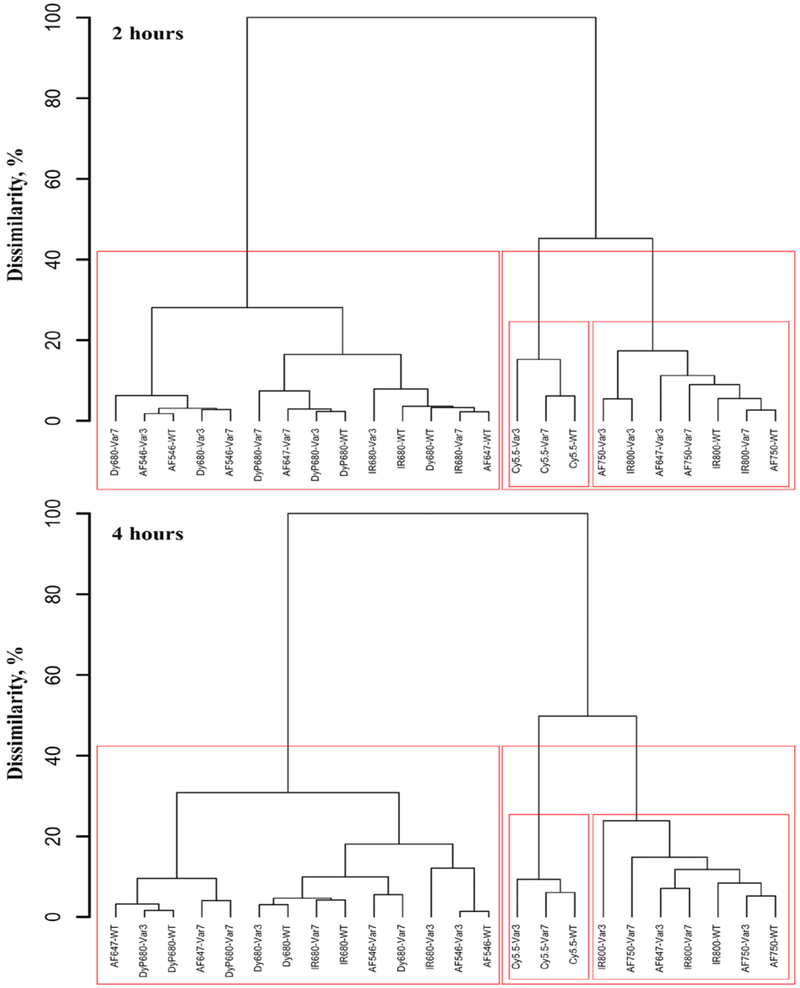
To establish classification between the investigated fluorescently-labeled pHLIP® peptides we applied statistical agglomerative hierarchical clustering (tree-clustering) algorithm to the database of 24 objects comprising four normalized fluorescence parameters (NFT, NFM, NFL, NFK) obtained on 3 different pHLIP® variants conjugated with 8 fluorescent dyes and measured at time points of 2 and 4 hours. The main purpose was to build a tree-based hierarchical clustering solution, or dendrogram, to illustrate the similarities between the conjugates and the order at which they merge into clusters. The dendrograms for 2 and 4 hour time points were constructed by joining of objects into clusters by using an Euclidian measure of distances between objects in the multi-dimensional space of analyzed fluorescent parameters, and applying an amalgamation Ward’s (linkage) rule [32] (see Figure 5). The dendrogram height, which reflects the level of dissimilarity between clusters, was scaled to percentage for convenience of interpretation. The conjugates merged at the lower levels of height are more similar in terms of fluorescent parameters than those merged at the higher levels. Significant changes in the height of dendrogram may indicate the data partition into the appropriate number of clusters. We chose clustering algorithm because it does not require any a priori assumption about data distribution and allows us to reveal naturally existing classes and quantitatively estimate degrees of their distinctions, oppose to commonly used k-means or model-based clustering hierarchical approaches, which require a pre-defined number of classes. Our analysis allowed us to reveal three main clusters. The first cluster contains pHLIP® variants conjugated with AF647, AF750 and IR800 fluorescent dyes. The second cluster is comprising of Cy5.5-labeled pHLIP® peptides. And third cluster contains all other fluorescent pHLIP® peptides.
Figure 5. Multivariate statistical analysis.
The dendrograms obtained for imaging properties of various fluorescent pHLIP® peptides at 2 and 4 hrs time points p.i.
We also performed multivariate linear regression analysis on a combined (not averaged) response of four fluorescent variables represented by NFT, NFM, NFL and NFK, and three categorical predictors represented by Time (2, 4 and 24 hours), Dye (8 various fluorescent dyes), and pHLIP® sequences (Var3, Var7, and WT). Unlike linear regression performed on each fluorescence parameter separately, multivariate regression takes into account natural correlation between all four parameters. Model coefficients for categorical predictors of Time and pHLIP® sequences are summarized in Table 2. All coefficients marked by bold color indicate significant difference from the corresponding reference levels. The obtained data show that the fluorescent signal in tumors and kidneys drops significantly only at 24 hours after conjugates administration, while fluorescence in muscle and liver changes over all period of time (4 and 24 hrs) indicating on the washing of the conjugates from tissue and organs with normal extracellular pH. Finally, fluorescent Var7 and WT pHLIP® peptides demonstrate statistically significant reduction in tumor targeting compared to fluorescent Var3 pHLIP® peptide, which is selected as the best pHLIP® sequence.
Table 2.
The coefficients obtained using multivariate linear regression on a combined response of four fluorescence variables represented by NFT (normalized fluorescence in tumor), NFM (normalized fluorescence in muscle), NFL (normalized fluorescence in liver) and NFK (normalized fluorescence in kidney), and two categorical predictors represented by Time (2, 4 and 24 hours) and pHLIP® variants (Var3, Var7, and WT). All coefficients marked by bold color indicate significant difference from the corresponding reference level. The intercept values correspond to the averages of four fluorescence variables at the reference levels of the predictors: Time = 2 hours and pHLIP® variant = Var3.
| NFT | NFM | NFL | NFK | |
|---|---|---|---|---|
| Intercept | 1.325 | 0.312 | 0.685 | 0.615 |
| Time | ||||
| 2h (Reference) | 0 | 0 | 0 | 0 |
| 4h | 0.058 | −0.033 | −0.178 | −0.101 |
| 24h | −0.548 | −0.190 | −0.678 | −0.615 |
| pHLIP® variant | ||||
| Var3 (Reference) | 0 | 0 | 0 | 0 |
| Var7 | −0.530 | −0.094 | −0.380 | −0.181 |
| WT | −0.226 | −0.029 | −0.074 | −0.178 |
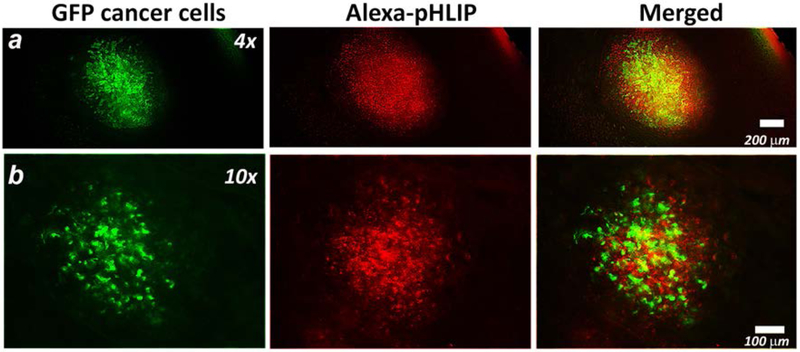
The 4T1 transplantable cancer cell line can spontaneously metastasize from primary tumor in the mammary gland to multiple distant sites [33–34]. The AF546-Var3 peptide was selected to study targeting of submillimeter metastatic lesions in lungs. 4T1-GFP cancer cells were injected subcutaneously in the mammary fat pad of female mice. After approximately 3 weeks, the primary tumor metastasized in the lungs. AF546-Var3 peptide was administrated as a single intravenous injection. At 4 hours after injection of AF546-Var3 animals were euthanized and lungs were collected for ex vivo imaging. The freshly-excised lungs we examined under fluorescent microscope. The cancerous lesions are identified by intracellular GFP fluorescence shown by green color on Figure 6. The AF546-Var3 fluorescence signal is observed from the extracellular space and cellular membranes (shown by red color on Figure 6). The 400–600 μm sized metastatic lesions were targeted by fluorescent pHLIP® peptide very well.
Figure 6. Targeting of submillimeter metastatic lesions in lungs.
4T1-GFP cells were injected subcutaneously in the mammary pad of the mouse. After 3 weeks, the primary tumor metastasized in the lungs. The AF546-Var3 was given as a single i.v. tail vein injection. At 4 hrs p.i. animals were euthanized, the lungs were excised and imaged immediately under fluorescent microscope. The representative fluorescent images obtained at different magnifications are presented. The GFP (green) and AF546-Var3 (red) fluorescence and their overlay are shown. The experiment was repeated on six animals and total 16 metastatic lesions were detected.
DISCUSSION
The peptides of pHLIP® family are under development for delivery of imaging and therapeutic cargo molecules to cancer cells in tumors and other acidic diseased tissues. Since the most cargo molecules including NIR fluorescent dyes are large molecules (about 1 kDa in mass) they can affect and alter biodistribution of pHLIP® peptides (about 4 kDa in mass). Here we carried out a systematic investigation to compare targeting of 4T1 mammary tumors, kidney, liver and muscle at different time points after single intravenous administration of various pHLIP® peptides conjugated with fluorescent dyes of different polarity.
Peptides conjugated with slightly hydrophobic molecules (such as AF546) demonstrate excellent targeting of tumors. It could be attributed to the stronger interactions of conjugates with plasma membranes of blood cells at neutral pH, which leads to the increase of circulation time in blood and ability to reach cancer cells followed by insertion and formation of stable transmembrane helical structures. The difference in clearance and tumor targeting is noticeable between Var3 and Var7 pHLIP® peptides. We have shown previously that Var7 exhibits weaker interaction with cellular membrane at neutral pH compared to Var3 [10].
Increase of cargo hydrophobicity (Cy5.5) leads to the increase of conjugates accumulation in liver, which indicative of switch from renal to hepatic clearance. Also tumor targeting and tumor accumulation is significant and increases with time, while conjugates are washed from major organs.
The pHLIP® peptides conjugated with polar NIR dyes, such as AF750 and IR800, showed very similar tumor targeting and biodistribution. They accumulation in kidney was the highest for these conjugates. Interestingly, that pHLIP® peptides conjugated with a more polar DyP680 (pegylated version of the Dy680) also exhibit higher accumulation in kidney compared to less polar Dy680 pHLIP® conjugates.
In addition of targeting of primary breast tumors, we demonstrated targeting of submillimeter metastatic lesions in lungs by AF546-Var3. Apparently these small lesions were acidic, since they were stained well by fluorescent pHLIP®. Use of pHLIP® peptides opens an opportunity of investigating, imaging and treating of metastatic lesions.
The fluorescent pHLIP® peptides also could have an important implication for staining and visualization of cancerous lesions during surgical procedures [35]. Fluorescence-guided surgery has the promise to improve surgical procedures by determining tumor margins and staining flat lesions using tumor-specific targeting and by increasing the visual information available to the surgeon [36]. There is a variety of tumor-specific agents that are under development for imaging of tumors [37]. Fluorescent pHLIP® could be a novel universal agent, since it can target various tumors with high accuracy.
In summary, we can conclude that pHLIP® peptides show excellent targeting of primary tumors and metastatic lesions. By tuning of peptide sequence or link between peptides and cargo the biodistribution could be altered. This is especially important for the selective tumor delivery of therapeutic cargo molecules.
Supplementary Material
ACKNOWLEDGEMENTS.
This work was supported by the National Institute of General Medical Sciences Grant RO1 GM073857 to OAA and YKR.
REFERENCES
- 1.Damaghi M, Wojtkowiak JW, Gillies RJ (2013) pH sensing and regulation in cancer. Front Physiol 4:370. [DOI] [PMC free article] [PubMed] [Google Scholar]
- 2.Gatenby RA, Gawlinski ET, Gmitro AF, Kaylor B, Gillies RJ (2006) Acid-mediated tumor invasion: a multidisciplinary study. Cancer Res 66:5216–5223. [DOI] [PubMed] [Google Scholar]
- 3.Gatenby RA, Smallbone K, Maini PK, et al. (2007) Cellular adaptations to hypoxia and acidosis during somatic evolution of breast cancer. Br J Cancer 97:646–653. [DOI] [PMC free article] [PubMed] [Google Scholar]
- 4.Hashim AI, Zhang X, Wojtkowiak JW, Martinez GV, Gillies RJ (2011) Imaging pH and metastasis. NMR Biomed 24:582–591. [DOI] [PMC free article] [PubMed] [Google Scholar]
- 5.Chiche J, Brahimi-Horn MC, Pouyssegur J (2010) Tumour hypoxia induces a metabolic shift causing acidosis: a common feature in cancer. J Cell Mol Med 14:771–794. [DOI] [PMC free article] [PubMed] [Google Scholar]
- 6.Parks SK, Chiche J, Pouyssegur J (2013) Disrupting proton dynamics and energy metabolism for cancer therapy. Nat Rev Cancer 13:611–623. [DOI] [PubMed] [Google Scholar]
- 7.Andreev OA, Engelman DM, Reshetnyak YK (2010) pH-sensitive membrane peptides (pHLIPs) as a novel class of delivery agents. Mol Membr Biol 27:341–352. [DOI] [PMC free article] [PubMed] [Google Scholar]
- 8.Andreev OA, Engelman DM, Reshetnyak YK (2014) Targeting diseased tissues by pHLIP insertion at low cell surface pH. Front Physiol 5:97. [DOI] [PMC free article] [PubMed] [Google Scholar]
- 9.Andreev OA, Engelman DM, Reshetnyak YK (2009) Targeting acidic diseased tissue: New technology based on use of the pH (Low) Insertion Peptide (pHLIP). Chim Oggi 27:34–37. [PMC free article] [PubMed] [Google Scholar]
- 10.Weerakkody D, Moshnikova A, Thakur MS, et al. (2013) Family of pH (low) insertion peptides for tumor targeting. Proc Natl Acad Sci U S A 110:5834–5839. [DOI] [PMC free article] [PubMed] [Google Scholar]
- 11.Karabadzhak AG, Weerakkody D, Wijesinghe D, et al. (2012) Modulation of the pHLIP transmembrane helix insertion pathway. Biophys J 102:1846–1855. [DOI] [PMC free article] [PubMed] [Google Scholar]
- 12.Andreev OA, Karabadzhak AG, Weerakkody D, Andreev GO, Engelman DM, Reshetnyak YK (2010) pH (low) insertion peptide (pHLIP) inserts across a lipid bilayer as a helix and exits by a different path. Proc Natl Acad Sci U S A 107:4081–4086. [DOI] [PMC free article] [PubMed] [Google Scholar]
- 13.Reshetnyak YK, Segala M, Andreev OA, Engelman DM (2007) A monomeric membrane peptide that lives in three worlds: in solution, attached to, and inserted across lipid bilayers. Biophys J 93:2363–2372. [DOI] [PMC free article] [PubMed] [Google Scholar]
- 14.Reshetnyak YK, Andreev OA, Segala M, Markin VS, Engelman DM (2008) Energetics of peptide (pHLIP) binding to and folding across a lipid bilayer membrane. Proc Natl Acad Sci U S A 105:15340–15345. [DOI] [PMC free article] [PubMed] [Google Scholar]
- 15.Vavere AL, Biddlecombe GB, Spees WM, et al. (2009) A novel technology for the imaging of acidic prostate tumors by positron emission tomography. Cancer Res 69:4510–4516. [DOI] [PMC free article] [PubMed] [Google Scholar]
- 16.Karabadzhak AG, An M, Yao L, et al. (2014) pHLIP-FIRE, a cell insertion-triggered fluorescent probe for imaging tumors demonstrates targeted cargo delivery in vivo. ACS Chem Biol 9:2545–2553. [DOI] [PMC free article] [PubMed] [Google Scholar]
- 17.Daumar P, Wanger-Baumann CA, Pillarsetty N, et al. (2012) Efficient (18)F-Labeling of Large 37-Amino-Acid pHLIP Peptide Analogues and Their Biological Evaluation. Bioconjug Chem 23:1557–1566. [DOI] [PMC free article] [PubMed] [Google Scholar]
- 18.Cheng CJ, Bahal R, Babar IA, et al. (2015) MicroRNA silencing for cancer therapy targeted to the tumour microenvironment. Nature 518:107–110. [DOI] [PMC free article] [PubMed] [Google Scholar]
- 19.Cruz-Monserrate Z, Roland CL, Deng D, et al. (2014) Targeting pancreatic ductal adenocarcinoma acidic microenvironment. Sci Rep 4:4410. [DOI] [PMC free article] [PubMed] [Google Scholar]
- 20.Adochite RC, Moshnikova A, Carlin SD, et al. (2014) Targeting breast tumors with pH (low) insertion peptides. Mol Pharm 11:2896–2905. [DOI] [PMC free article] [PubMed] [Google Scholar]
- 21.Tapmeier TT, Moshnikova A, Beech J, et al. (2015) The pH low insertion peptide pHLIP Variant 3 as a novel marker of acidic malignant lesions. Proc Natl Acad Sci U S A 112:9710–9715. [DOI] [PMC free article] [PubMed] [Google Scholar]
- 22.Reshetnyak YK, Yao L, Zheng S, Kuznetsov S, Engelman DM, Andreev OA (2011) Measuring tumor aggressiveness and targeting metastatic lesions with fluorescent pHLIP. Mol Imaging Biol 13:1146–1156. [DOI] [PMC free article] [PubMed] [Google Scholar]
- 23.Loja MN, Luo Z, Greg Farwell D, et al. (2013) Optical molecular imaging detects changes in extracellular pH with the development of head and neck cancer. Int J Cancer 132:1613–1623. [DOI] [PMC free article] [PubMed] [Google Scholar]
- 24.Luo Z, Loja MN, Farwell DG, et al. (2014) Widefield optical imaging of changes in uptake of glucose and tissue extracellular pH in head and neck cancer. Cancer Prev Res (Phila) 7:1035–1044. [DOI] [PMC free article] [PubMed] [Google Scholar]
- 25.Macholl S, Morrison MS, Iveson P, et al. (2012) In vivo pH imaging with (99m)Tc-pHLIP. Mol Imaging Biol 14:725–734. [DOI] [PMC free article] [PubMed] [Google Scholar]
- 26.Viola-Villegas NT, Carlin SD, Ackerstaff E, et al. (2014) Understanding the pharmacological properties of a metabolic PET tracer in prostate cancer. Proc Natl Acad Sci U S A 111:7254–7259. [DOI] [PMC free article] [PubMed] [Google Scholar]
- 27.Fox J, Weisberg S (2011) An R Companion to Applied Regression. Thousand Oaks, CA: Sage. [Google Scholar]
- 28.Tao K, Fang M, Alroy J, Sahagian GG (2008) Imagable 4T1 model for the study of late stage breast cancer. BMC Cancer 8:228. [DOI] [PMC free article] [PubMed] [Google Scholar]
- 29.Yang J, Mani SA, Donaher JL, et al. (2004) Twist, a master regulator of morphogenesis, plays an essential role in tumor metastasis. Cell 117:927–939. [DOI] [PubMed] [Google Scholar]
- 30.Eckhardt BL, Parker BS, van Laar RK, et al. (2005) Genomic analysis of a spontaneous model of breast cancer metastasis to bone reveals a role for the extracellular matrix. Mol Cancer Res 3:1–13. [PubMed] [Google Scholar]
- 31.Serganova I, Rizwan A, Ni X, et al. (2011) Metabolic imaging: a link between lactate dehydrogenase A, lactate, and tumor phenotype. Clin Cancer Res 17:6250–6261. [DOI] [PMC free article] [PubMed] [Google Scholar]
- 32.Ward JH Jr., (1963) Hierarchical Grouping to Optimize an Objective Function. Journal of the American Statistical Association 58:236–244. [Google Scholar]
- 33.Pulaski BA, Ostrand-Rosenberg S (2001) Mouse 4T1 breast tumor model. Curr Protoc Immunol Chapter 20:Unit 20 22. [DOI] [PubMed] [Google Scholar]
- 34.Yang S, Zhang JJ, Huang XY (2012) Mouse models for tumor metastasis. Methods Mol Biol 928:221–228. [DOI] [PMC free article] [PubMed] [Google Scholar]
- 35.Keereweer S, Van Driel PB, Snoeks TJ, et al. (2013) Optical image-guided cancer surgery: challenges and limitations. Clin Cancer Res 19:3745–3754. [DOI] [PubMed] [Google Scholar]
- 36.Keereweer S, Kerrebijn JD, van Driel PB, et al. (2011) Optical image-guided surgery--where do we stand? Mol Imaging Biol 13:199–207. [DOI] [PMC free article] [PubMed] [Google Scholar]
- 37.Frangioni JV (2003) In vivo near-infrared fluorescence imaging. Curr Opin Chem Biol 7:626–634. [DOI] [PubMed] [Google Scholar]
Associated Data
This section collects any data citations, data availability statements, or supplementary materials included in this article.


