

Abstract
The receptor encoded by the human TLR3 gene recognizes double-strand RNAs (dsRNAs) associated with viral infection. TLR3 expression is strongly activated upon differentiation of monocytes to dendritic cells, and can be further stimulated by the dsRNA analog polyinosine:polycytosine (PI:C). We report evidence for developmental regulation of the TLR3 gene. In dendritic cells derived from cord blood, both differentiation- and PI:C-associated TLR3 transcriptional activation are impaired as compared to cells from adults. Consistent with relative expression patterns, chromatin states and remodeling differ between newborn and adult samples. TLR3 expression in newborn dendritic cells exhibits heterocellularity and allelic imbalance (skewing), features characteristic of cis-acting epigenetic control. These findings reveal a new source for variability in innate immune system function and provide a model for further study of perinatal epigenetic transitions during development.
Keywords: Innate immunity, Toll-like receptors, Development, Epigenetics, Chromatin
1. Introduction
The term epigenetics describes the setting of heritable patterns of gene expression. Differences in such patterns are not attributable to changes in DNA sequence, but typically involve cis-acting epigenetic marks. The most widely studied marks are encoded by DNA methylation or histone tail modifications (Barski et al., 2007; Bernstein et al., 2006; Goldberg et al., 2007; Mikkelsen et al., 2007; Ohm et al., 2007), but - particularly in multicellular higher eukaryotic organisms – multiple additional mechanisms are used (Anguera et al., 2006; Burke et al., 2005; Fraser, 2006; Marahrens, 1999; Rassoulzadegan et al., 2006; Rinn et al., 2007). Epigenetic modifications provide a molecular context in which transcription factors and other transacting regulatory factors interact with target genes. The overall expression of loci under epigenetic control presumably depends on the interplay of these cis- and trans-acting elements.
There is currently strong interest in epigenetics due to its fundamental role in setting cell state. It is widely accepted that epigenetic mechanisms are crucial in the establishment of gene expression patterns in very early development while, by contrast, much less is known of the role these marks play in peri- and post-natal development. One intriguing example exists of an epigenetic transition in the perinatal period: fetal to adult hemoglobin switching (Goren et al., 2006; Rupon et al., 2006; Stamatoyannopoulos and Grosveld, 2001; Yu et al., 2006). Transitions occurring around the time of birth may be of particular importance, since there is cumulative evidence that this interval represents an important developmental window linked to risk patterns for adult diseases (Godfrey et al., 2007; Ozanne and Constancia, 2007). Finding appropriate models to study such events should provide invaluable insights on the mechanisms that govern development. Of the many organs and systems that might prove to be good models for our study, we decided to focus on the innate immune system.
The host’s innate immune system recognizes and responds to a variety of microbe-associated molecules. Microbial products activate host cells via Toll-like receptors (TLR) in antigen presenting cells, in particular dendritic cells, which have the unique ability to induce primary immune responses. In humans, ten members of the TLR family have been identified; each member of the TLR family recognizes distinct pathogen-associated molecular patterns, and in response mediates the activation of NF-kB and other signaling pathways.
It is generally accepted that the immune system is not fully mature at birth, and that newborns consequently suffer an elevated frequency and severity of microbial infections. The acquired immune system at birth has been well studied in this context, but less is known about the relative function of TLR-mediated innate immunity in the newborn (Adkins et al., 2004; Levy, 2007; Levy et al., 2004; Marodi, 2006) or with age. An association between TLR polymorphism and prematurity has been observed (Fleer and Krediet, 2007). Further, impaired neonatal responsiveness to TLR3- and TLR4-mediated signals has been noted and, in the case of the IL12A gene, linked to a defect in chromatin remodeling (De Wit et al., 2003; Goriely et al., 2004). Renshaw et al. reported that macrophages from older mice have lower levels of TLR3 than their young counterparts, suggesting that its expression might be subject to age-related regulation (Renshaw et al., 2002).
The human TLR3 gene is located on chromosome 4q35 and is activated by double stranded RNA present during replication of some viruses. TLR7 and TLR8 are likewise activated by viral RNA, but TLR3 is the only TLR up-regulated upon differentiation of monocytes into dendritic cells (Visintin et al., 2001), pointing to an underlying role of TLR3 in DC function. TLR3 has been shown to play a role in an array of processes from infection to autoimmunity (Lang et al., 2006).
We decided to examine TLR3 as a possible target for developmental epigenetic control using an in vitro system in which primary human monocytes (MO) differentiate into dendritic cells (DC). Strong up-regulation of TLR3 expression occurred as MO from adult donors (AD) acquired the DC phenotype. Changes in histone tail modifications typically associated with transcriptional activation were also evident around the gene promoter. Of particular importance here, most of these changes were substantially reduced in cord blood (CB) derived DC. Further, TLR3 expression in CB cells remained relatively low even after treatment with polyinosine-poly(C) (PI:C), a known TLR3 agonist and ligand. Finally, TLR3 expression in adult and cord blood samples showed several hallmark features of cis-acting epigenetic control.
2. Materials and methods
2.1. Ethics
All human materials used in this study were received under approval of the Institutional Review Board of the National Institute of Child Health and Human Development (NICHD), or of the Clinical Center, National Institutes of Health (NIH).
2.2. Cell purification and culture
Monocyte-enriched apheresis or whole blood samples were obtained from healthy volunteers from the NIH Department of Transfusion Medicine. Whole cord blood samples were obtained from healthy term newborns. Samples were diluted 2- to 4-fold in PBS by the addition of citrate dextrose solution (ACD). Samples were placed on a Ficoll-paque gradient (density 1.077) and centrifuged for 20 min at 900 g at room temperature. The interphase was transferred to a fresh tube and diluted to 40 ml using Dulbecco’s PBS (DPBS) and centrifuged twice for 5 min at 200 g to reduce platelet contamination. Samples were resuspended in 20 ml of RPMI 1640, 10% fetal calf serum (FCS) and placed on a lower density Ficoll-paque gradient (15 min, 500 g, room temperature) (Lehner and Holter, 2002). Interphase cells were collected and washed in DPBS followed by centrifugation for 10 min at 500 g. Pellets were resuspended in 20 ml of PBE (PBS, 0.5% BSA, 2mM EDTA) and centrifuged for 10 min at 500 g. Monocytes were further purified by subtractive magnetic cell sorting using a monocyte isolation kit (Miltenyi, Auburn, CA) following the manufacturer’s protocol.
Purified monocytes were washed in DPBS. To obtain DC, cells were plated in RPMI 1640, 10% FCS, 50ng/ml GM-CSF, 20ng/ml IL-4. Cells were refed every other day and DC were harvested by day 6 or 7. For long term treatment, PI:C was added at each refeeding. For short term treatment, PI:C was added to the cultures at refeeding and cells were harvested 14 h later. Purities of MO and DC preparations were assessed by flow cytometry (FACSCalibur; BD Biosciences, San Jose, CA) with the following antibodies: anti-CD14 FITC, anti-biotin PE (Miltenyi); anti-HLA-DR, and anti-CD86 (BD Biosciences).
2.3. Preparation of nuclei and native chromatin
Nuclei and histone-H1 depleted chromatin were prepared by a procedure described previously (Russanova et al., 2004b)
2.4. Preparation of chromatin using crosslinking reagent
Purified monocytes and/or scraped DC were resuspended in a PBS/EDTA/BSA 10mM butyrate buffer and pelleted at 1800 rpm at 4°C. Pellets were washed with PBS-Butyrate, centrifuged again and the cells were diluted to a density 2·106 cells/ml in 50 mM HEPES-10mM butyrate buffer and crosslinked with 1% formaldehyde solution for 10 min at room temperature with constant rotation. The reaction was stopped by adding 1.25 M glycine solution to a final concentration 0.125 M. Incubation continued for 15 min. Cells were washed 3 times with cold PBS-butyrate and resuspended at 1 ml/107 cells in lysis buffer (5 mM HEPES, pH 8.0, 85 mM NaCl, 0.5% Triton-X100, 10mM Na-butyrate) with added protease inhibitors (Complete Mini, Roche). Nuclei were isolated by douncing cells 20–30 times in a cell douncer (Kontes glass Co.). Nuclei were centrifuged and resuspended at 100 μl per 107 cells in buffer B (0.25 M sucrose, 10 mM Tris-HCl, pH8.0, 3 mM MgCl2, 10 mM Na-butyrate). An equal volume glycerol was added and the nuclei were stored at −20°C.
Micrococcal nuclease (MN) digestion was carried out as described previously (Russanova et al., 2004b). Briefly, nuclei were resuspended in buffer B plus 1 mM CaCl2. For each sample, the optimal MN concentration was determined by titration to obtain an average length of 500–1000 bp. Digestion proceeded at 37°C for 15 min followed by addition of SDS to a final concentration of 1%. Samples were sonicated for 15–30 s at 20% output. The insoluble debris was removed by centrifugation at 10000 g for 30 min at 4°C. Soluble chromatin fragments were diluted in ChIP buffer (50mM Tris-HCl, pH 7.5, 1% NP-40, 0.25% sodium deoxycholate, 150 mM NaCl, 1 mM EDTA, 5 mM NaButyrate, protein inhibitors) to a final SDS concentration 0.1%. Aliquots of chromatin were stored at −20°C.
2.5. Immunoprecipitation of native and/or formaldehyde-fixed chromatin
ChIP was performed as described in (Russanova et al., 2004b). The following antibodies were used: polyclonal anti-acetylated H4 (Russanova et al., 2004a), anti-dimethyl H3 K4 (Upstate, Millipore, Billerica, MA) and anti-methylated H3K9 (Upstate). Briefly, chromatin aliquots containing 25 to 50 μg DNA in ChIP buffer were preadsorbed by incubating with the paramagnetic beads overnight at 4°C on a rotating platform. The preadsorbed chromatin was mixed with antibody-coated paramagnetic beads (0.5ml) and incubated at 4°C overnight on a rotating platform. Beads were washed 6 times with 800 μl ChIP buffer using a magnetic rack, followed by 2 washes with ChIP buffer containing 0.5 M NaCl. Finally, beads were washed twice with Elution buffer (20 mM Tris-HCl, pH 8.0, 0.2 mM EDTA, 200 mM NaCl ) and resuspended in 50 μl Elution buffer. To dissociate bound chromatin from the antibody, 50 μl 2% SDS was added, the samples were mixed and incubated for 30 min at 37°C. Samples were centrifuged at 5000 g for 5 min at room temperature. Supernatants containing immunoprecipitated chromatin were incubated at 65°C 14 hours to reverse the crosslink. DNA was isolated by Protease K treatment 3–4 hr at 47°C and a DNA purification system (Wizard PCR preps, Promega). Samples were resuspended in 10 mM Tris, 0.25mM EDTA, 100 μg/ml glycogen. DNA concentration was measured using a PicoGreen kit and Turner Biosystems fluorimeter according to the manufacturer’s instructions.
2.6. PCR amplification and HPLC fractionation
These experiments were performed as reported previously (Russanova et al., 2004b). Primer design was accomplished using an interface utility designed to work with Primer3, and with the masked human genome (ftp://hgdownload.cse.ucsc.edu; goldenPath/hg18/chromosomes). PCR amplification was performed in triplicate in 20 μl reaction mixes. The reactions were assembled using an automated liquid handling system (Multiprobe II HT, Perkin-Elmer) in 96-well plates (ABgene, Inc., Rochester, NY). As a check for linearity, reactions containing 1.5, 0.5, or 0.17 ng DNA were performed initially for each primer pair. PCR products were fractionated by ion-pair reverse-phase high-pressure liquid chromatography (HPLC) on a polystyrene-divinylbenzene matrix at 50°C and detected by SYBR gold (WAVE system, Transgenomics, Inc., Omaha, NE).
2.7. Microarray analyses
RNA expression microarrays (Affymetrix, inc., Santa Clara, CA) were hybridized with RNA samples prepared from monocytes and dendritic cells. Hybridization procedures and analyses of results followed the manufacturer’s instructions.
2.8. ChIP-on-chip
Probe design was based on the masked human genome (ftp://hgdownload.cse.ucsc.edu; goldenPath/hg18/chromosomes). Probes were tiled across non-repetitive regions at 20 bp intervals using guidelines provided by the chip manufacturer (Agilent Technologies, Inc., Santa Clara, CA). Non-unique oligonucleotides were filtered by blast using the high-performance computational capabilities of the Biowulf Linux cluster at the National Institutes of Health, Bethesda, Md. (http://biowulf.nih.gov). Probe sets for 244 K feature microarray chips were uploaded (https://earray.chem.agilent.com/earray) for design completion. Immunoprecipitated chromatin as described above was subjected to ligation-mediated PCR and labeling according to the manufacturer’s instructions.
2.9. Quantitative real time PCR
Selected samples were reverse transcribed in reactions containing 300 ng total RNA (TaqMan Reverse transcription Reagents, Applied Biosystems, Foster City, CA (ABI)). TLR3 levels were assayed using a TaqMan Gene expression Assay (ABI) according to the manufacturer’s protocol and standardized against GAPDH levels (TaqMan Human GAPDH).
For determination of transcriptional rates, a two stage protocol was used. First stage primers amplified a targeted region around an intron-exon boundary in TLR3. After initial amplification (15 to 20 cycles), reaction products were diluted 100 fold. For the second stage, a custom designed nested TaqMan gene expression assay was used and normalized against total GAPDH levels.
2.10. SNP genotyping and allelic expression ratios
A SNP genotyping assay (TaqMan SNP Genotyping Assay C_1731425_10) was used to screen for heterozygous samples using genomic DNA obtained from donor monocytes. Allelic ratios were determined using cDNA as described above and the same SNP assay system. Measurements were normalized against a standard curve elaborated with genomic DNA. Samples where allelic imbalance was observed were re-assayed using freshly obtained cDNA.
2.11. RNA Fluorescence in-situ hybridization
Cells were cytospun onto coated slides (Thermo Fisher Scientific, Waltham, MA) and fixed in 4% paraformaldehyde (PFA), 10% acetic acid in PBS. Slides were stored in 70% ethanol at −20°C. Cells were permeabilized for 15 min at 37°C in pepsin-0.01M HCl solution and postfixed in 1% PFA (Braidotti, 2001). After ethanol dehydration, 20 μl hybridization mix was applied to each slide. Hybridization mix contained 2xSSC, 5% dextran sulfate, 0.2% BSA, 50% deionized formamide, 2 mM Vanadyl-ribonuclease complex (VRC) (Invitrogen, Carlsbad, CA), 1 μg of Cot-1 DNA (Invitrogen) and 30 ng probe. The probe consisted of a mixture of three 50 bp antisense oligos designed to hybridize to exonic regions of TLR3 and labeled with digoxigenin (Integrated DNA Technologies, Coralville, IA) (Chartrand et al., 2000). Hybridization was carried out overnight at 37°C followed by washes as follows; 1x 2xSSC 50% formamide, room temperature, 10 min; 3x 2xSSC 50% formamide, 41°C, 10 min each; 1x SSC, 10 min, room temperature. Samples were blocked for 1 h in 2xSSC, 2mg/ml BSA, 0.1% Tween, 2 mM VRC at room temperature. Samples were then incubated with a 1:200 dilution of an anti-digoxigenin antibody (Roche, Indianapolis, IN) overnight at 4°C. Slides were washed three times in 0.1% Tween in PBS followed by incubation with an Alexa 588 donkey anti-sheep IgG (Invitrogen). DAPI was used to label nuclear DNA. Slides were again washed, dehydrated and mounted. Images were resolved using a Zeiss 510 inverted confocal microscope.
2.12. Immunohistochemistry
Purified monocytes were plated in the presence of IL-4 and GM-CSF with or without PI:C for 3, 4 or 6 days. Cells were washed in PBS and cytospun onto coated slides (Thermo) followed by fixation for 20 min in 4% paraformaldehyde in PBS. Peroxidase detection of TLR3 was done as in (Prehaud et al., 2005) with some modifications. Endogenous avidin-binding activity was blocked by incubating samples in 0.01% streptavidin in PBS for 10 min at room temperature. After PBS washes, samples were incubated in 0.001% biotin in PBS for 10 min at room temperature. After multiple washes in PBS, antigen retrieval was performed by heating samples in a microwave oven for 1 min at high power followed by 9 min at medium power in 0.01 M citrate buffer pH 6.0. After washes, endogenous peroxidase activity was blocked using 0.5% H2O2 in methanol for 15 min at room temperature. Blocking was performed using 2% BSA, 5% normal goat serum in PBS for 1 h at room temperature. Incubation with the primary antibody (1:50 anti-TLR3 goat polyclonal antibody (Santa Cruz Biotechnology, Santa Cruz, CA) was carried out overnight at 4°C followed by stringent washes in TBS. After the primary antibody reaction, StreptABComplex/HRP-Duet, mouse/rabbit was used (DakoCytomation North America, Carpinteria, CA). HRP-labeled cells were visualized using SIGMAFAST 3,3′-Diaminobenzidine tablets. Nuclei were counterstained with Mayer’s Hematoxylin.
3. Results
3.1. Adult and cord blood DC show similar patterns of RNA expression
We wished to explore age-related differences in gene expression, in particular those that might exhibit characteristics of cis-acting epigenetic control. For this purpose, an in vitro system was used in which freshly purified human monocytes differentiate into dendritic cells. Whole blood or apheresis-enriched samples were obtained from term healthy newborn cord blood (CB) and healthy volunteers between the ages of 18 and 30 (adult group, AD). MO were isolated from CB and AD donors using a combination of Ficoll-paque gradients and subtractive magnetic purification. To obtain DC, cells were plated in the presence of IL-4 and GM-CSF for 6 days.
As a validation step for such studies, we examined whether differentiation of CB monocytes differs at a global level from that observed in adult samples. Expression microarray experiments were used to analyze genes that are strongly induced when cells differentiate from MO to DC. This restriction minimized noise associated with individual donor variation. Figure 1 shows a representative experiment. When individuals within the same age group are compared, induced levels of RNA in dendritic cells are highly reproducible. Further, in both CB and AD cells a similar fraction of genes is induced, and the fold-induction is comparable. In separate experiments, flow cytometry was used to track surface differentiation markers. The results confirmed that differentiation efficiencies are essentially identical in both newborn and adult DC (not shown). We conclude that cord blood monocytes are not globally immature, i.e., they exhibit no broad defect in gene activation, nor are they hypersensitive in their response to IL-4 and GM-CSF cytokines.
Figure 1.
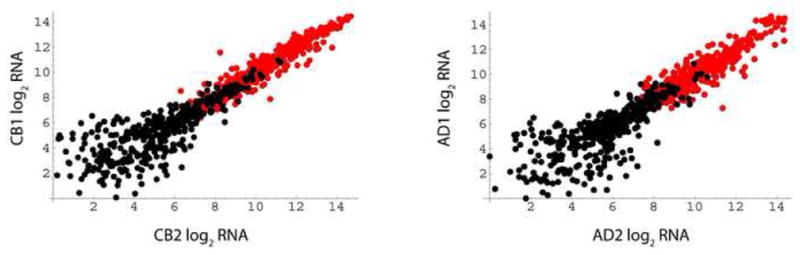
Differentiation-induced genes in cord blood and adult cells. RNA samples were isolated from fresh MO and day 6 DC. Shown are comparisons of two cord blood donors (left panel) or two adult donors (right panel). Data from Affymetrix expression microarrays were filtered to depict RNAs induced by differentiation in both individuals: thresholds were an ≥8-fold increase and a minimum level in dendritic cells of ≥150 arbitrary units. Axis scales are log (base 2) values of arbitrary units. Black circles, monocyte values (n = 406, average log (base 2) induction = 4.8); red circles, dendritic cell values (n = 367, average log (base 2) induction = 4.7).
3.2. Age-related differences in TLR3 expression
In the microarray studies, TLR3 RNA measurements were typically below the level that could be accurately quantified. Accordingly, we determined TLR3 expression using a more sensitive real time PCR assay (TaqMan, ABI). Consistent with published reports, adult MO do not express significant levels of TLR3 RNA (Fig 2A), while expression increases strikingly upon differentiation into DC.
Figure 2.
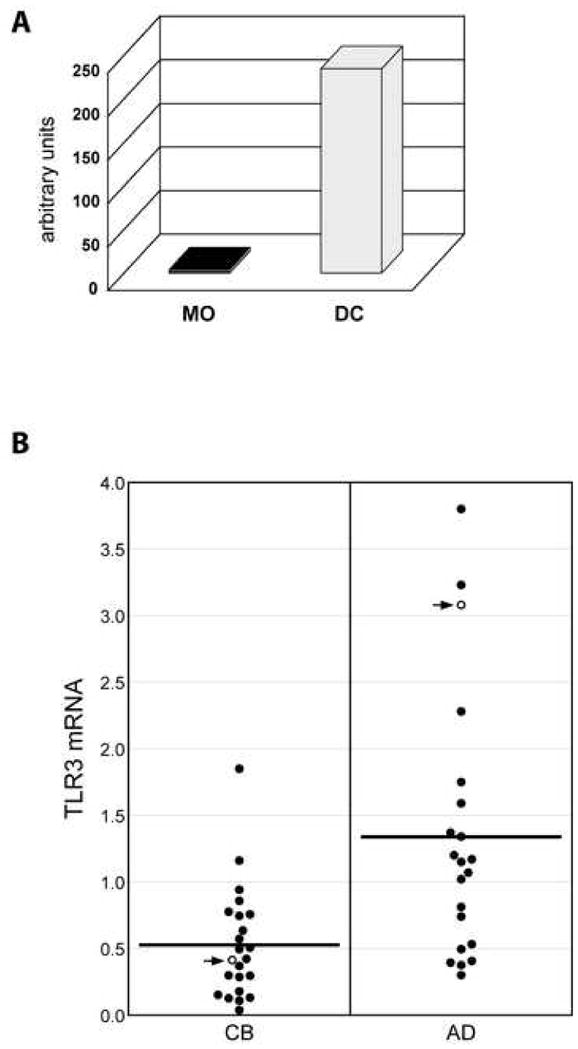
Determination of TLR3 mRNA levels. Levels of TLR3 mRNA were measured using real time PCR (TaqMan) specific for TLR3. Results were standardized using GAPDH content. (A) AD MO were purified and differentiated into DC. Total RNA was isolated from fresh MO and day 6 DC and used to measure TLR3 mRNA levels. (B) TLR3 mRNA content in CB and AD DC. Results plotted by age group. Open circles with arrows represent donors used in ChIP-on-chip experiments (Fig. 3).
If the TLR3 gene is under developmental control, average TLR3 expression in cord blood DC might differ from that in adult cells. As a first step to test this possibility, age-based analyses were carried out. The results in Fig. 2B show that average levels of TLR3 RNA are lower in cord blood than adult DC (2- to 3-fold; p < 0.001, Student t Test). Although considerable overlap is observed, about one third of the cord blood values fall at or below the lowest value in the adult series, and only one CB sample is above the average for adult cells.
3.3. ChIP-on-chip
To investigate whether the reduced TLR3 RNA levels seen in cord blood could be due to differences in transcriptional activation, we examined chromatin states around the TLR3 locus both in newborn and adult monocytes and dendritic cells. Native chromatin was immunoprecipitated using an antibody selective for multi-acetylated forms of histones H3 and H4 (Russanova et al., 2004a; Russanova et al., 2004b). Bound and input fractions were amplified, labeled, and hybridized to a custom 244K feature microarray (Agilent) with probes tiled at 20 bp intervals. Results shown in Fig. 3A represent the relative levels of H3/H4-acetylation (bound/input ratios) along a 50 Kb region centered on the TLR3 promoter.
Figure 3.
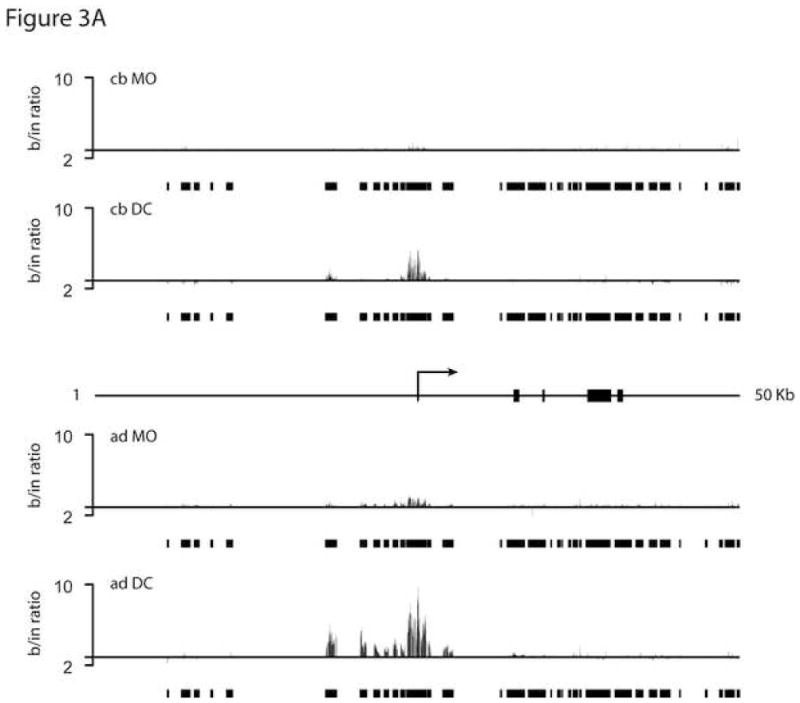
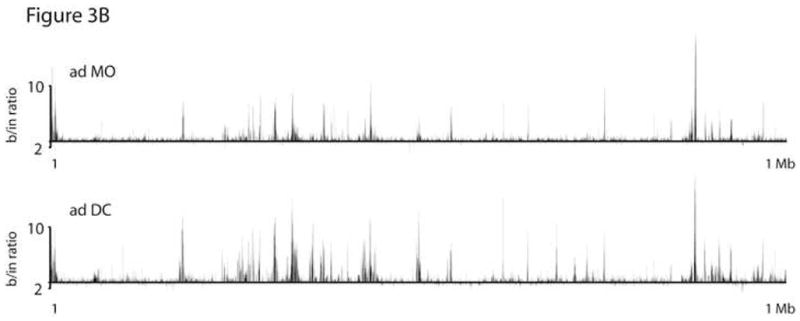
ChIP-on-chip analysis of the TLR3 locus. Chromatin was prepared from purified MO and in vitro-differentiated DC, followed by chromatin immunoprecipitation using a polyclonal anti-acetylated H3/H4 antibody. AD and CB samples were amplified, labeled, and hybridized to a custom designed oligonucleotide-array (Agilent) using standard protocols. (A) Relative levels of H3/H4 acetylation shown as ratios of bound DNA signal to input. Bars depict positions of probes represented on the chip. Arrow and rectangles indicate TLR3 transcriptional start site and exons, respectively. Data show results for the 50 Kb region that spans positions 187202303–187252303 on chr4 (NCBI build 36). (B) Relative levels of acetylation across a 1 Mb control region centered around the H10 gene; positions 36031120–37031120 on chr22.
In the adult chromatin, very significant increases in acetylation are seen to accompany the differentiation, consistent with the well documented surge in TLR3 expression as MO acquire the DC phenotype. Peak acetylation brackets the transcriptional start site, and elevated levels extend at least 7 Kb upstream. In cord blood cells, a roughly similar pattern is observed, but the magnitude is substantially lower (approx. 4-fold, in reasonable agreement with a 6-fold relative difference in RNA levels for the corresponding donor samples (see arrows in Fig. 2B)). This difference could represent weaker transactivation in most or all cord blood DC, or might reflect a smaller fraction of cells in which TLR3 expression is induced (see below). The very low acetylation levels in MO, both cord blood and adult, raised the question of a more generalized acetylation difference between MO and DC. This is not the case, since multiple genome regions represented on the chip, including a 1 Mb gene-rich control region centered around the H1O gene, showed very similar acetylation patterns in these cell types (Fig. 3B and unpublished results).
Interestingly, other members of the TLR family revealed a varied picture in this analysis. Adult MO and DC patterns are very similar for TLR 1, 2, and 4, while TLR 5, 7, and 8 exhibit clear increases in acetylation in association with differentiation (Supplementary Fig. 1). It may be noteworthy that TLR 7 and 8 share with TLR3 the property of being induced by viral RNAs. TLR 6 and 9 did not show acetylation peaks associated with their transcription start sites (not shown).
3.4 Targeted analysis of age-related differences in histone tail modifications around the TLR3 promoter region
To confirm and extend the ChIP-on-chip results, we focused on histone modification changes around the TLR3 transcriptional start site. ChIP was used in combination with a HPLC/fluorescence detection system described previously (Russanova et al., 2004a; Russanova et al., 2004b). Initially, the same anti-acetylated H3/H4 antibody was employed. In accord with the above results, a dramatic increase in acetylation was observed in adult DC over that in MO (Fig. 4A). Cord blood DC exhibited a substantial acetylation deficit immediately adjacent to the transcriptional start site.
Figure 4.
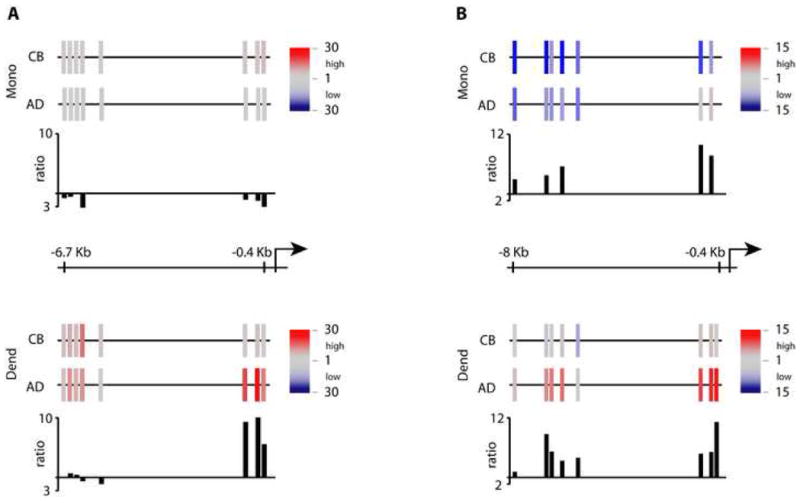

ChIP-HPLC studies on the TLR3 locus. Chromatin was prepared from purified MO and in vitro-differentiated DC, followed by chromatin immunoprecipitation using an anti-acetylated H3/H4, anti-dimethyl H3K4 or an anti-dimethyl H3K9 antibody. Graphs for AD and CB samples represent the mapping of a region between the transcriptional start site and 6.7kb upstream on the TLR3 locus on chr4. (A) Schematic representation of H3/H4-acetylation levels. Color-encoded bars indicate primer pair target positions and relative acetylation levels according to the key at right. Bar graphs below represent H3/H4-acetylation ratios between CB and AD cells. (B) dimethyl-H3K4 ChIP. C: dimethyl-H3K9 ChIP.
Methylation of H3K4 correlates with increased transcriptional activity (Barski et al., 2007), while H3K9 methylation is generally considered a marker of repression. As a next step, we performed ChIP using anti-dimethyl H3K4 and anti-dimethyl H3K9 antibodies (Figs. 4B and C). H3K4me2 levels increased, as expected, on differentiation of adult MO to DC. Comparing dendritic cells from CB and AD, this modification was considerably higher in adult. Of note, comparison of CB and AD monocytes showed that substantial H3K4 methylation differences exist in freshly isolated MO, before they commit to differentiate. The very low H3K4me2 levels in CB DC could conceivably reflect a repressive heterochromatin-like structure in MO. However, the low H3K9 methylation in the same region (Fig. 4C) is inconsistent with this state, as are the H3/H4 acetylation findings (Fig. 3A).
Overall the above results demonstrate extensive chromatin remodeling in the TLR3 locus upon differentiation of adult MO into DC. Importantly, newborn monocytes show reduced or altered chromatin changes upon differentiating under the same conditions.
3.5. Age-related differences in TLR3 expression become more striking in the presence of PI:C
TLR3 RNA levels in naïve DC (plated for 6 days in the presence of cytokines (Fig. 2B)) could be considered to represent basal expression for those cells. Full maturation and gene activation typically require an additional stimulus such as that provided by polyinosine-poly(C) (PI:C). In adult MO and DC, PI:C binds directly to TLR3 and strongly induces TLR3 gene transcription. We therefore tested whether the previously observed developmental change might be enhanced in the presence of this agent.
Figure 5A shows that adult MO treated for 14 h with PI:C exhibit substantially elevated TLR3 RNA expression. The increase in these adult cells is directly proportional to the PI:C dose. Interestingly, cord blood MO assayed in parallel were only weakly responsive to the identical stimulus. To explore this further, we examined whether newborn cells were delayed in their PI:C response. An example of the results obtained is shown in Fig. 5B. When PI:C was added to the culture media after two days and maintained throughout the remainder of the experiment, dramatic differences were seen. The most striking contrast between CB and AD cells is evident on day 3 (Fig. 5B) and 4 (not shown): at these points CB cells remain unresponsive, while AD cells exhibit very strong induction. Finally, when cells were differentiated to DC in the presence of cytokines only, and subsequently treated with PI:C for a period of 14h, levels of TLR3 mRNA were again higher in the adult than cord blood DC.
Figure 5.
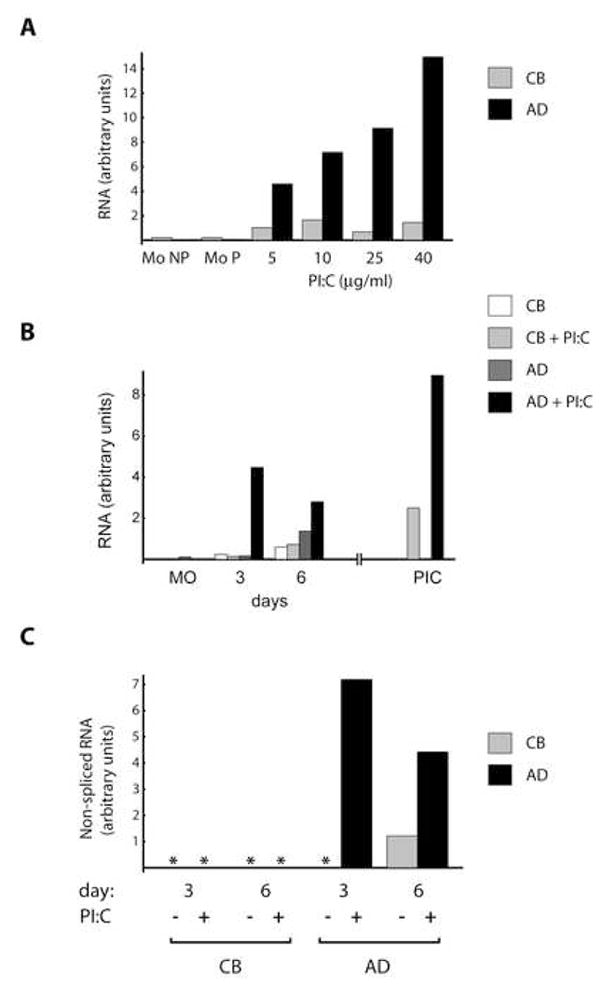
PI:C increases levels of TLR3 in AD but not CB cells. (A) Freshly isolated AD and CB MO were plated in RPMI supplemented with 10% FBS and PI:C was added in the amounts indicated. Total RNA was isolated 14 h post-plating. Samples from plated (Mo P) and non-plated (Mo NP) cells were included in the analysis. TLR3 mRNA levels were determined using real time PCR (TaqMan) and standardized by levels of GAPDH mRNA. Gray bars, CB; black, AD. (B) Cells obtained as in A were plated (MO) in RPMI, 10% FBS and IL-4/GM-CSF. Fresh cytokines were added every 48h to all cells and half of the samples were also treated with 20 μg/ml PI:C. Additionally, AD and CB MO were maintained in IL-4/GM-CSF for 7 days to complete DC differentiation; PI:C was then added for 14 h, followed by RNA purification (PIC). TLR3 mRNA levels were determined as in A. White bars, CB cytokines only; light gray, CB PI:C treated; dark gray, AD cytokines only; black, AD PI:C treated. (C) TLR3 transcriptional rates determined by a nested two stage intron-exon assay for nascent RNA. Stage one PCR targeted a TLR3 intron-exon boundary; stage two employed a custom real time TaqMan assay using nested primers. TLR3 RNA levels were standardized against levels of GAPDH. Results are expressed in relative units. Gray bar, CB; black, AD. Asterisks indicate no signal detected.
Differences in RNA levels could be attributed to differences in transcription rates, but might also be due to post-transcriptional mechanisms. Measuring newly transcribed RNA instead of total TLR3 mRNA provided a straightforward approach to distinguish between these possibilities. Nested primers that targeted regions around TLR3 intron-exon boundaries allowed us to amplify only non-spliced transcripts. Results from these assays (Fig. 5C) demonstrated a markedly higher transcriptional rate of TLR3 in PI:C treated AD cells than in identically treated CB cells.
3.6. Heterocellular TLR3 expression in cord blood DC
The lower levels of TLR3 mRNA observed in the CB could be due to a uniform diminution in TLR3 transcription across the entire cell population. Alternatively, only a fraction of CB cells might be TLR3-competent, and thus able to respond to PI:C. The latter situation should be revealed by heterocellularity within such cell populations. This has been described for other genes subject to developmental epigenetic control, for example, those that encode fetal beta globins. (Stamatoyannopoulos and Grosveld, 2001).
RNA FISH experiments were performed to determine the fraction of cells transcriptionally active at a given time. Nuclear mRNA FISH was performed using standard techniques on AD and CB PI:C-treated or control cells. Results were documented using confocal microscopy. As shown in Fig. 6A, the great majority of adult cells showed positive nuclear fluorescence after PI:C treatment. By contrast, very few of the cord blood cells were positive under identical conditions.
Figure 6.
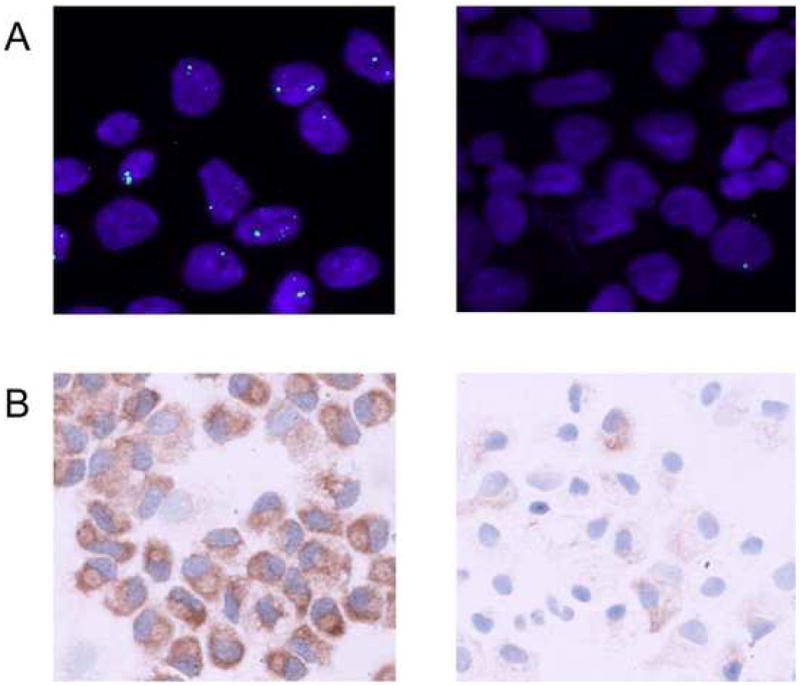
Heterocellular expression of TLR3 in CB DC. Freshly isolated cells from AD and CB donors were plated in RPMI supplemented with FBS in the presence of IL-4/GM-CSF. Two days after plating cells were fed with fresh media and cytokines followed by the addition of 10 μg/ml PI:C. (A) Detection of TLR3 mRNA by RNA-FISH. Cells were fixed 14 to 20 h following PI:C addition. Nuclear TLR3 RNA (green) was detected by FISH, and DNA was counterstained using 4′,6-diamidino-2-phenylindole (blue). Images were resolved by confocal microscopy. (B) Peroxidase detection of TLR3 protein in day 4 PI:C treated cells.
The fact that most cells within the CB sample are unresponsive to PI:C should also be evident at the protein level; hence, we studied TLR3 protein expression using a polyclonal anti-human TLR3 antibody-peroxidase assay. Again, cultured CB and AD cells were examined with or without PI:C stimulation. In the non-PI:C treated control, the number of TLR3 positive cells was not significantly different between AD and CB samples (not shown). In the presence of PI:C, nearly 100% of the AD cells exhibited positive labeling for TLR3 (Fig. 6B). In marked contrast, PI:C treated CB cells showed a variable expression pattern, with only a small number of cells becoming positive for TLR3, and the great majority remaining negative. Although the percentage of positive versus negative cells varied between CB samples, the fraction of TLR3 negative cells always remained high (not shown). These results, together with the RNA FISH data, demonstrate that TLR3 expression in cord blood DC is heterocellular; further, they reveal that TLR3 responsiveness to PI:C characterizes only a small fraction of newborn cells.
3.7. TLR3 Allelic imbalance in heterozygous DC samples
The above results are consistent with developmental regulation in which epigenetic mechanism(s) account for at least part of the observed differences in TLR3 expression between adults and newborns. Still stronger evidence for local epigenetic control would derive from a finding of allelic skewing in the expression of this gene. In principle, the presence of distinct cis-acting states on each of the two TLR3 alleles could give rise to such skewing. In the absence of a consistent bias on comparison of, for example, G vs. A polymorphisms, it would be difficult to explain imbalances on the basis of differential binding by trans-acting factors. The availability of specific oligo primers for SNP detection allowed us to check for TLR3 allele heterozygosity for each of the donors. We took advantage of a subset of heterozygous specimens to determine allelic expression ratios.
Initially we examined heterozygous DC samples at differentiation day 6. Most samples showed a 1:1 ratio between the two alleles, comparable to genomic DNA. However, one sample (CB3) revealed a clear difference in the expression levels of the two alleles (Fig. 7A). We proceeded to examine this and an additional sample at earlier points during differentiation. In CB3, greater allelic imbalances were observed at day 4 (Fig. 7B). Interestingly, skewing was somewhat diminished by the addition of PI:C. In the second sample, not part of the initial series, the imbalance followed a different time course. Here a relative decrease in G allele expression, first detectable at day 5, was followed by a dramatic drop at day 6 (Fig. 7C). Importantly, allelic bias was in favor of G in the case of CB3, whereas it was for A in the case of CB5. This makes it unlikely that skewing was due to differential function of the SNP per se.
Figure 7.
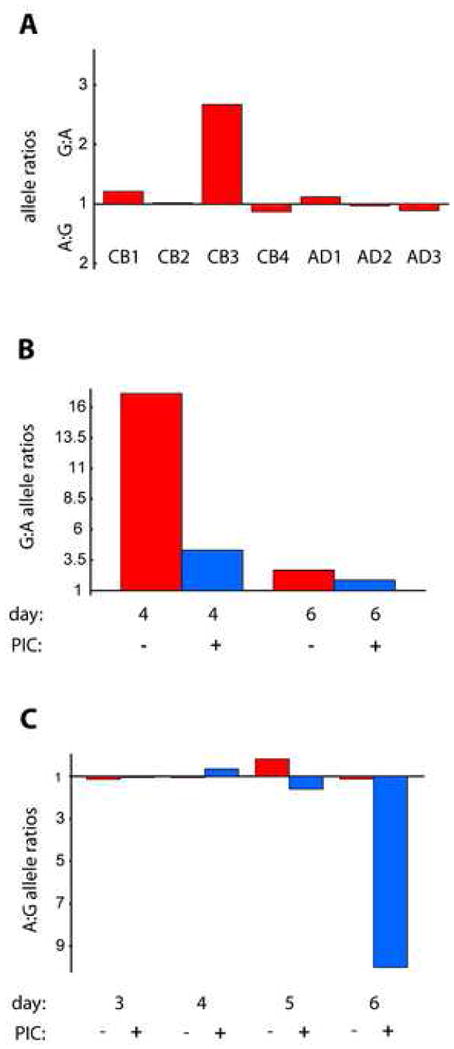
Allelic imbalance. Donor samples were screened for heterozygosity in the TLR3 gene using purified genomic DNA and a SNP detection assay (ABI). Heterozygous samples were then assayed for allelic imbalance using cDNA derived from total RNA obtained under the specified conditions. (A) Graphical representation of allelic ratios in heterozygous DC. cDNA samples were obtained by reverse transcription from day 6 DC total RNA, and allelic ratios (A:G or G:A) were determined using the real time PCR-based SNP assay. CB1-4: cord blood DC samples from separate donors; AD1-3: adult DC samples. (B, C) Influence of PI:C treatment on allelic imbalance. CB3 and CB5 samples were analyzed as in A, but total RNA samples were obtained at the indicated intervals in the presence or absence of PI:C. Bars depict the allelic ratios for each experimental time point. Note bias for allele G in CB3 and allele A in CB5.
4. Discussion
Here we present evidence that the TLR3 gene is subject to age-related epigenetic control in human monocytes and monocyte-derived dendritic cells. TLR3 expression is relatively low in newborn dendritic cells and responds poorly to PI:C treatment when compared to cells from young adults. There is no evidence for a global defect in the differentiation of CB monocytes, since expression microarray analyses revealed comparable numbers of genes to be induced in newborn and adult differentiation pathways.
As a first step to analyze monocyte-dendritic cell and newborn-adult TLR3 expression differences, we addressed whether elevated expression states reflect strong transcriptional activation. In PI:C treated adult cells, transcription could be measured directly using PCR primers that span intron-exon boundaries. To provide an indirect but broader measure of transcriptional induction, we examined chromatin remodeling. Two separate methods were employed: ChIP-on-chip and ChIP-HPLC. Strong differentiation-associated transcriptional activation occurs in adults according to multi-acetylated H3/H4 and dimethyl-H3K4 mapping data. By comparison, in cord blood cells reduced acetylation peaks and low H3K4me2 levels near the TLR3 promoter are indicative of less efficient transcriptional induction. The existence of a heterochromatin-like structure in the TLR3 promoter-proximal region in cord blood monocytes appears unlikely given the H3/H4 acetylation and H3K9me2 profiles.
One feature typical of epigenetic control is stochastic switching between on and off expression states. In yeast models, this can be evidenced by colony sectoring, in Drosophila by variegated expression patterns, and in hematopoietic burst-forming assays by colony sectoring (Lu and Eissenberg, 1998; Stamatoyannopoulos and Grosveld, 2001). Where cells are dispersed, the equivalent of sectoring or pattern variegation is heterocellularity. We therefore examined TLR3 expression for this property.
RNA FISH provided direct evidence for heterocellularity at the transcriptional level. However, rapid stochastic changes in transcription are difficult to distinguish from persistently set states (Levsky and Singer, 2003). To obtain an integrated signal, representing cumulative gene activity, we also checked the distribution of TLR3 expression at the protein level. In adult cells treated with PI:C, virtually 100 percent were peroxidase-positive, whereas most cord blood cells remained unresponsive under the same circumstances. Importantly, a small fraction of cord blood cells became strongly positive for TLR3. Heterogeneity within the latter cell population could be explained if most of the cells are not yet competent for TLR3 transcription, while positive cells have already gone through the developmental switch that renders them permissive for expression.
Heterocellularity is consistent with epigenetic regulation, but does not distinguish whether such control is located in cis to TLR3 gene alleles. To address this more difficult issue, we looked for allele independence, a characteristic of X-chromosome silencing, imprinting, and other cis-based epigenetic states. The rationale was as follows: genes that undergo developmental transitions around birth or in early childhood are likely to have acquired their initial chromatin conformation at much earlier points, either near the time of implantation or during the establishment of anlagen for specific tissue lineages. In the first instance only a few cells are present in the embryo, while in the latter only a few fetal cells may participate in the earliest steps of lineage commitment. Skewing of X-chromosome inactivation is a well studied peri-implantation process believed to result from statistical deviations in random silencing (Belmont, 1996; Knudsen et al., 2007; Puck and Willard, 1998). Less widely known is work on position effect variegation (PEV) which revealed that very early embryonic events (i.e., when few cells are present) can influence differentiation-linked relaxation of silencing at a considerably later point in development (Lu and Eissenberg, 1998). If the Drosophila PEV finding applies to mammalian organisms, it would predict that non-clonal allele-specific skewing may be much more common than currently believed. Supporting this notion is work by Hudson and coworkers, who reported that epigenetic skewing in human cells is relatively frequent (Pastinen et al., 2004). While this report attributed skewing primarily to oligo-clonality of the lines studied, evidence for skewing in normal tissue was also noted.
Consistent with the above, several examples of marked skewing were observed in association with differentiation of cord blood samples. Unlike well known epigenetic settings, these states do not directly specify expression levels, but rather influence the timing of activation and responsiveness to an agent such as PI:C. It should be emphasized that the assay is highly reliable, since both the directionality and magnitude of allelic imbalances were readily reproduced in independently prepared cDNAs from the same donor (unpublished results). Although we cannot completely exclude a role for SNPs themselves, our results revealed no consistent bias for one SNP over another in heterozygous samples; nor were TLR3 levels higher in donors homozygous for one SNP vs. the other (unpublished). Further, a lack of heritability in most SNP-determined skewing patterns, as found by Hudson and coworkers, argues against a common role for single nucleotide differences in determining expression biases (Pastinen et al., 2004). Overall, we consider the evidence for allelic skewing presented here to represent strong support for cis-acting epigenetic control in TLR3 gene regulation.
Finally, while the focus in this study has been primarily on TLR3 as a model for developmental epigenetic control, it is interesting to speculate on the biological significance of our results. Since all the samples were collected from healthy donors, it seems likely that low expression of TLR3 in utero is a developmentally desirable trend. The reason is not yet known, but high TLR3 levels have been linked to a higher frequency of abortion in a mouse model (Clark et al., 2004; Zhang et al., 2007). Possibly elevated fetal expression of TLR3 before birth carries with it an elevated risk of deleterious fetal-maternal interactions or of autoimmune pathology. Along this line, TLR3 has been implicated in diseases such as autoimmune hepatitis (Lang et al., 2006). Following birth, the well established role of TLR3 in the innate immune response presumably selects for a developmental transition allowing increased gene responsiveness and expression.
Earlier we commented on the importance of the perinatal period, infancy, and early childhood as windows for resetting of epigenetic states. We noted also that the shift from fetal to adult beta globin expression represents an intriguing model for understanding such epigenetic transitions. Not only is there remarkable inter-individual heterogeneity in the perinatal fetal-adult globin shift, but in older children, adolescents, and adults there is a strong tail in the population distribution of fetal beta globin expression (Thein and Craig, 1998). Indeed, the highest levels are clinically termed heterocellular persistence of fetal hemoglobin. Our sampling of dendritic cell TLR3 expression in adults revealed a comparatively broad distribution. In principle, this could affect individual risk profiles for the frequency and severity of certain infections, as well as autoimmune diseases characteristic of adulthood. Considered more generally, perinatal epigenetic transitions involving multiple other genes may contribute to high population variability in their observed expression patterns. The implications for human health remain as yet largely unexplored.
Supplementary Material
ChIP-on-chip analyses of TLR genes. Chromatin was prepared from purified adult MO and in vitro-differentiated DC, followed by chromatin immunoprecipitation using a polyclonal anti-acetylated H3/H4 antibody. Samples were amplified, labeled, and hybridized to a custom designed oligonucleotide-array (Agilent). Relative acetylation levels are shown as ratios of bound DNA signal to input. Bars depict positions of probes represented on the chip. Data show results for 50 Kb regions (NCBI build 36) centered around TLR transcriptional start sites (arrows).
Acknowledgments
We are very grateful to Sandy Field and Nancy Hauff (Perinatology Research Branch), and to Cindy Matthews (Dept. of Transfusion Medicine, National Institutes of Health) for the collection of blood and apheresis specimens. We thank to Vincent Schram in the National Institute of Child Health and Human Development (NICHD) Imaging Facility for assistance with fluorescence imaging experiments. We also thank Michael Doctor and Jonathan Epstein for contributions to graphics and bioinformatics used in this study. This research was supported by the Intramural Research Program of the NICHD, National Institutes of Health.
Footnotes
Publisher's Disclaimer: This is a PDF file of an unedited manuscript that has been accepted for publication. As a service to our customers we are providing this early version of the manuscript. The manuscript will undergo copyediting, typesetting, and review of the resulting proof before it is published in its final citable form. Please note that during the production process errors may be discovered which could affect the content, and all legal disclaimers that apply to the journal pertain.
References
- Adkins B, Leclerc C, Marshall-Clarke S. Neonatal adaptive immunity comes of age. Nat Rev Immunol. 2004;4:553–564. doi: 10.1038/nri1394. [DOI] [PubMed] [Google Scholar]
- Anguera MC, Sun BK, Xu N, Lee JT. X-chromosome kiss and tell: how the Xs go their separate ways. Cold Spring Harb Symp Quant Biol. 2006;71:429–437. doi: 10.1101/sqb.2006.71.012. [DOI] [PubMed] [Google Scholar]
- Barski A, Cuddapah S, Cui K, Roh TY, Schones DE, Wang Z, Wei G, Chepelev I, Zhao K. High-resolution profiling of histone methylations in the human genome. Cell. 2007;129:823–837. doi: 10.1016/j.cell.2007.05.009. [DOI] [PubMed] [Google Scholar]
- Belmont JW. Genetic control of X inactivation and processes leading to X-inactivation skewing. Am J Hum Genet. 1996;58:1101–1108. [PMC free article] [PubMed] [Google Scholar]
- Bernstein BE, Mikkelsen TS, Xie X, Kamal M, Huebert DJ, Cuff J, Fry B, Meissner A, Wernig M, Plath K, Jaenisch R, Wagschal A, Feil R, Schreiber SL, Lander ES. A bivalent chromatin structure marks key developmental genes in embryonic stem cells. Cell. 2006;125:315–326. doi: 10.1016/j.cell.2006.02.041. [DOI] [PubMed] [Google Scholar]
- Braidotti G. RNA-FISH to Analyze Allele-Specific Expression. Methods Mol Biol. 2001;181:169–180. doi: 10.1385/1-59259-211-2:169. [DOI] [PubMed] [Google Scholar]
- Burke LJ, Zhang R, Bartkuhn M, Tiwari VK, Tavoosidana G, Kurukuti S, Weth C, Leers J, Galjart N, Ohlsson R, Renkawitz R. CTCF binding and higher order chromatin structure of the H19 locus are maintained in mitotic chromatin. EMBO J. 2005;24:3291–3300. doi: 10.1038/sj.emboj.7600793. [DOI] [PMC free article] [PubMed] [Google Scholar]
- Chartrand P, Bertrand E, Singer RH, Long RM. Sensitive and high-resolution detection of RNA in situ. Methods Enzymol. 2000;318:493–506. doi: 10.1016/s0076-6879(00)18072-3. [DOI] [PubMed] [Google Scholar]
- Clark DA, Manuel J, Lee L, Chaouat G, Gorczynski RM, Levy GA. Ecology of danger-dependent cytokine-boosted spontaneous abortion in the CBA x DBA/2 mouse model. I Synergistic effect of LPS and (TNF-alpha + IFN-gamma) on pregnancy loss. Am J Reprod Immunol. 2004;52:370–378. doi: 10.1111/j.1600-0897.2004.00237.x. [DOI] [PubMed] [Google Scholar]
- De Wit D, Tonon S, Olislagers V, Goriely S, Boutriaux M, Goldman M, Willems F. Impaired responses to toll-like receptor 4 and toll-like receptor 3 ligands in human cord blood. J Autoimmun. 2003;21:277–281. doi: 10.1016/j.jaut.2003.08.003. [DOI] [PubMed] [Google Scholar]
- Fleer A, Krediet TG. Innate Immunity: Toll-Like Receptors and Some More. A Brief History, Basic Organization and Relevance for the Human Newborn. Neonatology. 2007;92:145–157. doi: 10.1159/000102054. [DOI] [PubMed] [Google Scholar]
- Fraser P. Transcriptional control thrown for a loop. Curr Opin Genet Dev. 2006;16:490–495. doi: 10.1016/j.gde.2006.08.002. [DOI] [PubMed] [Google Scholar]
- Godfrey KM, Lillycrop KA, Burdge GC, Gluckman PD, Hanson MA. Epigenetic mechanisms and the mismatch concept of the developmental origins of health and disease. Pediatr Res. 2007;61:5R–10R. doi: 10.1203/pdr.0b013e318045bedb. [DOI] [PubMed] [Google Scholar]
- Goldberg AD, Allis CD, Bernstein E. Epigenetics: a landscape takes shape. Cell. 2007;128:635–638. doi: 10.1016/j.cell.2007.02.006. [DOI] [PubMed] [Google Scholar]
- Goren A, Simchen G, Fibach E, Szabo PE, Tanimoto K, Chakalova L, Pfeifer GP, Fraser PJ, Engel JD, Cedar H. Fine tuning of globin gene expression by DNA methylation. PLoS ONE. 2006;1:e46. doi: 10.1371/journal.pone.0000046. [DOI] [PMC free article] [PubMed] [Google Scholar]
- Goriely S, Van Lint C, Dadkhah R, Libin M, De Wit D, Demonte D, Willems F, Goldman M. A defect in nucleosome remodeling prevents IL-12(p35) gene transcription in neonatal dendritic cells. J Exp Med. 2004;199:1011–1016. doi: 10.1084/jem.20031272. [DOI] [PMC free article] [PubMed] [Google Scholar]
- Knudsen GP, Pedersen J, Klingenberg O, Lygren I, Orstavik KH. Increased skewing of X chromosome inactivation with age in both blood and buccal cells. Cytogenet Genome Res. 2007;116:24–28. doi: 10.1159/000097414. [DOI] [PubMed] [Google Scholar]
- Lang KS, Georgiev P, Recher M, Navarini AA, Bergthaler A, Heikenwalder M, Harris NL, Junt T, Odermatt B, Clavien PA, Pircher H, Akira S, Hengartner H, Zinkernagel RM. Immunoprivileged status of the liver is controlled by Toll-like receptor 3 signaling. J Clin Invest. 2006;116:2456–2463. doi: 10.1172/JCI28349. [DOI] [PMC free article] [PubMed] [Google Scholar]
- Lehner M, Holter W. Endotoxin-free purification of monocytes for dendritic cell generation via discontinuous density gradient centrifugation based on diluted Ficoll-Paque Plus. Int Arch Allergy Immunol. 2002;128:73–76. doi: 10.1159/000058006. [DOI] [PubMed] [Google Scholar]
- Levsky JM, Singer RH. Gene expression and the myth of the average cell. Trends Cell Biol. 2003;13:4–6. doi: 10.1016/s0962-8924(02)00002-8. [DOI] [PubMed] [Google Scholar]
- Levy O. Innate immunity of the newborn: basic mechanisms and clinical correlates. Nat Rev Immunol. 2007;7:379–390. doi: 10.1038/nri2075. [DOI] [PubMed] [Google Scholar]
- Levy O, Zarember KA, Roy RM, Cywes C, Godowski PJ, Wessels MR. Selective impairment of TLR-mediated innate immunity in human newborns: neonatal blood plasma reduces monocyte TNF-alpha induction by bacterial lipopeptides, lipopolysaccharide, and imiquimod, but preserves the response to R-848. J Immunol. 2004;173:4627–4634. doi: 10.4049/jimmunol.173.7.4627. [DOI] [PubMed] [Google Scholar]
- Lu BY, Eissenberg JC. Time out: developmental regulation of heterochromatic silencing in Drosophila. Cell Mol Life Sci. 1998;54:50–59. doi: 10.1007/s000180050124. [DOI] [PMC free article] [PubMed] [Google Scholar]
- Marahrens Y. X-inactivation by chromosomal pairing events. Genes Dev. 1999;13:2624–2632. doi: 10.1101/gad.13.20.2624. [DOI] [PubMed] [Google Scholar]
- Marodi L. Innate cellular immune responses in newborns. Clin Immunol. 2006;118:137–144. doi: 10.1016/j.clim.2005.10.012. [DOI] [PubMed] [Google Scholar]
- Mikkelsen TS, Ku M, Jaffe DB, Issac B, Lieberman E, Giannoukos G, Alvarez P, Brockman W, Kim TK, Koche RP, Lee W, Mendenhall E, O’Donovan A, Presser A, Russ C, Xie X, Meissner A, Wernig M, Jaenisch R, Nusbaum C, Lander ES, Bernstein BE. Genome-wide maps of chromatin state in pluripotent and lineage-committed cells. Nature. 2007;448:553–560. doi: 10.1038/nature06008. [DOI] [PMC free article] [PubMed] [Google Scholar]
- Ohm JE, McGarvey KM, Yu X, Cheng L, Schuebel KE, Cope L, Mohammad HP, Chen W, Daniel VC, Yu W, Berman DM, Jenuwein T, Pruitt K, Sharkis SJ, Watkins DN, Herman JG, Baylin SB. A stem cell-like chromatin pattern may predispose tumor suppressor genes to DNA hypermethylation and heritable silencing. Nat Genet. 2007;39:237–242. doi: 10.1038/ng1972. [DOI] [PMC free article] [PubMed] [Google Scholar]
- Ozanne SE, Constancia M. Mechanisms of disease: the developmental origins of disease and the role of the epigenotype. Nat Clin Pract Endocrinol Metab. 2007;3:539–546. doi: 10.1038/ncpendmet0531. [DOI] [PubMed] [Google Scholar]
- Pastinen T, Sladek R, Gurd S, Sammak A, Ge B, Lepage P, Lavergne K, Villeneuve A, Gaudin T, Brandstrom H, Beck A, Verner A, Kingsley J, Harmsen E, Labuda D, Morgan K, Vohl MC, Naumova AK, Sinnett D, Hudson TJ. A survey of genetic and epigenetic variation affecting human gene expression. Physiol Genomics. 2004;16:184–193. doi: 10.1152/physiolgenomics.00163.2003. [DOI] [PubMed] [Google Scholar]
- Prehaud C, Megret F, Lafage M, Lafon M. Virus infection switches TLR-3-positive human neurons to become strong producers of beta interferon. J Virol. 2005;79:12893–12904. doi: 10.1128/JVI.79.20.12893-12904.2005. [DOI] [PMC free article] [PubMed] [Google Scholar]
- Puck JM, Willard HF. X inactivation in females with X-linked disease. N Engl J Med. 1998;338:325–328. doi: 10.1056/NEJM199801293380611. [DOI] [PubMed] [Google Scholar]
- Rassoulzadegan M, Grandjean V, Gounon P, Vincent S, Gillot I, Cuzin F. RNA-mediated non-mendelian inheritance of an epigenetic change in the mouse. Nature. 2006;441:469–474. doi: 10.1038/nature04674. [DOI] [PubMed] [Google Scholar]
- Renshaw M, Rockwell J, Engleman C, Gewirtz A, Katz J, Sambhara S. Cutting edge: impaired Toll-like receptor expression and function in aging. J Immunol. 2002;169:4697–4701. doi: 10.4049/jimmunol.169.9.4697. [DOI] [PubMed] [Google Scholar]
- Rinn JL, Kertesz M, Wang JK, Squazzo SL, Xu X, Brugmann SA, Goodnough LH, Helms JA, Farnham PJ, Segal E, Chang HY. Functional demarcation of active and silent chromatin domains in human HOX loci by noncoding RNAs. Cell. 2007;129:1311–1323. doi: 10.1016/j.cell.2007.05.022. [DOI] [PMC free article] [PubMed] [Google Scholar]
- Rupon JW, Wang SZ, Gaensler K, Lloyd J, Ginder GD. Methyl binding domain protein 2 mediates gamma-globin gene silencing in adult human betaYAC transgenic mice. Proc Natl Acad Sci U S A. 2006;103:6617–6622. doi: 10.1073/pnas.0509322103. [DOI] [PMC free article] [PubMed] [Google Scholar]
- Russanova VR, Hirai TH, Howard BH. Semirandom sampling to detect differentiation-related and age-related epigenome remodeling. J Gerontol A Biol Sci Med Sci. 2004a;59:1221–1233. doi: 10.1093/gerona/59.12.1221. [DOI] [PubMed] [Google Scholar]
- Russanova VR, Hirai TH, Tchernov AV, Howard BH. Mapping development-related and age-related chromatin remodeling by a high throughput ChIP-HPLC approach. J Gerontol A Biol Sci Med Sci. 2004b;59:1234–1243. doi: 10.1093/gerona/59.12.1234. [DOI] [PubMed] [Google Scholar]
- Stamatoyannopoulos G, Grosveld F. Hemoglobin switching. In: Stamatoyannopoulos G, editor. The molecular basis of blood diseases. Saunders; Philadelphia: 2001. pp. 135–182. [Google Scholar]
- Thein SL, Craig JE. Genetics of Hb F/F cell variance in adults and heterocellular hereditary persistence of fetal hemoglobin. Hemoglobin. 1998;22:401–414. doi: 10.3109/03630269809071538. [DOI] [PubMed] [Google Scholar]
- Visintin A, Mazzoni A, Spitzer JH, Wyllie DH, Dower SK, Segal DM. Regulation of Toll-like receptors in human monocytes and dendritic cells. J Immunol. 2001;166:249–255. doi: 10.4049/jimmunol.166.1.249. [DOI] [PubMed] [Google Scholar]
- Yu M, Han H, Xiang P, Li Q, Stamatoyannopoulos G. Autonomous silencing as well as competition controls gamma-globin gene expression during development. Mol Cell Biol. 2006;26:4775–4781. doi: 10.1128/MCB.00406-06. [DOI] [PMC free article] [PubMed] [Google Scholar]
- Zhang J, Wei H, Wu D, Tian Z. Toll-like receptor 3 agonist induces impairment of uterine vascular remodeling and fetal losses in CBA x DBA/2 mice. J Reprod Immunol. 2007;74:61–67. doi: 10.1016/j.jri.2006.10.005. [DOI] [PubMed] [Google Scholar]
Associated Data
This section collects any data citations, data availability statements, or supplementary materials included in this article.
Supplementary Materials
ChIP-on-chip analyses of TLR genes. Chromatin was prepared from purified adult MO and in vitro-differentiated DC, followed by chromatin immunoprecipitation using a polyclonal anti-acetylated H3/H4 antibody. Samples were amplified, labeled, and hybridized to a custom designed oligonucleotide-array (Agilent). Relative acetylation levels are shown as ratios of bound DNA signal to input. Bars depict positions of probes represented on the chip. Data show results for 50 Kb regions (NCBI build 36) centered around TLR transcriptional start sites (arrows).