

Abstract
With the epidemic of obesity, nonalcoholic fatty liver disease (NAFLD) has become the most common pediatric liver disease. The influence of a perinatal obesity‐inducing diet (OID) on the development and progression of NAFLD in offspring is important but incompletely studied. Hence, we fed breeding pairs of C57BL/6J mice during gestation and lactation (perinatally) either chow or an OID rich in fat, fructose, and cholesterol (FFC). The offspring were weaned to either chow or an FFC diet, generating four groups: perinatal (p)Chow‐Chow, pChow‐FFC, pFFC‐Chow, and pFFC‐FFC. Mice were sacrificed at 10 weeks of age. We examined the whole‐liver transcriptome by RNA sequencing (RNA‐seq) and whole‐liver genome methylation by reduced representation bisulfite sequencing (RRBS). Our results indicated that the pFFC‐FFC mice had a significant increase in hepatic steatosis, injury, inflammation, and fibrosis, as assessed histologically and biochemically. We identified 189 genes that were differentially expressed and methylated in the pFFC‐FFC mice versus the pChow‐FFC mice. Gene set enrichment analysis identified hepatic fibrosis/hepatic stellate cell activation as the top canonical pathway, suggesting that the differential DNA methylation events in the mice exposed to the FFC diet perinatally were associated with a profibrogenic transcriptome. To verify that this finding was consistent with perinatal nutritional reprogramming of the methylome, we exposed pFFC‐Chow mice to an FFC diet in adulthood. These mice developed significant hepatic steatosis, injury, inflammation, and more importantly fibrosis when compared to the appropriate controls. Conclusion: Perinatal exposure to an OID primes the immature liver for an accentuated fibrosing nonalcoholic steatohepatitis (NASH) phenotype, likely through nutritional reprogramming of the offspring methylome. These data have potential clinical implications for monitoring children of obese mothers and risk stratification of children with NAFLD.
Abbreviations
- ALT
alanine aminotransferase
- ccr2
C‐C chemokine receptor type 2
- cidec
cell death‐inducing DNA fragmentation factor‐like effector C
- col1a1
collagen 1a1
- DEG
differentially expressed gene
- DMR
differentially methylated region
- eWAT
epididymal white adipose tissue
- FFC
fat, fructose, and cholesterol
- gapdh
glyceraldehyde 3‐phosphate dehydrogenase
- H&E
hematoxylin and eosin
- HOMA‐IR
homeostasis model assessment of insulin resistance
- il‐1/6
interleukin‐1/6
- IPA
Ingenuity Pathway Analysis
- JNK
c‐Jun N‐terminal kinase
- ly6c
lymphocyte antigen 6 complex
- Mac‐2
macrophage galactose‐specific lectin
- mRNA
messenger RNA
- 5‐mC
5‐methylcytosine
- NAFLD
nonalcoholic fatty liver disease
- NAS
NAFLD activity score
- NASH
nonalcoholic steatohepatitis
- Nfκb
nuclear factor kappa B
- ns
not significant
- OID
obesity‐inducing diet
- p
perinatal
- pdgfrβ
platelet‐derived growth factor receptor beta
- pdgfβ
platelet‐derived growth factor beta
- pparα
peroxisome proliferator‐activated receptor alpha
- RNA‐seq
RNA sequencing
- RRBS
reduced representation bisulfite sequencing
- RT‐PCR
real‐time polymerase chain reaction
- smad
smad family member
- α‐sma
alpha smooth muscle actin
- tgf‐β
transforming growth factor beta
- tnf‐α
tumor necrosis factor alpha
- TUNEL
terminal deoxynucleotidyl transferase‐mediated deoxyuridine triphosphate nick‐end labeling
- XIAP
X‐linked inhibitor of apoptosis
Although the prevalence of childhood obesity varies with age, the overall trend during the last 3 decades has been upward, with obesity currently affecting 8.9% of children between 2 and 5 years of age, 17.5% of children between 6 and 11 years of age, and 20.5% of children between 12 and 19 years of age.1 With the epidemic of obesity, NAFLD has become the most common pediatric liver disease, with an estimated prevalence of 11%.2
A subset of patients with NAFLD develop NASH, characterized by hepatic fibrosis and inflammation in addition to steatosis. It is estimated that 44% of adults with NALFD will progress to NASH over a median interval of 6.6 years.3 NASH fibrosis is the most important prognostic liver feature, with a positive correlation to mortality and the need for liver transplantation.4 Thus, NASH has become a common indication for liver transplant in adults and has the most rapidly growing rate for transplant.5 Although the natural history of pediatric NAFLD is not well understood, several studies have suggested a high rate of type 2 diabetes and a high prevalence and persistence of obesity into young adulthood6 as well as shorter survival.7 However, the cellular and molecular mechanisms culminating in pediatric NASH pathogenesis remain poorly understood, and no effective regulatory agency‐approved pharmacologic therapy has been identified to date.
Evaluation of data from the U.S. National Health and Nutrition Examination Survey yielded a prevalence of obesity of 31.8% among women of reproductive age.8 Maternal obesity has been recognized as an important factor in the development of the metabolic syndrome, insulin resistance, and NAFLD in the offspring.9 Additionally, animal studies have shown that in utero exposure to a high‐fat diet, independent of maternal obesity, primes the offspring liver for development of NAFLD.10 These findings indicate an interplay between the fetal and maternal environment as well as a regulatory role of maternal nutrition on the fetal gene expression profile.
Epigenetic events cause persistent changes in gene expression and cell phenotype in response to developmental and environmental cues without directly altering the DNA base sequence.11, 12 Experimental manipulation of epigenetic signatures, such as DNA methylation, can have profound effects on the activation and phenotype of hepatic stellate cells, key cells responsible for the onset and progression of liver fibrosis.13 Furthermore, recent publications have linked early nutrition, epigenetic processes, and chronic diseases14 and have attributed circulating DNA methylation signatures to the severity of liver fibrosis in adult patients with NASH.15
Given the long‐term biomedical and public health implications, we elected to further examine the impact of in utero and early life (perinatal) exposure to an OID on the development and progression of NAFLD in the offspring and more importantly the possible epigenetic alterations secondary to such perinatal exposure. In this study, we demonstrate that perinatal exposure to an OID accentuates NASH fibrosis partially through epigenetic reprogramming as manifested by alterations in the methylome and eventually the transcriptome.
Materials and Methods
Animals
Breeding pairs of C57Bl/6J mice were purchased from Jackson Laboratory (Bar Harbor, ME). Mice were housed in a temperature‐controlled 12:12‐hour light/dark cycle facility with free access to diet. Breeding pairs were fed either a chow diet (5053 PicoLab Rodent Diet 20, LabDiet, St Louis, MO) or a diet rich in FFC for 6‐8 weeks before conception. The FFC diet consisted of 40% energy as fat (12% saturated fatty acid, 0.2% cholesterol) (AIN‐76A Western Diet; TestDiet, St Louis, MO), with fructose (23.1 g/L final concentration) and glucose (18.9 g/L) in the drinking water. The FFC diet induces steatohepatitis with pronounced hepatocellular ballooning, lipoapoptosis, and progressive fibrosis that has a high fidelity to the human NASH histology and metabolic profile.16 Breeding pairs continued on their corresponding diet during the gestation period and were maintained on the diet throughout lactation. We defined the perinatal (p) period as the time including gestation and lactation. Male offspring were used because there is an inherent difference between sexes and their response to diet‐induced NASH, with estrogen likely playing a protective role in females.17 Male mice have more fidelity to the human NASH phenotype and appear to be more responsive to the FFC diet, as suggested by the significant increase in alanine aminotransferase (ALT) level, body weight, and liver to body weight compared to age‐matched female breeders (Supporting Fig. S1). Offspring were weaned to either the FFC or chow diet, generating four experimental groups: pFFC‐FFC (n = 12), pFFC‐Chow (n = 9), pChow‐FFC (n = 11), and pChow‐Chow (n = 12) (Fig. 1A). Mice were sacrificed at 10 weeks of age (Fig. 1A). Some of the pFFC‐Chow and pChow‐Chow mice were not sacrificed but were switched to the FFC diet (pFFC‐Chow‐FFC [n = 4] and pChow‐Chow‐FFC [n = 5]) for an additional 12 weeks before being sacrificed at 22 weeks of age. We refer to these two experimental groups as the re‐exposure cohorts; they were designed to evaluate priming of the liver by perinatal FFC exposure and were compared to age‐matched chow‐fed control mice (n = 5). Additionally, we used FFC‐fed mice (n = 3) from adulthood (8‐10 weeks of age) through the age of 30 weeks with the appropriate age‐matched chow‐fed mice (n = 3) to compare the transcriptome when the diet is introduced early in life versus in adulthood. Mice were sacrificed under general anesthesia induced by a ketamine/xylazine cocktail (83 mg/kg ketamine/16 mg/kg xylazine, intraperitoneal). All interventions, including sacrifice, were made during the light cycle. Blood, epididymal white adipose tissue (eWAT), and liver samples were collected. Study protocols were conducted as approved by the Institutional Animal Care and Use Committee (IACUC) of Mayo Clinic. The methods employed in the current study were carried out in accordance with the IACUC guidelines for the use of anesthetics in experimental mice.
Figure 1.
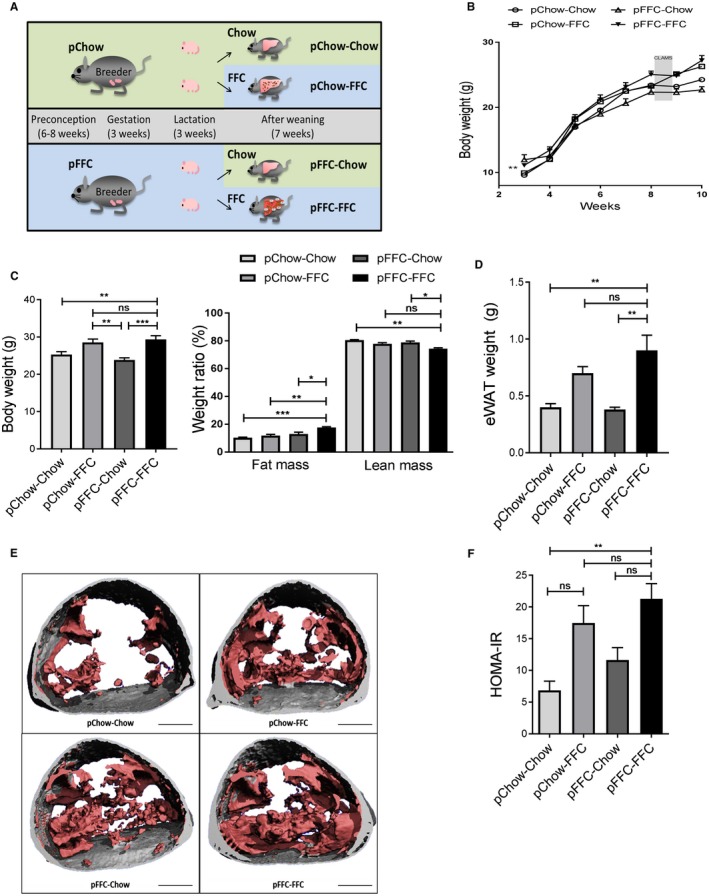
Metabolic phenotype of mice from the different experimental groups. (A) C57BL/6J breeding pairs were started on either chow or an FFC diet 6‐8 weeks before conception and stayed on the diet throughout gestation and lactation. At weaning, offspring continued on the same diet as the breeding pairs or switched to the other available diet, resulting in four study groups. (B) Life curve from weaning to sacrifice (n = 4‐5). (C) Body weight at the time of sacrifice (n = 4‐5) and weight ratio of lean mass and fat mass (%) (n = 4‐5). (D) eWAT weight at the time of sacrifice (n = 4‐5). (E) Microcomputed tomography images with the visceral fat highlighted in pink and subcutaneous fat in gray in the lumbar region of mice from the different study groups (scale bar, 5 mm). (F) HOMA‐IR (n = 3) calculated from fasting glucose and insulin levels. Data points (B) and bar columns (C,D,F) represent mean ± SEM. *P < 0.05, **P < 0.01, ***P < 0.001. Abbreviation: CLAMS, Comprehensive Lab Animal Monitoring System.
Results
Metabolic Phenotype of Mice from the Different Experimental Groups
At weaning, offspring of the FFC‐fed breeders had a higher body weight than offspring of the chow‐fed breeders. The life curve of all cohorts demonstrated a steady increase in weight during the study time, with a plateau caused by the stress of subjecting the mice to metabolic phenotyping (Fig. 1B). Total body weight at sacrifice was significantly increased in the pFFC‐FFC mice cohort compared to all other cohorts. However, no statistical significance was seen when compared to the pChow‐pFFC cohort. The difference in weight was noted to be secondary to a change in body mass composition, with the pFFC‐FFC group having a higher fat mass and lower lean mass compared to the other groups (Fig. 1C). Additionally, the pFFC‐FFC mice had a significant increase in visceral fat, evident by the weight of the eWAT (Fig. 1D) and the microcomputed tomography scans of the lumbar region (Fig. 1E). Caloric intake at week 7 was not significantly different among the mice from the different experimental groups (Supporting Fig. S2A). This finding is consistent with prior studies demonstrating that obesogenic diets have a robust caloric intake increase in the long term only when there is variability and high palatability. Otherwise, only short‐term effects are seen.18 The pFFC‐FFC cohort developed insulin resistance, as assessed by the homeostasis model assessment of insulin resistance (HOMA‐IR) (Fig. 1F). In addition to evaluating insulin resistance through HOMA‐IR, all cohorts underwent a glucose tolerance test, which demonstrated a significant increase in the area under the curve in the FFC‐fed mice, suggesting islet β cell dysfunction in the pFFC‐FFC and pChow‐FFC groups (Supporting Fig. S2B). As noted by the respiratory quotient, no difference was observed in macronutrient utilization across the cohorts during the fed state (Supporting Fig. S2C). Likewise, energy expenditure and physical activity were comparable across all cohorts (Supporting Fig. S2C). Taken together, these data suggest that exposure to the FFC diet starting at the time of gestation predisposes to increased body weight and adiposity, without significant alteration of energy expenditure.
pFFC Diet Enhances the Development of Hepatic Steatosis in the Offspring
Histologic examination of the liver by hematoxylin and eosin (H&E) stain indicated a significant increase in hepatic steatosis in the pFFC‐FFC group compared to the other study groups at 10 weeks (Fig. 2A). Steatosis assessment by coherent anti‐Stokes Raman scattering microscopy demonstrated similar results (Fig. 2B). Moreover, the liver triglyceride content was significantly increased in the pFFC‐FFC group when compared to the other experimental groups (Fig. 2C) (no statistical significance was seen when compared to the pChow‐pFFC cohort), and the liver weight and liver to body weight ratio were overall similar among the groups (Fig. 2D). Taken together, these data suggest that antenatal exposure to the FFC diet increases hepatic steatosis without a significant increase in liver mass and is likely secondary to enhanced hepatocyte lipoapoptosis, as discussed below.
Figure 2.
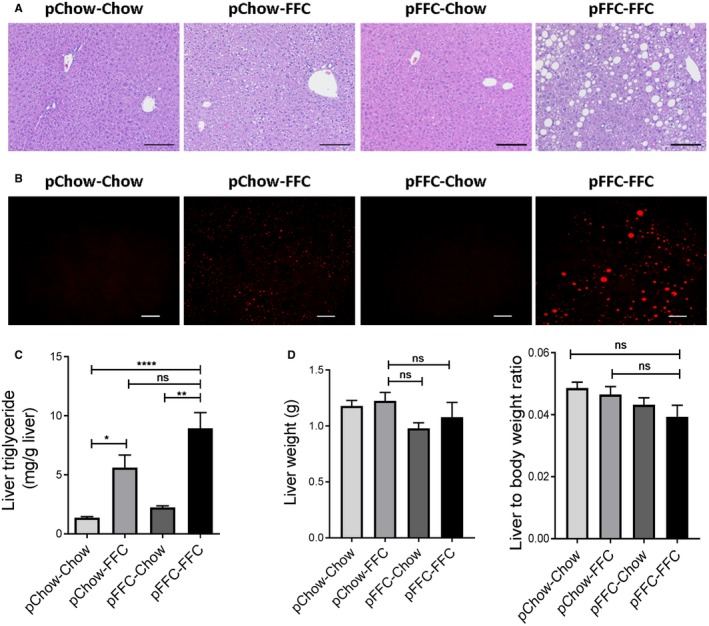
pFFC‐FFC mice develop prominent hepatic steatosis. (A) Fixed liver tissues were stained with H&E (scale bar, 100 µm). (B) Label‐free frozen liver tissue sections were imaged by coherent anti‐Stokes Raman scattering microscopy to visualize lipid droplets using a 25× objective (scale bar, 50 µm). (C) Liver triglyceride content (mg/g liver) was measured using a photometric absorbance‐based technique (n = 4‐7). (D) Liver weight and liver to body weight ratio were calculated (n = 4‐5). Bar columns represent mean ± SEM. *P < 0.05, **P < 0.01, ****P < 0.0001.
Perinatal Introduction of the FFC Diet Exacerbates Macrophage‐Associated Hepatic Inflammation in the Offspring
Given the crucial role of both resident macrophage and monocyte‐derived macrophage in NASH pathogenesis,19 we assessed hepatic macrophage infiltration by immunohistochemistry for macrophage galactose‐specific lectin (Mac‐2), a marker of phagocytically active macrophages20 (Fig. 3A). The pFFC‐FFC group had a higher Mac‐2‐immunopositive surface area (Fig. 3B) when compared to the other experimental groups. Likewise, the pFFC‐FFC group had a significant increase in the hepatic messenger RNA (mRNA) expression of the general macrophage marker f4/80 21 (Fig. 3C) and blood monocyte‐derived macrophage markers C‐C chemokine receptor type 2 (ccr2) and the inflammatory monocyte surface lymphocyte antigen 6 complex (ly6c)22 (Fig. 3D). Furthermore, mRNA expression of the macrophage activation marker tumor necrosis factor alpha (tnf‐α) (Fig. 3E) was also significantly increased in the pFFC‐FFC group. Taken together, these data demonstrate an increase in proinflammatory monocyte‐derived macrophage hepatic infiltration and activation in the pFFC‐FFC group when compared to the other experimental groups; this is likely secondary to perinatal exposure to the FFC diet.
Figure 3.
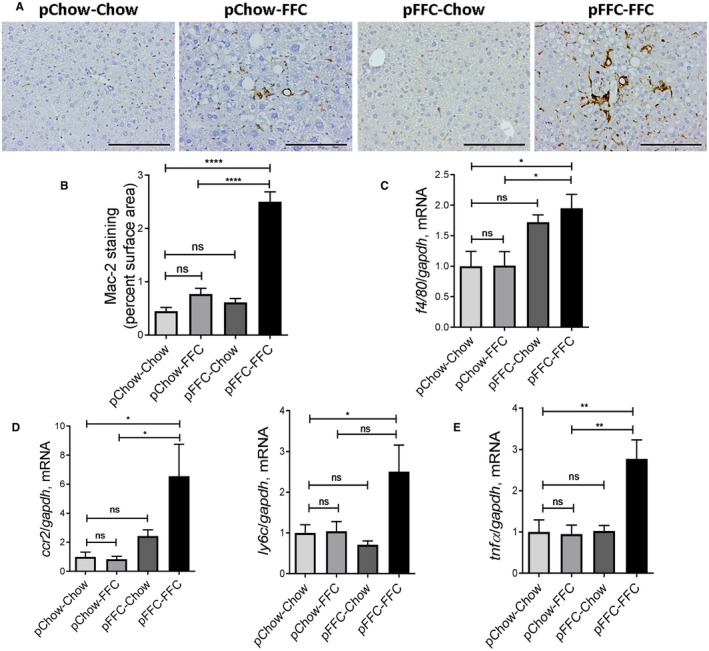
pFFC‐FFC mice have accentuated macrophage‐associated hepatic inflammation. (A) Macrophage infiltration was evaluated by immunohistochemistry for Mac‐2 antigen (scale bar, 100 µm). (B) Mac‐2 staining was quantified by morphometry using ImageJ software in 10 random 20× microscopic fields and averaged for each animal (n = 3). Total RNA was extracted from liver tissue. The mRNA expression of (C) general macrophage marker f4/80 (n = 6), (D) markers associated with monocyte‐derived infiltrating macrophages ccr2 and ly6c (n = 6), and (E) the cytokine tnf‐α (n = 6) were assessed by RT‐PCR. Fold change was determined after normalization to gapdh expression in liver tissue and expressed relative to that observed in pChow‐Chow mice. Bar columns represent mean ± SEM. *P < 0.05, **P < 0.01, ****P < 0.0001.
Perinatal Exposure to the FFC Diet Induces Significant Liver Injury in the Offspring
We measured the serum ALT level to assess the liver injury induced by the FFC diet. The ALT level was significantly elevated in the pFFC‐FFC group (ALT mean, 127 U/L) when compared to the other experimental groups (Fig. 4A). The influence of the FFC diet on the offspring liver injury was also demonstrated by assessing liver histologic sections of mice from the different experimental groups, using the NAFLD activity score (NAS), a semiquantitative score that accounts for steatosis, ballooned hepatocytes, and lobular inflammation.23 The NAS was significantly increased in pFFC‐FFC mice (Fig. 4B). As a component of NAS, ballooned hepatocytes provide information on liver injury. Mallory‐Denk bodies, found within ballooned hepatocytes, are cytoplasmic hyaline inclusions of keratin intermediate filaments that have been described in NASH.24 Histologic examination of the H&E‐stained liver indicated the presence of Mallory‐Denk bodies in the pFFC‐FFC group (Supporting Fig. S3A). This was further validated by immunohistochemistry for cytokeratin‐18 (Supporting Fig. S3B), which is a marker of keratin intermediate filaments found in ballooned hepatocytes.25
Figure 4.
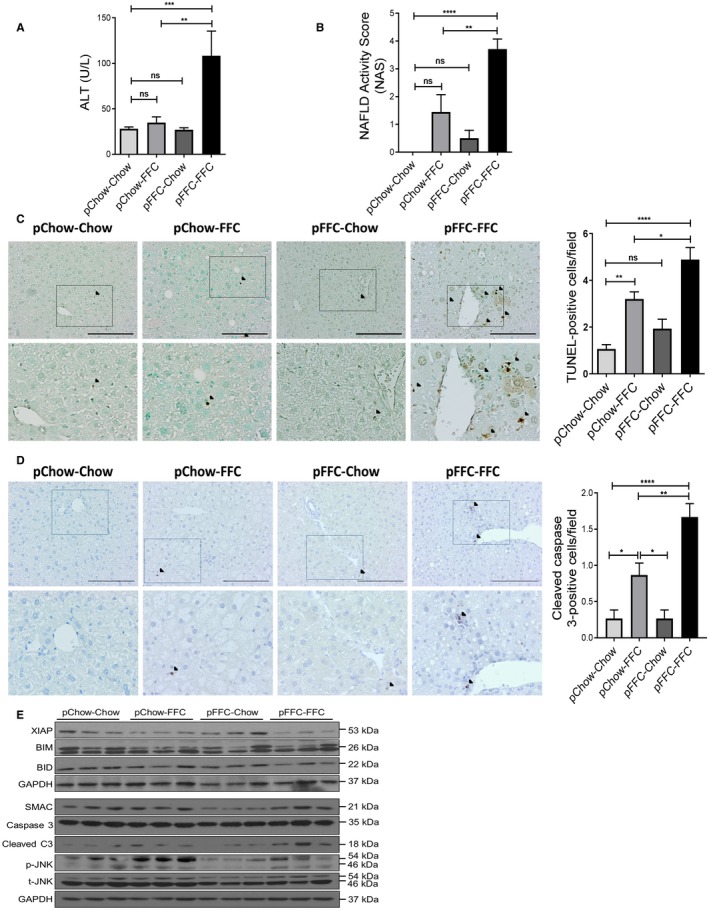
pFFC‐FFC mice have significant liver injury. (A) ALT (U/L) levels were measured (n = 4‐6). (B) Liver histology was assessed using the NAS. (C) Hepatocyte apoptosis was assessed by the TUNEL assay (scale bar, 100 µm). Brown‐stained apoptotic nuclei (black arrowheads) were quantified by counting nuclei in 10 random 20× microscopic fields per animal (n = 3). (D) Cleaved caspase 3 immunohistochemistry was performed to assess hepatocyte apoptosis (scale bar, 100 µm); bottom row contains images enlarged from the boxed area in the corresponding panel in the top row. Positive cells (black arrowheads) were quantified by counting nuclei in 10 random 20× microscopic fields per animal (n = 3). (E) Immunoblot was used to assess XIAP, BIM, BID, SMAC, C3, p‐JNK, and t‐JNK protein levels in whole‐mouse liver lysates from the different experimental groups; GAPDH was used as a loading control. Bar columns represent mean ± SEM. *P < 0.05, **P < 0.01, ***P < 0.001, ****P < 0.0001. Abbreviations: BID, BH3 interacting‐domain death agonist; BIM, Bcl‐2‐like protein 11; C3, cleaved caspase 3; p‐JNK, phosphorylated JNK; SMAC, second mitochondrial‐derived activator of caspases; t‐JNK, total‐JNK.
Likewise, pFFC‐FFC mice had significant lipoapoptosis, as demonstrated by a significant increase in the number of terminal deoxynucleotidyl transferase‐mediated deoxyuridine triphosphate nick‐end labeling (TUNEL)‐positive cells (Fig. 4C). Additionally, increased apoptosis in pFFC‐FFC mice was also confirmed by immunohistochemistry for cleaved caspase 3 (Fig. 4D). To further study the signaling mechanism and molecular mediators involved in apoptosis, we assessed the protein levels of the effector caspase, cleaved caspase 3, in the different experimental groups and noted a distinct increase in the pFFC‐FFC and pChow‐FFC groups (pFFC‐FFC > pChow‐FFC) compared to the other two experimental groups (Fig. 4E). Equal expression of caspase 3 was noted; this represents the same availability and concentration of the inactive proenzyme across all groups. Effector caspases are regulated by the anti‐apoptotic protein X‐linked inhibitor of apoptosis (XIAP).26 Interestingly, the expression of XIAP was suppressed in the pFFC‐FFC and pChow‐FFC groups compared to the other two study groups (Fig. 4E). This lower expression of XIAP was likely permissive of a higher expression of cleaved caspase 3 in the pFFC‐FFC group, which in turn primed the developing liver of the FFC mice to significant lipoapoptosis and liver injury. Moreover, the mitochondrial protein second mitochondrial‐derived activator of caspases (SMAC), which is an inhibitor of XIAP,26 was not differentially expressed among the study groups. Other proapoptotic proteins, including BH3 interacting‐domain death agonist (BID) and Bcl‐2‐like protein 11 (BIM), were expressed uniformly across all study groups. Phosphorylated c‐Jun N‐terminal kinase (p‐JNK), a proapoptotic kinase, was increased in the pChow‐FFC group, suggesting that JNK is activated with postweaning exposure to the FFC diet (Fig. 4E). Taken together, the pFFC‐FFC mice have significant liver injury and lipoapoptosis, likely secondary to reduced XIAP expression and JNK activation.
Perinatal Introduction of the FFC Diet Accentuates Liver Fibrosis
We used sirius red staining to identify the extent of collagen deposition in liver sections. Sirius red‐positive surface area was significantly increased in the pFFC‐FFC mice (Fig. 5A) when compared to the other experimental groups. These findings were confirmed by immunohistochemistry for alpha smooth muscle actin (α‐SMA) (Fig. 5B) and further validated by second harmonic generation microscopy to visualize collagen fibril deposition (Fig. 5C). Furthermore, we examined the expression of profibrogenesis genes, including collagen 1a1 (col1a1) and α‐sma, and identified a significant increase in mRNA levels of these genes in the pFFC‐FFC mice (Fig. 5D). Thus, pFFC‐FFC mice have early onset significant liver fibrosis, likely secondary to perinatal exposure to an FFC diet and nutritional reprogramming.
Figure 5.
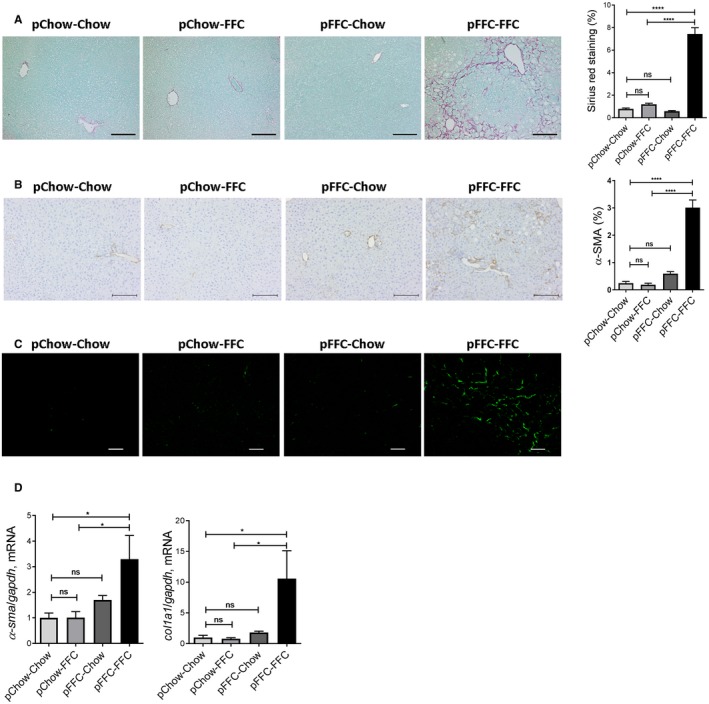
pFFC‐FFC mice have accentuated liver fibrosis. (A) Fixed liver tissue sections were stained by sirius red to detect collagen deposition (scale bar, 100 µm). Sirius red chromogen was quantified by morphometry using ImageJ software in 10 random 20× microscopic fields and averaged for each animal (n = 3). (B) Immunohistochemistry for α‐SMA (scale bar, 100 µm). α‐SMA staining was quantified by morphometry using ImageJ software in 10 random 20× microscopic fields and averaged for each animal (n = 3). (C) Frozen liver tissue sections were examined by second harmonic generation microscopy to visualize collagen deposition using a 25× objective (scale bar, 50 µm). Total RNA was extracted from the liver tissues. The mRNA expression of (D) the profibrogenic markers col1a1 and α‐sma (n = 6) were assessed by RT‐PCR. Fold change was determined after normalization to gapdh expression in liver tissue and expressed relative to that observed in pChow‐Chow mice. Bar columns represent mean ± SEM. *P < 0.05, ****P < 0.0001.
Perinatal Introduction of the FFC Diet Induces a Profibrogenic and Proinflammatory Gene Expression Signature
To assess the impact of the FFC diet on offspring transcriptome, we examined the differentially expressed genes by RNA‐seq of the whole liver of mice from the different experimental groups. Unsupervised hierarchical clustering analysis of gene expression profiles across all groups demonstrated a distinct difference between the pFFC‐FFC mice and the other study groups (Fig. 6A). In addition, differentially expressed genes in the pFFC‐FFC cohort clustered similar to the FFC‐fed adult mice. The FFC‐fed adult mice were introduced as a comparison arm for the development of NASH; these mice were initiated on the FFC diet at 8 weeks of age and continued this diet for a total of 24 weeks. Further analysis of whole‐liver transcriptome was done using the pChow‐Chow group as a control. This analysis revealed a total of 1,287 differentially expressed genes (DEGs) in the pFFC‐FFC group, with the majority of these genes being up‐regulated (Fig. 6B). Some of these DEGs overlapped with the other study groups, as shown in the Venn diagram (Fig. 6C). Ingenuity Pathway Analysis (IPA) identified a striking difference in the enriched signaling of the top canonical pathways involved in hepatic fibrosis and hepatic stellate cell activation, agranulocyte adhesion and diapedesis, atherosclerosis signaling, and granulocyte adhesion and diapedesis, among others, between the pFFC‐FFC group and the other study groups (Fig. 6D). Similarly, liver biological functions, including liver hyperplasia and proliferation, cirrhosis, damage, inflammation, steatosis, and fibrosis, were predicted to be highly activated in the pFFC‐FFC mice (Fig. 6E). Among the most important predicted upstream regulators were signaling molecules involved in inflammation and fibrosis, such as nuclear factor kappa b (nfκb), interferon gamma (ifnγ), interleukin‐1 (il‐1), il‐6, transforming growth factor beta (tgf‐β), and peroxisome proliferator‐activated receptor alpha (pparα) (Fig. 6F). Thus, the antenatal exposure to the FFC diet induces a profibrogenic and proinflammatory transcriptome, culminating in the accentuated NASH phenotype in the offspring.
Figure 6.
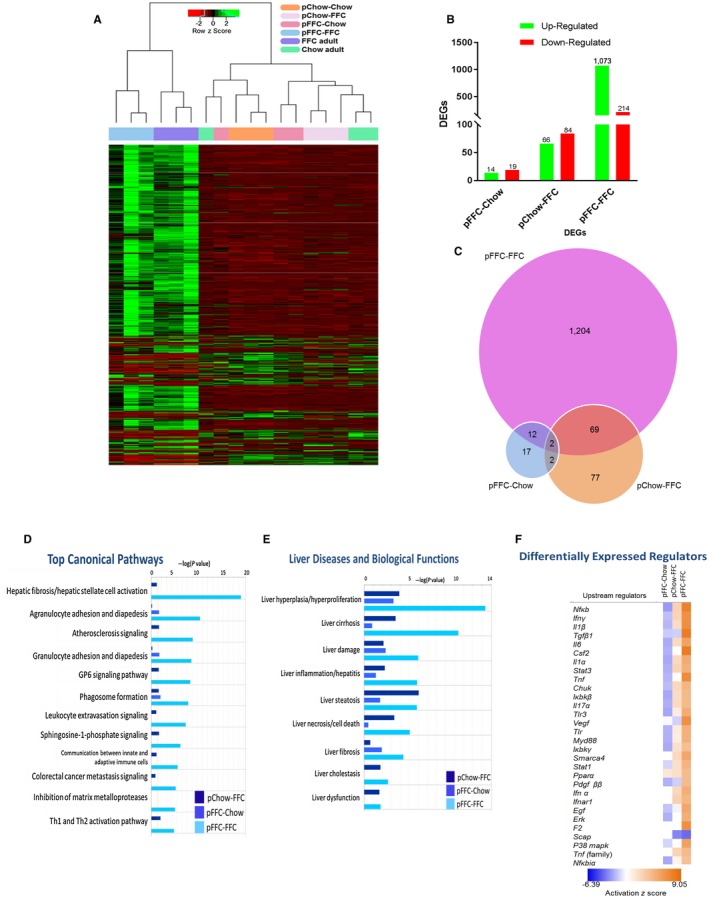
Perinatal introduction of the FFC diet induces a profibrogenic and proinflammatory transcriptome in the offspring. (A) Unsupervised hierarchical clustering heat map of gene expression profiles of the study groups as well as adult chow‐fed and FFC‐fed mice. Study groups were sacrificed at 10 weeks and FFC‐fed adult and chow‐fed adult mice at 32 weeks of age (n =3). (B) The number of DEGs in the pFFC‐Chow, pChow‐FFC, and pFFC‐FFC groups when compared to pChow‐Chow. (C) Venn diagram for unique and common DEGs among study groups. IPA demonstrating (D) the top enriched canonical pathways, (E) the top liver diseases and biological functions, and (F) the top upstream regulators of the pFFC‐Chow, pChow‐FFC, and pFFC‐FFC groups when compared to pChow‐Chow. Abbreviations Chuk, conserved helix‐loop‐helix ubiquitous kinase; Csf2, colony stimulating factor 2; Egf, epidermal growth factor; Erk, extracellular regulated mitogen‐activated protein kinase; F2, coagulation factor II; Ifn, interferon; Iκbk, inhibitor of kappa B kinase; Myd88, myeloid differentiation primary response gene 88; P38 mapk, P38 mitogen‐activated protein kinase; Scap, sterol regulatory element‐binding protein chaperone; Smarca4, switch/sucrose nonfermentable‐related, matrix‐associated, actin‐dependent regulator of chromatin, subfamily a, member 4; Stat, signal transducer and activator of transcription; Tlr, toll‐like receptor; Vegf, vascular endothelial growth factor.
Particular attention was given to the pChow‐FFC versus the pFFC‐FFC mice as differences in transcriptome can be interpreted to be secondary to prenatal and early life exposure to the FFC diet. The pFFC‐FFC mice had differentially expressed transcription factors involved in fibrosis, including smad family member (smad) 3, smad 4, and smad 7 (Supporting Table S1) as well as differentially expressed profibrogenic chemokines, including C‐X‐C motif chemokine ligand 2 (cxcl2), C‐C motif chemokine ligand 22 (ccl22), and ccl3 (Supporting Table S2), when compared to the pChow‐FFC group. In addition, the pFFC‐FFC group had differentially expressed profibrogenic epigenetic regulators, including DNA methyltransferase 3 alpha (dnmt3a), dnmt3β, tet methylcytosine dioxygenase 3 (tet3), and tet2 (Supporting Table S3). Moreover, DEGs were found to be interrelated and to converge in different types of liver injury networks, such as liver fibrosis (Supporting Fig. S4A) and liver inflammation (Supporting Fig. S4B). Taken together, these data indicate that perinatal exposure to the FFC diet induces a proinflammatory and profibrogenic transcriptome and more interestingly modifies the expression of profibrogenic epigenetic regulators.
Perinatal Introduction of the FFC Diet Induces a Profibrogenic and Proinflammatory Methylome in the Offspring
To explore if the differential gene expression observed in the pFFC‐FFC mice was secondary to reprogramming of the DNA methylome, we performed whole‐liver genome methylation by RRBS in all study groups. Principal component analysis showed a clear separation between the pFFC‐FFC mice and the other study groups (Fig. 7A). The global methylation pattern of all study groups was homogeneous (Fig. 7B), which is consistent with the findings in other noncancer studies showing no global differences in DNA methylation in diet‐based mouse models.27 This finding was further confirmed by quantification of the 5‐methylcytosine (5‐mC) content of DNA samples from all experimental groups by using the MethylFlash Global DNA Methylation (5‐mC) Enzyme‐Linked Immunosorbent Assay Easy Kit (Fig. 7B). Because DNA methylation often occurs in a cluster/region, we examined the differentially methylated regions (DMRs) scattered across the genome of mice from the pChow‐FFC, pFFC‐Chow, and pFFC‐FFC groups, using the pChow‐Chow group as the control group. Statistically significant differentially methylated CpG sites were used to detect DMRs, including a minimum length of the DMR of 50 base pairs and a minimum number of three CpG sites, with a percentage of CpG sites with significant P values greater than 50%. Additionally, nearby DMRs were merged if they were within 100 base pairs. Further analysis was done using the pChow‐Chow group as a control. We identified a total of 195 (128 hypermethylated, 68 hypomethylated), 283 (166 hypermethylated, 117 hypomethylated), and 1,158 (859 hypermethylated, 299 hypomethylated) DMRs in the pChow‐FFC, pFFC‐Chow, and pFFC‐FFC mice, respectively, when compared to the control group pChow‐Chow. The majority of the DMRs were located in introns, followed by intergenic, exons, and promoters (Supporting Fig. S5A). IPA of these DMRs identified enrichment in liver diseases and biological functions, including liver necrosis/cell death, liver fibrosis, and liver cirrhosis, among others, with the pFFC‐FFC group having the most enrichment (Fig. 7C).
Figure 7.
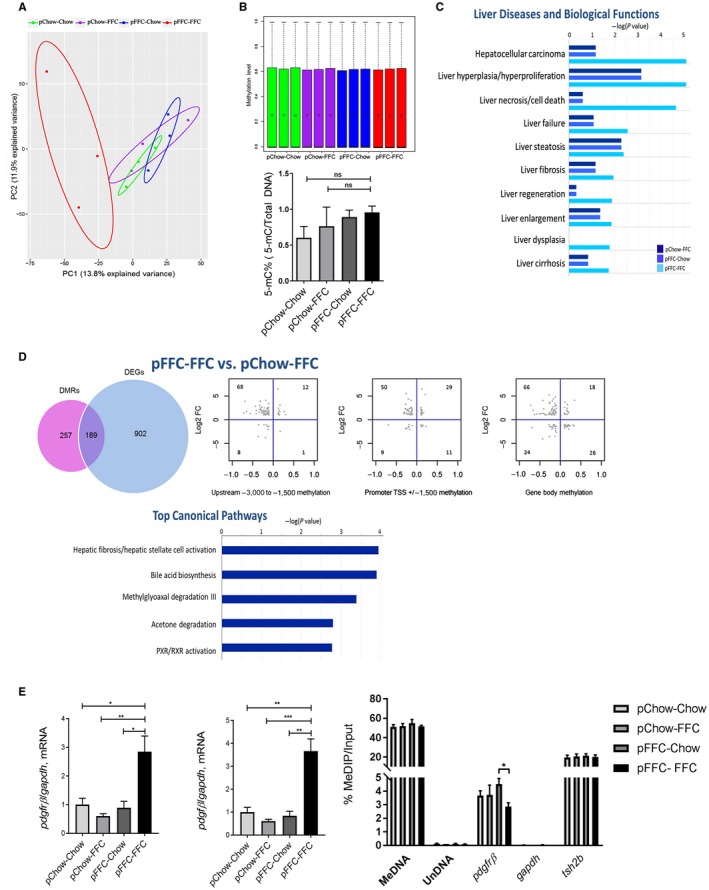
Perinatal introduction of the FFC diet induces a profibrogenic and proinflammatory methylome in the offspring. (A) PCA for DNA methylation of CpG sites. (B) Upper panel: box plot of DNA methylation levels of all study groups, as assessed by RRBS; circles represent the mean, black bars represent the median, and dotted lines are the top whisker. Bottom panel: global DNA methylation levels of all study groups, as assessed by the MethylFlash Kit. (C) IPA demonstrating the top liver diseases and biological functions in the pFFC‐Chow, pChow‐FFC, and pFFC‐FFC groups when compared to pChow‐Chow. (D) Venn diagram of DEGs and DMRs, scatter plots of relative methylation density (x axis) versus relative expression density (y axis), and IPA demonstrating the top enriched canonical pathways of genes found to be differentially methylated and expressed in pChow‐FFC versus FFC‐FFC. (E) The profibrogenic markers pdgfrβ and pdgfβ (n = 3) were assessed by RT‐PCR. Fold change was determined after normalization to gapdh expression in liver tissue and expressed relative to that observed in pChow‐Chow mice and degree of methylation of pdgfrβ, as assessed by MeDIP assay using DNA from whole‐liver mice and MeDNA and UnDNA internal controls. The enriched DNA was quantified by RT‐PCR using gapdh and tsh2b as negative and positive controls, respectively. The amount of immunoprecipitated DNA in each sample is represented as signal relative to the total amount of input DNA. *P < 0.05, **P < 0.01, ***P < 0.001. Abbreviations: MeDIP, methylated DNA immunoprecipitation; MeDNA, methylated DNA; PXR, pregnane X receptor; RXR, retinoid X receptor; tsh2b, testis‐specific histone h2b; TSS, transcription start site; UnDNA, unmethylated DNA.
We then analyzed the interplay between DNA methylation and gene expression to define methylation changes linked to expression changes; this would help identify functionally significant differentially methylated events. DEGs with at least a log fold change of |1| were included, and then methylation changes within the gene with at least a delta of 10% were selected and categorized depending on the following locations within the gene: upstream of the promoter, promoter, and gene body (some genes had a significant change in methylation in more than one location). We noted that when compared to pChow‐Chow, the pFFC‐FFC group had the largest number of genes that were both differentially expressed and differentially methylated (Supporting Fig. S5C). More importantly, the majority of the DEGs that met these criteria were negatively correlated with methylation changes in this group.
Further analysis was performed on the pChow‐FFC versus pFFC‐FFC mice to elucidate the role of perinatal introduction of an OID on the reprogramming of the methylome. A total of 446 (316 hypermethylated and 130 hypomethylated) DMRs were identified. The majority of the DMRs were located in introns, followed by intergenic, exons, and promoters (Supporting Fig. S5B). The interplay between DNA methylation and gene expression was also assessed between these cohorts (Fig. 7D). A total of 189 genes were found to be differentially expressed and differentially methylated, with the vast majority having a negative correlation between expression and methylation (similar to the results between pChow‐Chow and pFFC‐FFC). IPA of these 189 genes identified enrichment in hepatic fibrosis/hepatic stellate cell activation as the top canonical pathway between these two groups (Fig. 7D), further validating that differential methylation due to a perinatal OID provokes a profibrogenic transcriptome.
Finally, we reviewed those DEGs that were negatively correlated with the methylome between pFFC‐FFC versus pChow‐FFC and selected those involved in fibrosis, apoptosis, inflammation, migration/adhesion, and transcription factors/regulators (Supporting Table S4). We discovered that platelet‐derived growth factor receptor beta (pdgfrβ) was hypomethylated with a delta of 11.3% and differentially expressed with a log fold change of 2.08. This was further validated by examining the mRNA levels of pdgfrβ and its ligand pdgfβ, which were significantly increased in the pFFC‐FFC mice (Fig. 7E). The degree of CpG methylation of pdgfrβ was further confirmed using methylated DNA immunoprecipitation real‐time polymerase chain reaction (RT‐PCR), which showed reduced methylation in the promoter region of pdgfrβ in the pFFC‐FFC group (Fig. 7E).
Re‐Exposure to the FFC diet in Adulthood Enhances Murine Liver Inflammation, Injury, and More Importantly Fibrosis
We used our re‐exposure cohort described above to further examine the role of perinatal FFC in the pathogenesis of fibrosing NASH and to implicate epigenetic alteration in the phenotype observed in the pFFC‐FFC cohort (Fig. 8A). At the reintroduction of the FFC diet, all cohorts had comparable weights (Fig. 8B); however, at sacrifice the pFFC‐Chow‐FFC group had a higher body weight, liver weight, and liver to body weight ratio when compared to the control group Chow (Supporting Fig. S6A). Additionally, pFFC‐Chow‐FFC mice had a significant increase in the eWAT when compared to pChow‐Chow‐FFC and the control group Chow (Supporting Fig. S6B). Insulin resistance and islet β cell dysfunction developed in both the pFFC‐Chow‐FFC and pChow‐Chow‐FFC groups (Supporting Fig. S6C). The pFFC‐Chow‐FFC mice developed a significant increase in hepatic steatosis, as assessed by histopathology as well as liver triglyceride content (Fig. 8C). We noted that the lipid droplet size in the pFFC‐Chow‐FFC mice seemed to be larger when compared to the pChow‐Chow‐FFC mice. This observation prompted evaluating the transcriptome data available from the pChow‐FFC versus pFFC‐FFC mice as these two groups can elucidate the effect of perinatal exposure of FFC on the difference in hepatic steatosis and lipid droplet size. Using the differentially expressed genes between these two experimental groups, we found that the pFFC‐FFC mice overexpressed perilipin 4 (plin4) by a fold change of 2.66. Prior studies have shown perilipins, a type of lipid droplet‐associated protein, to bind to lipid droplets as they increase in size, suggesting involvement in the biogenesis of lipid droplets and development of hepatic steatosis.28 Another protein involved in lipid droplet growth is cell death‐inducing DNA fragmentation factor‐like effector C (cidec); cidec drives lipid transfer from smaller lipid droplets to larger lipid droplets, thus promoting lipid droplet growth.29 We found cidec to be differentially expressed by a fold change of 3.87 in the pFFC‐FFC mice when compared to the pChow‐FFC mice. Taken together, these data suggest that perinatal exposure to the FFC diet predisposes to larger lipid droplet accumulation within the hepatocytes.
Figure 8.
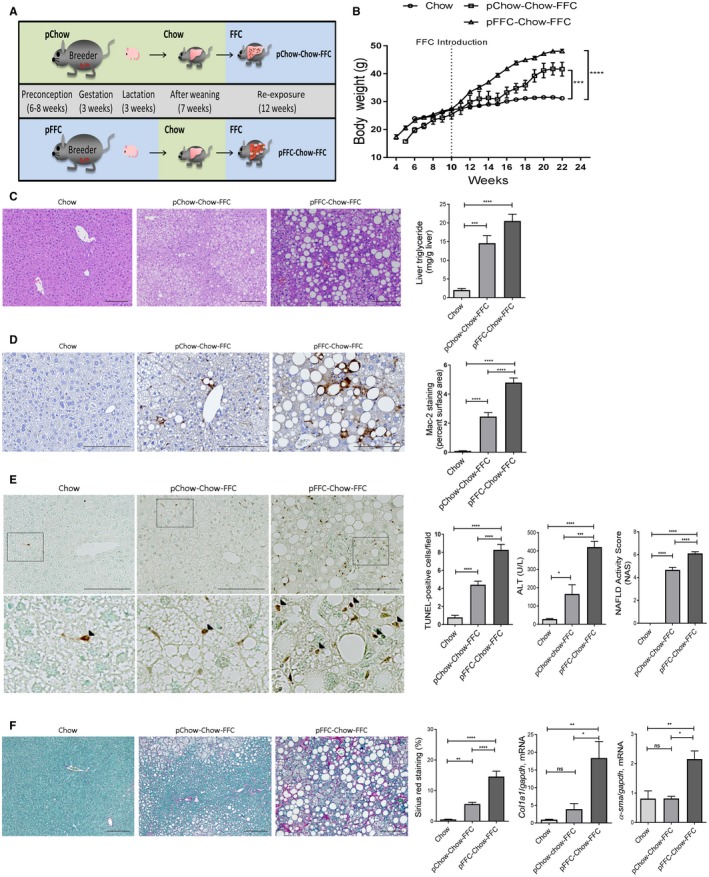
pFFC‐Chow‐FFC mice have accentuated liver steatosis, inflammation, and fibrosis. (A) C57BL/6J breeding pairs were started on either chow or an FFC diet 6‐8 weeks before conception and kept on the diet throughout gestation and lactation. At weaning, all offspring were placed on the chow diet. FFC was introduced to the offspring at 10 weeks of age and continued until 22 weeks of age. (B) Life curve from weaning to sacrifice (n = 4‐5). (C) Fixed liver tissues were stained with H&E (scale bar, 100 µm); liver triglyceride content (mg/g liver) was measured using a photometric absorbance‐based technique (n = 4‐5). (D) Macrophage infiltration was evaluated by immunohistochemistry for Mac‐2 antigen (scale bar, 100 µm). Mac‐2 staining was quantified by morphometry using ImageJ software in 10 random 20× microscopic fields and averaged for each animal (n = 3). (E) Hepatocyte apoptosis was assessed by the TUNEL assay (scale bar, 100 µm). The bottom row contains images enlarged from the boxed area in the corresponding panel in the top row. Positive cells (black arrowheads) were quantified by counting nuclei in 10 random 20× microscopic fields per animal (n = 3), and ALT (U/L) levels were measured (n = 4‐5) and liver histology assessed using the NAS (n = 4‐5). (F) Fixed liver tissue sections were stained by sirius red to detect collagen deposition (scale bar, 100 µm). Sirius red chromogen was quantified by morphometry using ImageJ software in 10 random 20× microscopic fields and averaged for each animal (n = 3). Total RNA was extracted from the liver tissues. mRNA expressions of the profibrogenic markers col1a1 and α‐sma (n = 6) were assessed by RT‐PCR. Fold change was determined after normalization to gapdh expression in liver tissue and expressed relative to that observed in chow‐fed mice. Bar columns represent mean ± SEM. *P < 0.05, **P < 0.01, ***P < 0.001, ****P < 0.0001.
The pFFC‐Chow‐FFC mice also had an increase in hepatic macrophage infiltration as examined by Mac‐2 immunohistochemistry (Fig. 8D). Furthermore, hepatic mRNA expression of the general macrophage marker f4/80, blood monocyte‐derived macrophage markers ccr2 and ly6c, and the macrophage activation marker tnf‐α were all significantly increased in the pFFC‐Chow‐FFC mice when compared to the other experimental groups (Supporting Fig. S6D). pFFC‐Chow‐FFC mice had increased liver injury, as assessed by the number of apoptotic hepatocytes examined by the TUNEL assay, serum ALT values, and the NAS (Fig. 8E). More importantly, pFFC‐Chow‐FFC mice had a significant increase in liver fibrosis, as assessed by sirius red stain and mRNA expression of α‐sma and col1a1 (Fig. 8F). Taken together, these data further demonstrate that perinatal exposure to an FFC diet primes the liver for the subsequent development of severe fibrosing NASH following re‐exposure in adulthood.
Discussion
The principal findings of the present study provide mechanistic insights regarding the role of perinatal exposure to an OID in the development of fibrosing NASH in the offspring. Our results indicate that mice exposed to the OID starting at the time of conception through the age of 10 weeks when compared to mice from the other experimental groups have (1) increased liver steatosis, injury, inflammation, and fibrosis; (2) proapoptotic, proinflammatory, and profibrogenic transcriptome, with differential expression of profibrogenic chemokines, transcription factors, and epigenetic regulators; and (3) enriched differentially methylated genes governing fibrosis and cell death pathways that are likely pathogenic drivers of the transcriptome and the accentuated disease phenotype. Additionally, our results indicate that the phenotype acquired from the perinatal exposure to an OID can be reversible following introduction of a healthy diet after weaning and that perinatal OID primes the developing liver to a rapidly progressive NASH phenotype following re‐exposure to the OID in adulthood.
In this study, we used a well‐established dietary model of murine NASH induced by the FFC diet,16 also referred to as OID. The FFC diet is high in saturated fat, fructose, and cholesterol and was developed to replicate the Western fast‐food diet; it phenocopies the histologic features of human NASH, including neutral lipid accumulation by hepatocytes, the presence of ballooned hepatocytes, hepatic inflammatory cell infiltration, and liver fibrosis. Additionally, the model has a high fidelity to the metabolic profile observed in human NASH, including obesity, hyperlipidemia, and insulin resistance.16, 30 Here, we demonstrated that mice exposed antenatally and during early life to the FFC diet develop stage 3‐4 fibrosis at 10 weeks of age (a relatively early time point when compared to the adult mouse model of NASH, where early stage fibrosis develops histologically after 16 weeks on the FFC diet31), suggesting that early introduction of the FFC diet results in an accentuated murine NASH phenotype.
Antenatal and early life exposure to the FFC diet generates a gene signature that clusters in an unsupervised hierarchal manner in concordance to the gene signature of adult mice exposed to the FFC diet for 24 weeks, suggesting that the transcriptome alteration of those mice with early OID exposure mirrors the transcriptome of advanced adulthood murine NASH. Moreover, this altered transcriptome is predominantly profibrogenic and proinflammatory, with bioinformatics analysis yielding hepatic fibrosis and stellate cell activation as the top up‐regulated canonical pathway and proinflammatory and profibrogenic upstream regulators, such as ifnγ, il‐1, tgf‐β, il‐6, pparα, and pdgfβ, as well as downstream enrichment of liver fibrosis and inflammation as biological functions. More importantly, methylation analysis of the whole liver provided consistent results with the RNA‐seq data, where early introduction of the OID induces enriched signaling of hepatic fibrosis and stellate cell activation as the top up‐regulated canonical pathway. In addition, liver‐related disease and biological functions showed particular enrichment for liver fibrosis and cell death.
Hepatic fibrosis and stellate cell activation were consistently found as the top canonical pathway in our model. Hepatic stellate cells play a key role in the onset and progression of liver fibrosis and thus in the development of fibrosing NASH. Hepatic stellate cell transdifferentiation requires reprogramming of the epigenome.32 Therefore, it is possible that changes in DNA methylation in the hepatic stellate cell activation pathway could be driven by early exposure to an OID, thus priming the fetal liver for fibrosing NASH.
DNA methylation is an epigenetic modification that can be influenced by environmental cues and represents a plausible link between different environmental exposures, including nutrition, and the development of liver diseases.33 In the present study, we demonstrated that early introduction of an OID induces a negative correlation between the transcription of DEGs and the levels of methylation in such regions, with the majority of these genes showing increased transcription and hypomethylation, suggesting that changes in methylation have a regulatory role in gene expression. Of particular interest, pdgfrβ was overexpressed at the transcriptome level and hypomethylated, with further in vitro studies validating such findings. Therefore, pdgfrβ could serve as a potential modifiable epigenetic target in early onset NASH fibrosis.
Our re‐exposure cohort brings attention to the developmental origin of the health and disease hypothesis; early life events have a powerful influence for later susceptibility to certain chronic diseases, and this appears to be partially mediated by epigenetics.34 Exposure to an OID in utero and early life predisposes to an accelerated disease phenotype following a re‐exposure “second hit” later in life,35 which is consistent with our results in the re‐exposure cohort where mice exposed to a perinatal OID and later re‐exposed during adulthood developed an accentuated fibrosing NASH phenotype. It is likely that a transgenerational effect could be seen in subsequent generations of our current model (demonstrating a stronger epigenetic link) as prior studies have shown increased body weight, obesity, and hepatic steatosis across generations exposed to a high‐fat diet.36 However, further studies are needed to support this transgenerational hypothesis.
Our findings are in line with prior studies where in utero and early life exposure to an OID in mice enhances the development of hepatic steatosis and fibrosis in the offspring.37, 38, 39 However, our study design is unique because we adopted a nonbiased approach and interrogated the whole‐liver transcriptome by RNA‐seq and the whole‐liver genome methylation profile by RRBS. Additionally, we demonstrated a correlation between the transcriptome, methylome, and the striking profibrogenic and proinflammatory phenotype in our model. More importantly, we identified potential targets (for example, pdgfrβ) for therapeutic interventions in NASH; this is of biomedical importance given the public health implications of the disease. Furthermore, we examined the molecular mediators of perinatal FFC diet‐enhanced hepatocyte lipoapoptosis and identified reduced expression of the anti‐apoptotic protein XIAP as a key player in priming the developing liver to lipoapoptosis. These findings are supported by a recent study demonstrating that young mice and human liver are relatively primed to apoptosis, predisposing to cell death when exposed to genotoxic damage.40
Future directions of the current study will include examining the different liver cell type‐specific methylation events by performing RRBS on isolated hepatocytes, hepatic macrophages, and hepatic stellate cells as well as exploring the role of other epigenetic regulations in our model, including histone modifications. Additionally, investigating the intestinal microbiota among the different groups could provide valuable insight regarding early gut colonization and its association with NAFLD. Prior studies have shown alteration of microbiota composition of high‐fat diets41 and more importantly the long‐term impact of such diets on dysbiosis even after switching to a healthier diet.42 Therefore, our current model could provide additional information on the association of diet, NAFLD, and dysbiosis.
In summary, we demonstrated a deleterious effect of the perinatal introduction of an OID in a murine nutritional model of NASH, suggesting that in utero nutritional reprogramming provokes pathogenic alterations in the methylome, with potential dysregulation of the transcriptome culminating in severe liver fibrosis. Here, we report that early exposure to an OID provides a profibrogenic and proinflammatory gene signature that correlates with differential methylation events. Additionally, early exposure to an OID creates susceptibility for development of adulthood fibrosing NASH following re‐exposure. Therefore, perinatal introduction of an OID accentuates NASH progression mostly by epigenetic reprogramming, and thus epigenetic modifiers are potential therapeutic targets for a subset of patients with early onset NASH. More importantly, we demonstrated that institution of a regular diet after weaning would result in a normal phenotype, emphasizing the importance of early dietary intervention in pediatric NASH. Finally, perinatal OID coupled with sustained exposure in childhood is a key element in early onset NASH fibrosis and an important factor in the identification and risk stratification of young patients with NASH cirrhosis.
Potential conflict of interest
Nothing to report.
Supporting information
Acknowledgment
We thank Dr. Gregory J. Gores for his thorough review of the manuscript and Ms. Pritha Chanana and Dr. Ayano Niibe for providing excellent scientific support. We also thank Dr. Nathan K. LeBrasseur and his laboratory members, especially Dr. Thomas White, for their assistance in the Comprehensive Lab Animal Monitoring System and microcomputed tomography scan data.
Supported by the National Institute of Diabetes and Digestive and Kidney Diseases (grant DK111397 to S.H.I.), National Institutes of Health (grant R01DK110024 to K.D.R.), North American Society of Pediatric Gastroenterology Hepatology and Nutrition (Young Investigator Award/Nestle Nutrition Award to S.H.I.), Gilead Science (Liver Scholar Career Development Award to S.H.I.), MH CZ‐DRO (UHHK 00179906 to P.H.), and the Mayo Clinic.
References
Author names in bold designate shared co‐first authorship.
- 1. Ogden CL, Carroll MD, Lawman HG, Fryar CD, Kruszon‐Moran D, Kit BK, et al. Trends in obesity prevalence among children and adolescents in the United States, 1988–1994 through 2013–2014. JAMA 2016;315:2292‐2299. [DOI] [PMC free article] [PubMed] [Google Scholar]
- 2. Welsh JA, Karpen S, Vos MB. Increasing prevalence of nonalcoholic fatty liver disease among United States adolescents, 1988–1994 to 2007–2010. J Pediatr 2013;162:e491. [DOI] [PMC free article] [PubMed] [Google Scholar]
- 3. McPherson S, Hardy T, Henderson E, Burt AD, Day CP, Anstee QM. Evidence of NAFLD progression from steatosis to fibrosing‐steatohepatitis using paired biopsies: implications for prognosis and clinical management. J Hepatol 2015;62:1148‐1155. [DOI] [PubMed] [Google Scholar]
- 4. Angulo P, Kleiner DE, Dam‐Larsen S, Adams LA, Bjornsson ES, Charatcharoenwitthaya P, et al. Liver fibrosis, but no other histologic features, is associated with long‐term outcomes of patients with nonalcoholic fatty liver disease. Gastroenterology 2015;149:e310. [DOI] [PMC free article] [PubMed] [Google Scholar]
- 5. Doycheva I, Issa D, Watt KD, Lopez R, Rifai G, Alkhouri N. Nonalcoholic steatohepatitis is the most rapidly increasing indication for liver transplantation in young adults in the United States. J Clin Gastroenterol 2018;52:339‐346. [DOI] [PubMed] [Google Scholar]
- 6. Cioffi CE, Welsh JA, Cleeton RL, Caltharp SA, Romero R, Wulkan ML, et al. Natural history of NAFLD diagnosed in childhood: a single‐center study. Children (Basel) 2017;4:E34. [DOI] [PMC free article] [PubMed] [Google Scholar]
- 7. Feldstein AE, Charatcharoenwitthaya P, Treeprasertsuk S, Benson JT, Enders FB, Angulo P. The natural history of non‐alcoholic fatty liver disease in children: a follow‐up study for up to 20 years. Gut 2009;58:1538‐1544. [DOI] [PMC free article] [PubMed] [Google Scholar]
- 8. Poston L, Caleyachetty R, Cnattingius S, Corvalan C, Uauy R, Herring S, et al. Preconceptional and maternal obesity: epidemiology and health consequences. Lancet Diabetes Endocrinol 2016;4:1025‐1036. [DOI] [PubMed] [Google Scholar]
- 9. Stewart MS, Heerwagen MJ, Friedman JE. Developmental programming of pediatric non‐alcoholic fatty liver disease: redefining the "first‐hit". Clin Obstet Gynecol 2013;56:577‐590. [DOI] [PMC free article] [PubMed] [Google Scholar]
- 10. Wesolowski SR, Kasmi KC, Jonscher KR, Friedman JE. Developmental origins of NAFLD: a womb with a clue. Nat Rev Gastroenterol Hepatol 2017;14:81‐96. [DOI] [PMC free article] [PubMed] [Google Scholar]
- 11. Heijmans BT, Tobi EW, Stein AD, Putter H, Blauw GJ, Susser ES, et al. Persistent epigenetic differences associated with prenatal exposure to famine in humans. Proc Natl Acad Sci U S A 2008;105:17046‐17049. [DOI] [PMC free article] [PubMed] [Google Scholar]
- 12. Zeybel M, Mann DA, Mann J. Epigenetic modifications as new targets for liver disease therapies. J Hepatol 2013;59:1349‐1353. [DOI] [PubMed] [Google Scholar]
- 13. Page A, Mann DA, Mann J. The mechanisms of HSC activation and epigenetic regulation of HSCs phenotypes. Curr Pathobiol Rep 2014;2:163‐170. [DOI] [PMC free article] [PubMed] [Google Scholar]
- 14. Gabory A, Attig L, Junien C. Developmental programming and epigenetics. Am J Clin Nutr 2011;94:1943S‐1952S. [DOI] [PubMed] [Google Scholar]
- 15. Hardy T, Zeybel M, Day CP, Dipper C, Masson S, McPherson S, et al. Plasma DNA methylation: a potential biomarker for stratification of liver fibrosis in non‐alcoholic fatty liver disease. Gut 2017;66:1321‐1328. [DOI] [PMC free article] [PubMed] [Google Scholar]
- 16. Charlton M, Krishnan A, Viker K, Sanderson S, Cazanave S, McConico A, et al. Fast food diet mouse: novel small animal model of NASH with ballooning, progressive fibrosis, and high physiological fidelity to the human condition. Am J Physiol Gastrointest Liver Physiol 2011;301:G825‐G834. [DOI] [PMC free article] [PubMed] [Google Scholar]
- 17. Ibrahim SH, Hirsova P, Malhi H, Gores GJ. Animal models of nonalcoholic steatohepatitis: eat, delete, and inflame. Dig Dis Sci 2016;61:1325‐1336. [DOI] [PMC free article] [PubMed] [Google Scholar]
- 18. Johnson F, Wardle J. Variety, palatability, and obesity. Adv Nutr 2014;5:851‐859. [DOI] [PMC free article] [PubMed] [Google Scholar]
- 19. Krenkel O, Tacke F. Liver macrophages in tissue homeostasis and disease. Nat Rev Immunol 2017;17:306‐321. [DOI] [PubMed] [Google Scholar]
- 20. Idrissova L, Malhi H, Werneburg NW, LeBrasseur NK, Bronk SF, Fingas C, et al. TRAIL receptor deletion in mice suppresses the inflammation of nutrient excess. J Hepatol 2015;62:1156‐1163. [DOI] [PMC free article] [PubMed] [Google Scholar]
- 21. Khazen W, M'Bika JP, Tomkiewicz C, Benelli C, Chany C, Achour A, et al. Expression of macrophage‐selective markers in human and rodent adipocytes. FEBS Lett 2005;579:5631‐5634. [DOI] [PubMed] [Google Scholar]
- 22. McDonald B, Kubes P. Innate immune cell trafficking and function during sterile inflammation of the liver. Gastroenterology 2016;151:1087‐1095. [DOI] [PubMed] [Google Scholar]
- 23. Kleiner DE, Brunt EM, Van Natta M, Behling C, Contos MJ, Cummings OW, et al. Nonalcoholic Steatohepatitis Clinical Research Network. Design and validation of a histological scoring system for nonalcoholic fatty liver disease. Hepatology 2005;41:1313‐1321. [DOI] [PubMed] [Google Scholar]
- 24. Zatloukal K, French SW, Stumptner C, Strnad P, Harada M, Toivola DM, et al. From Mallory to Mallory‐Denk bodies: what, how and why? Exp Cell Res 2007;313:2033‐2049. [DOI] [PubMed] [Google Scholar]
- 25. Lackner C, Gogg‐Kamerer M, Zatloukal K, Stumptner C, Brunt EM, Denk H. Ballooned hepatocytes in steatohepatitis: the value of keratin immunohistochemistry for diagnosis. J Hepatol 2008;48:821‐828. [DOI] [PubMed] [Google Scholar]
- 26. Holcik M, Korneluk RG. XIAP, the guardian angel. Nat Rev Mol Cell Biol 2001;2:550‐556. [DOI] [PubMed] [Google Scholar]
- 27. Li R, Grimm SA, Mav D, Gu H, Djukovic D, Shah R, et al. Transcriptome and DNA methylome analysis in a mouse model of diet‐induced obesity predicts increased risk of colorectal cancer. Cell Rep 2018;22:624‐637. [DOI] [PMC free article] [PubMed] [Google Scholar]
- 28. Thiam AR, Beller M. The why, when and how of lipid droplet diversity. J Cell Sci 2017;130:315‐324. [DOI] [PubMed] [Google Scholar]
- 29. Gong J, Sun Z, Wu L, Xu W, Schieber N, Xu D, et al. Fsp27 promotes lipid droplet growth by lipid exchange and transfer at lipid droplet contact sites. J Cell Biol 2011;195:953‐963. [DOI] [PMC free article] [PubMed] [Google Scholar]
- 30. Tomita K, Kohli R, MacLaurin BL, Hirsova P, Guo Q, Sanchez LHG, et al. Mixed‐lineage kinase 3 pharmacological inhibition attenuates murine nonalcoholic steatohepatitis. JCI Insight 2017;2:94488. [DOI] [PMC free article] [PubMed] [Google Scholar]
- 31. Krishnan A, Abdullah TS, Mounajjed T, Hartono S, McConico A, White T, et al. A longitudinal study of whole body, tissue, and cellular physiology in a mouse model of fibrosing NASH with high fidelity to the human condition. Am J Physiol Gastrointest Liver Physiol 2017;312:G666‐G680. [DOI] [PMC free article] [PubMed] [Google Scholar]
- 32. Hardy T, Mann DA. Epigenetics in liver disease: from biology to therapeutics. Gut 2016;65:1895‐1905. [DOI] [PMC free article] [PubMed] [Google Scholar]
- 33. Nano J, Ghanbari M, Wang W, de Vries PS, Dhana K, Muka T, et al. BIOS consortium. Epigenome‐wide association study identifies methylation sites associated with liver enzymes and hepatic steatosis. Gastroenterology 2017;153:e1092. [DOI] [PubMed] [Google Scholar]
- 34. Gluckman PD, Hanson MA, Cooper C, Thornburg KL. Effect of in utero and early‐life conditions on adult health and disease. N Engl J Med 2008;359:61‐73. [DOI] [PMC free article] [PubMed] [Google Scholar]
- 35. Brumbaugh DE, Friedman JE. Developmental origins of nonalcoholic fatty liver disease. Pediatr Res 2014;75:140‐147. [DOI] [PMC free article] [PubMed] [Google Scholar]
- 36. Li J, Huang J, Li JS, Chen H, Huang K, Zheng L. Accumulation of endoplasmic reticulum stress and lipogenesis in the liver through generational effects of high fat diets. J Hepatol 2012;56:900‐907. [DOI] [PubMed] [Google Scholar]
- 37. Mischke M, Pruis MG, Boekschoten MV, Groen AK, Fitri AR, van de Heijning BJ, et al. Maternal Western‐style high fat diet induces sex‐specific physiological and molecular changes in two‐week‐old mouse offspring. PLoS One 2013;8:e78623. [DOI] [PMC free article] [PubMed] [Google Scholar]
- 38. Wankhade UD, Zhong Y, Kang P, Alfaro M, Chintapalli SV, Thakali KM, et al. Enhanced offspring predisposition to steatohepatitis with maternal high‐fat diet is associated with epigenetic and microbiome alterations. PLoS One 2017;12:e0175675. [DOI] [PMC free article] [PubMed] [Google Scholar]
- 39. Bruce KD, Cagampang FR, Argenton M, Zhang J, Ethirajan PL, Burdge GC, et al. Maternal high‐fat feeding primes steatohepatitis in adult mice offspring, involving mitochondrial dysfunction and altered lipogenesis gene expression. Hepatology 2009;50:1796‐1808. [DOI] [PubMed] [Google Scholar]
- 40. Sarosiek KA, Fraser C, Muthalagu N, Bhola PD, Chang W, McBrayer SK, et al. Developmental regulation of mitochondrial apoptosis by c‐Myc governs age‐ and tissue‐specific sensitivity to cancer therapeutics. Cancer Cell 2017;31:142‐156. [DOI] [PMC free article] [PubMed] [Google Scholar]
- 41. Zeng H, Liu J, Jackson MI, Zhao FQ, Yan L, Combs GF Jr. Fatty liver accompanies an increase in lactobacillus species in the hind gut of C57BL/6 mice fed a high‐fat diet. J Nutr 2013;143:627‐631. [DOI] [PMC free article] [PubMed] [Google Scholar]
- 42. Ma J, Prince AL, Bader D, Hu M, Ganu R, Baquero K, et al. High‐fat maternal diet during pregnancy persistently alters the offspring microbiome in a primate model. Nat Commun 2014;5:3889. [DOI] [PMC free article] [PubMed] [Google Scholar]
Associated Data
This section collects any data citations, data availability statements, or supplementary materials included in this article.
Supplementary Materials