

Abstract
Hepatocellular carcinoma (HCC) is a leading cause of cancer deaths worldwide, and an association between altered bile acid (BA) metabolism, down‐regulation of farnesoid X receptor (FXR), which is a master regulator of BA metabolism, and hepatocarcinogenesis has been documented. While global FXR deficiency in mice results in spontaneous HCC with aging, the contribution of tissue‐specific FXR deficiency to hepatocarcinogenesis remains unclear. In this study, the prevalence of hepatic tumors, expression of genes related to tumorigenesis, and serum/liver BA levels were compared among male whole‐body Fxr‐null, hepatocyte‐specific Fxr‐null (Fxr ∆Hep), and enterocyte‐specific Fxr‐null (Fxr ∆IE) mice at the age of 3, 14, and 20 months. More than 90% of 20‐month‐old whole‐body Fxr‐null mice had hepatic tumors with enhanced hepatic expression of myelocytomatosis oncogene (Myc) and cyclin‐dependent kinase 4 (Cdk4) messenger RNAs (mRNAs) and elevated serum taurocholate (TCA) and tauromuricholate (TMCA) and their respective unconjugated derivatives. The incidence of hepatic tumors was significantly lower in Fxr ∆Hep and Fxr ∆IE mice (20% and 5%, respectively), and the increases in Myc and Cdk4 mRNA or serum BA concentrations were not detected in these mice compared to Fxr floxed [fl]/fl mice; a similar tendency was observed in 14‐month‐old mice. However, increased hepatic c‐Myc protein expression was found only in Fxr‐null mice at the age of 3, 14, and 20 months. Treatment with TCA induced Myc expression in Fxr‐null cultured primary mouse hepatocytes but not in wild‐type (WT) mouse hepatocytes, demonstrating that the combination of hepatocyte FXR disruption with elevated TCA is required for Myc induction and ensuing age‐dependent hepatocarcinogenesis in Fxr‐null mice. Conclusion: There is a relatively low risk of hepatic tumors by inhibition of FXR in enterocytes, likely due to the lack of increased TCA and Myc induction.
Abbreviations
- Abcb11
adenosine triphosphate‐binding cassette, subfamily B, member 11
- ALT
alanine aminotransferase
- ANOVA
analysis of variance
- AST
aspartate aminotransferase
- BA
bile acid
- BSEP
bile salt export pump
- CA
cholate
- Ccn
cyclin
- Cdk
cyclin‐dependent kinase
- Cyp7A1
cytochrome P450 7A1
- DCA
deoxycholate
- DMSO
dimethyl sulfoxide
- FGF
fibroblast growth factor
- FXR
farnesoid X receptor
- Fxr∆Hep
hepatocyte‐specific Fxr‐null
- Fxr∆IE
enterocyte‐specific Fxr‐null
- Fxrfl/fl
Fxr‐floxed
- HBSS
Hank's buffered salt solution
- HCC
hepatocellular carcinoma
- LC
liquid chromatography
- LRH‐1
liver receptor homolog 1
- MCA
muricholate
- mRNA
messenger RNA
- MS
mass spectrometry
- Myc
myelocytomatosis oncogene
- Nr
nuclear receptor
- Nrf2
nuclear factor, erythroid derived 2, like 2
- Ppia
peptidylprolyl isomerase A
- qPCR
quantitative polymerase chain reaction
- QTOFMS
quadrupole time of flight mass spectrometry
- SEM
standard error of the mean
- SHP
small heterodimer partner
- TCA
taurocholate
- TDCA
taurodeoxycholate
- THDCA
taurohyodeoxycholate
- TMCA
tauromuricholate
- UP
ultraperformance
- WT
wild‐type
HCC is a leading cause of cancer mortality, with poor prognosis and very few effective therapeutic options. Risk factors for HCC include persistent infection with hepatitis B and C viruses, obesity, metabolic syndrome, nonalcoholic steatohepatitis,1, 2 alcohol consumption,3 exposure to aflatoxins, and inborn errors of metabolism, such as α‐1 antitrypsin deficiency, tyrosinemia, and citrin deficiency.4, 5, 6 Recently, gut microbiota and BAs were also shown to be associated with HCC development.7, 8
Maintenance of BA homeostasis is vital for health, and its disruption is associated with various diseases.9, 10 BA homeostasis is regulated by the nuclear receptor FXR (also known as nuclear receptor subfamily 1, group H, member 4 [Nr1h4]).1 FXR not only controls BA metabolism and enterohepatic circulation, but is also associated with suppression of inflammatory signaling and enhancement of tissue repair.10 Given that FXR signaling is down‐regulated in human HCC and that Fxr‐null mice are prone to spontaneous HCC with age,11, 12, 13 loss of FXR signaling is likely associated with hepatocarcinogenesis. However, the precise mechanism of hepatocarcinogenesis in Fxr‐null mice and the impact of FXR in different tissues, notably liver and intestine (the major sites of FXR expression), on hepatocarcinogenesis remain undetermined. To address these issues, we investigated the prevalence of spontaneous hepatic tumors, hepatic gene expression associated with tumor development, and BA metabolism in Fxr‐null, Fxr ∆Hep, and Fxr ∆IE mice.
Materials and Methods
Mice
All animal studies and procedures were carried out in accordance with the Institute of Laboratory Animal Resources guidelines and were approved by the National Cancer Institute Animal Care and Use Committee. Mice were housed in a pathogen‐free animal facility under a standard 12‐hour light/dark cycle and given pelleted National Institutes of Health (NIH)‐31 chow diet and water ad libitum. Fxr‐null mice have been described,14 and WT mice on the same C57BL/6N genetic background were used as a control counterpart. Fxr ∆Hep, Fxr ∆IE,15 and Fxr fl/fl counterparts were generated on a C57BL/6N genetic background. Male mice of these lines were maintained with the same chow diet and in the same mouse vivarium and cage rack in order to minimize the potential influences of gut microbiota; these mice were killed at 3, 14, or 20 months of age for pathologic, histologic, and biochemical analysis. Aging mice were killed if they exhibited lethargy, lower mobility, labored breathing, and lost 15% of body weight. Additionally, 12‐ to 16‐week‐old male WT, Fxr‐null, Fxr ∆Hep, and Fxr fl/fl mice were used for isolating primary hepatocytes.
mRNA Measurements
Total RNA of liver was extracted using TRIzol reagent (Thermo Fisher Scientific, Waltham, MA), and quantitative polymerase chain reaction (qPCR) was performed using complementary DNA (cDNA) generated from 2 µg total RNA with qScript cDNA SuperMix (Quanta Biosciences, Gaithersburg, MD). The qPCR reactions were carried out using SYBR green qPCR master mix (Biotools, Houston, TX) in the QuanStudio 7 Flex System. The primer pairs were designed using Primer‐BLAST (National Center for Biotechnology Information) or qPrimerDepot and are shown in Supporting Table S1. Values were quantified with the comparative CT method, normalized to those of peptidylprolyl isomerase A (Ppia) mRNA, and expressed as a fold change relative to WT mice.
Quantification Of BA Metabolites
Livers were homogenized with 100% acetonitrile containing 1 µM of ursodeoxycholic acid‐2,2,4,4‐d4 (Cambridge Isotope Laboratories, Inc., Andover, MA) as an internal standard, centrifuged twice at 15,000g for 25 minutes at 4°C for removal of precipitated proteins and other particulates, and the supernatant was diluted with 0.1% formic acid. Quantification of BA metabolites was performed as described.15, 16, 17 Liquid chromatography (LC)–mass spectrometry (MS) was carried out on a Waters Acquity H‐Class Ultra Performance (UP) LC system using a Waters Acquity BEH C18 column (2.1 × 100 mm) coupled to a Waters Xevo G2 quadrupole time of flight MS (QTOFMS). UPLC was performed using the following protocol: A, 0.1% formic acid in water and B, 0.1% formic acid in acetonitrile; an initial gradient of 80% A for 4 minutes, to 60% A at 15 minutes, to 40% A at 20 minutes, to 10% A at 21 minutes, followed by flushing for 1 minute, then equilibration under the initial conditions for 4 minutes. The flow rate was 0.4 mL/minute, and the column temperature was maintained at 45°C. A Waters Xevo G2 QTOF was operated in negative mode, scanning m/z 50‐1,200 at a rate of 0.3 second/scan. The following instrument conditions were used: 1.5 kV capillary voltage, 150°C source temperature, 30 V sampling cove, and a desolvation gas flow rate of 850 L/hour at 500°C. Serum BA profiles were determined as described.9, 10
Liver Histology
When experiments terminated, livers were removed and small pieces containing either non‐tumor or tumor regions were fixed in 4% formaldehyde phosphate‐buffered saline solution, embedded in paraffin, sectioned at 5 µm, and stained using the standard hematoxylin and eosin method.
Preparation And Treatment Of Mouse Primary Hepatocytes
Primary hepatocytes were isolated from mice as described.10, 15 Briefly, after killing mice by CO2 asphyxiation, the abdomen was opened and the mesentery and intestine moved to expose the portal vein. A cannula was inserted into the portal vein, and the liver was perfused with 40 mL of Hank's buffered salt solution (HBSS) without magnesium or calcium (Thermo Fisher Scientific) and containing 1 mM ethylene diamine tetraacetic acid at 4 mL/minute. Blood was extravasated by cutting the inferior vena cava. After perfusion of the entire liver with 50 mL of HBSS containing collagenase I and II (0.6 mg/mL each; Thermo Fisher Scientific) and calcium chloride dehydrate (5 mM) at a speed of 4 mL/minute, the digested liver was removed and placed in a sterile 10‐cm Petri dish with 10 mM phosphate‐buffered saline. The hepatic capsule was torn by fine‐tip forceps, and dispersed cells were filtered through a 70‐µm cell strainer (Becton Dickinson and Company) into a 50‐mL tube and centrifuged at 200g at 4°C for 2 minutes. Hepatocytes were further washed and purified by gradient centrifugation using Percoll Plus (GE Healthcare, Little Chalfont, United Kingdom). After washing with HBSS and trypan blue staining, hepatocytes were counted and then seeded in collagen‐coated 12‐well plates (Becton Dickinson and Company) at a density of 4 × 10⁵ cells/well. Primary hepatocytes were cultured in William’s E medium (Thermo Fisher Scientific) with 10% fetal bovine serum and antibiotics (100 U/mL penicillin and 100 µg/mL streptomycin). Four hours after seeding, the cells were treated with medium containing TCA, tauro‐β‐muricholate (TβMCA), deoxycholate (DCA), or dimethyl sulfoxide (DMSO) as a vehicle at the indicated final concentrations for 12 hours. At the prescribed time points, cells were harvested and subjected to qPCR analysis.
Immunoblot Analysis
Approximately 50 mg of mouse liver was homogenized in radio immunoprecipitation assay lysis buffer (MilliporeSigma, Burlington, MA) containing the Halt Protease and Phosphatase Inhibitor Cocktail (Thermo Fisher Scientific). The homogenates were centrifuged at 10,000g for 10 minutes at 4°C to obtain liver lysates, and the protein concentrations were measured with the Pierce BCA Protein Assay Kit (Thermo Fisher Scientific). The liver lysates (20 μg of protein) were subjected to 4%‐15% Criterion TGX Precast Midi Protein Gel (Bio‐Rad, Hercules, CA) and transferred to Trans‐Blot Turbo Midi polyvinylidene fluoride (Bio‐Rad) using the Trans‐Blot Turbo Transfer System (Bio‐Rad). Membranes were blocked with 5% OmniPur bovine serum albumin, fraction V (MilliporeSigma) in a mixture of Tris‐buffered saline and 0.1% Tween 20 (MilliporeSigma) and incubated overnight with primary antibodies against c‐Myc (sc‐41, 1:500 dilution; Santa Cruz Biotechnology, Dallas, TX) and CDK4 (11026‐1‐AP, 1:1,000 dilution; Proteintech Group, Rosemont, IL). The β‐actin band was obtained by reprobing the membranes with antibody against β‐actin (#8457, 1:1,000 dilution; Cell Signaling Technology, Danvers, MA) and was used as a loading control. Each band intensity was quantified using Bio‐Rad Image Lab software, normalized by those of the loading control, and expressed as a fold change relative to WT mice.
Biochemical Analysis
Serum aspartate aminotransferase (AST) and alanine aminotransferase (ALT) activities were assayed as described.9, 10
Statistical Analysis
Statistical analysis was performed with Prism version 7 (GraphPad software). Appropriate statistical analysis was applied assuming a normal sample distribution. When more than two groups were investigated, one‐way (Figs. 1, 2, 3, 4, 5, 6, 7; Supporting Fig. S1‐4) or two‐way analysis of variance (ANOVA) (Fig. 8) followed by Tukey’s post‐hoc correction was applied for comparisons. P < 0.05 was considered as a significant difference and results expressed as mean and standard error of the mean (SEM) values.
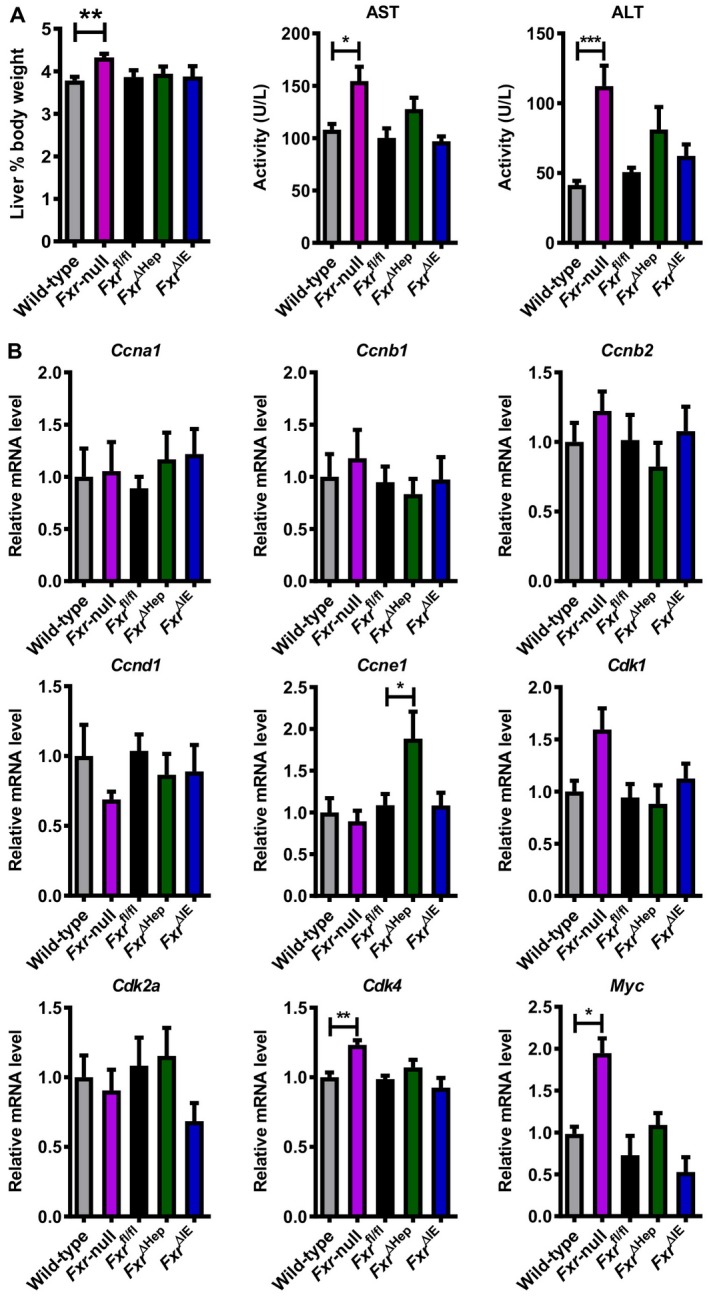
Figure 1.
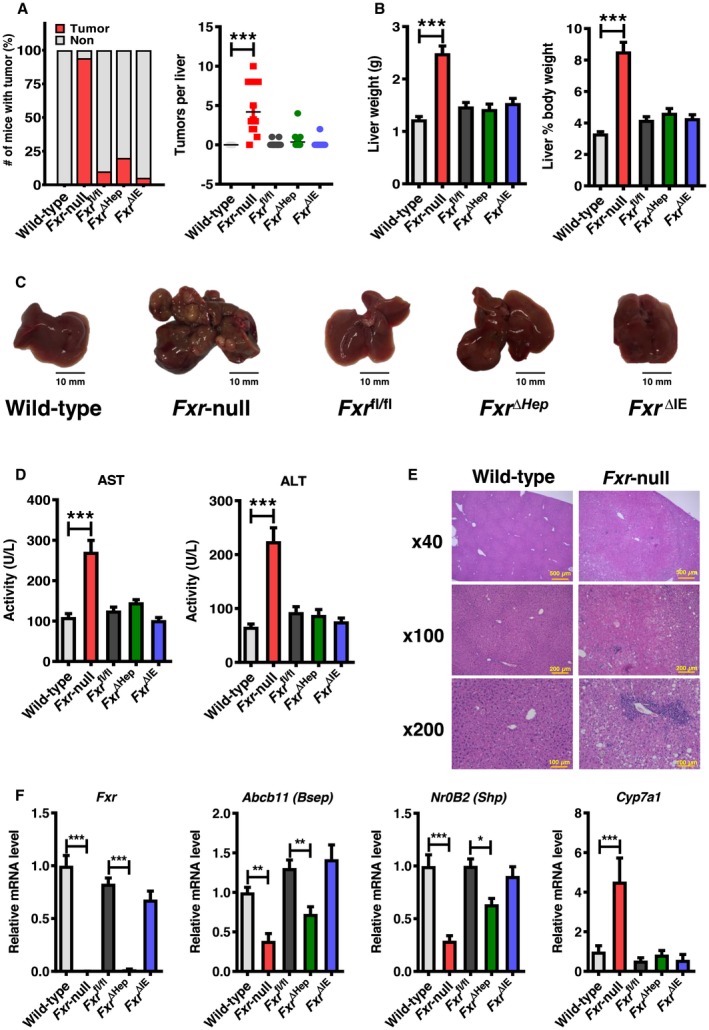
Fxr‐null mice develop spontaneous hepatocellular tumors at the age of 20 months. (A) Number of tumor nodules per liver and (B) liver‐to‐body weight in WT and whole‐body Fxr‐null, Fxr ∆Hep, Fxr ∆IE, and Fxr fl/fl mice at 20 months old (n = 17‐20/group). (C) Representative images of macroscopic appearance of the livers. (D) Serum AST and ALT activities (n = 12/group). (E) Representative images of microscopic findings of the livers. (F) Hepatic mRNA levels of Fxr and its target genes (n = 8/group). Values were quantified with the comparative CT method, normalized to those of Ppia mRNA, and expressed as a fold change relative to WT mice. Values are expressed as means ± SEM. ***P < 0.001, **P < 0.01, *P < 0.05 by one‐way ANOVA.
Figure 2.
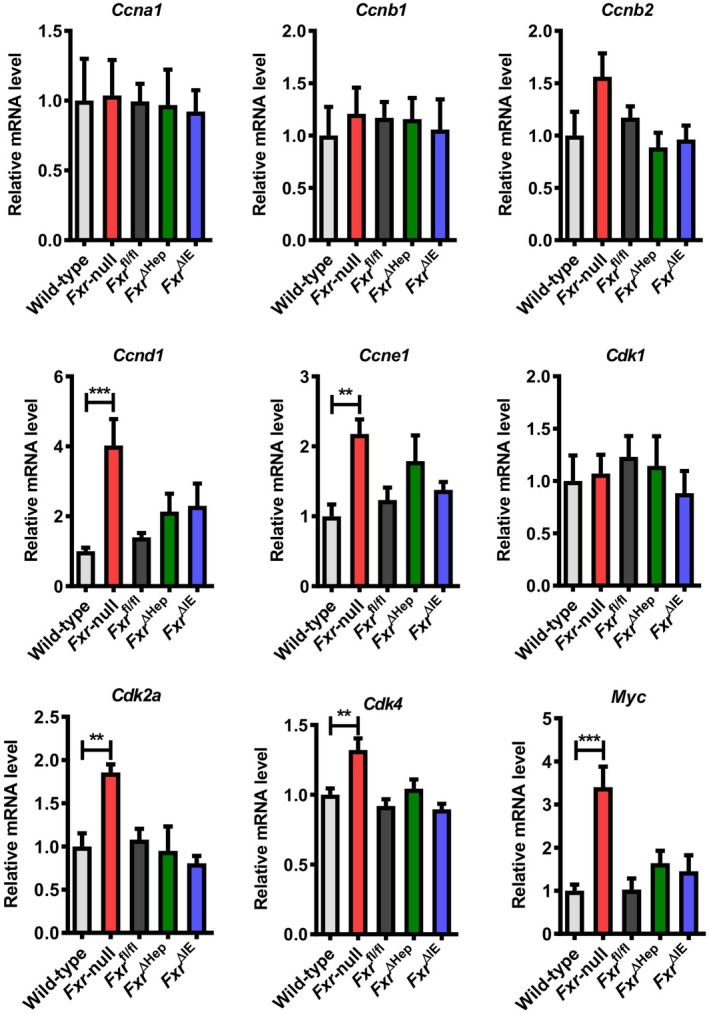
Hepatic mRNA levels of cell‐cycle regulators in WT and whole‐body Fxr‐null, Fxr ∆Hep, Fxr ∆IE, and Fxr fl/fl mice at 20 months old. mRNA levels were quantified by qPCR analysis, normalized to those of Ppia, and subsequently expressed as fold change relative to WT mice. Values are expressed as means ± SEM (n = 8/group). ***P < 0.001, **P < 0.01 by one‐way ANOVA.
Figure 3.
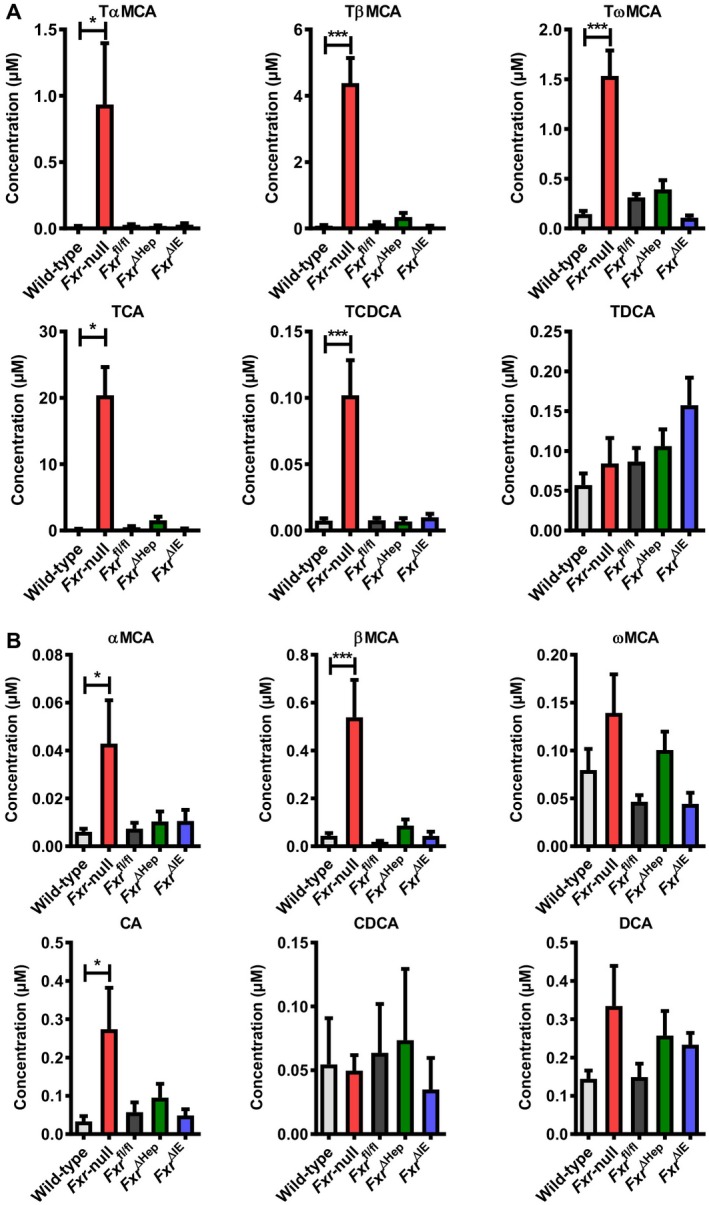
Serum BA profile in WT and whole‐body Fxr‐null, Fxr ∆Hep, Fxr ∆IE, and Fxr fl/fl mice at 20 months old. (A) Taurine‐conjugated BA concentrations. (B) Unconjugated BA concentrations. Values are expressed as means ± SEM (n = 8/group). ***P < 0.001, *P < 0.05 by one‐way ANOVA. Abbreviations: CDCA, chenodeoxycholate; TCDCA, taurochenodeoxycholate.
Figure 4.

Fxr‐null mice develop spontaneous hepatocellular tumors even at the earlier age of 14 months. (A) Numbers of tumor nodules per liver, and (B) ratios of liver‐to‐body weight and serum ALT activities in WT and whole‐body Fxr‐null, Fxr ∆Hep, Fxr ∆IE, and Fxr fl/fl mice (n = 7/group) at 14 months old. (C) Hepatic mRNA levels of cell‐cycle regulators (n = 7/group). mRNA levels were quantified by qPCR analysis, normalized to those of Ppia mRNA, and expressed as fold change relative to WT mice. Values are expressed as means ± SEM. ***P < 0.001, **P < 0.01, *P < 0.05 by one‐way ANOVA.
Figure 5.
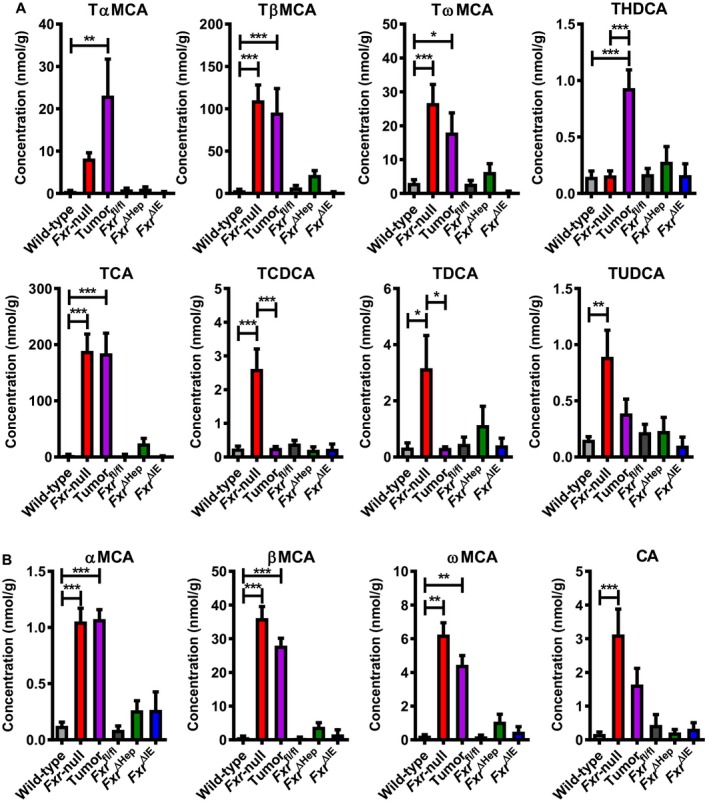
Hepatic BA profile in WT and whole‐body Fxr‐null, Fxr ∆Hep, Fxr ∆IE, and Fxr fl/fl mice at 14 months old. (A) Taurine‐conjugated BA concentrations. (B) Unconjugated BA concentrations. Values are expressed as means ± SEM (n = 7/group). ***P < 0.001, **P < 0.01, *P < 0.05 by one‐way ANOVA. Abbreviations: TCDCA, taurochenodeoxycholate, THDCA, taurohyodeoxycholate; TUDCA, tauroursodeoxycholate.
Figure 6.
Increased Myc/Cdk4 mRNA levels in 3‐month‐old Fxr‐null mice even in the absence of liver tumors. (A) Ratios of liver‐to‐body weight and (B) serum AST and ALT activities in WT and whole‐body Fxr‐null, Fxr ∆Hep, Fxr ∆IE, and Fxr fl/fl mice (n = 6‐7/group) at 3 months old. (C) Hepatic mRNA levels of cell‐cycle regulators in mice (n = 6‐7/group). mRNA levels were quantified by qPCR analysis, normalized to those of Ppia mRNA, and expressed as fold change relative to WT mice. Values are expressed as means ± SEM. ***P < 0.001, **P < 0.01, *P < 0.05 by one‐way ANOVA.
Figure 7.
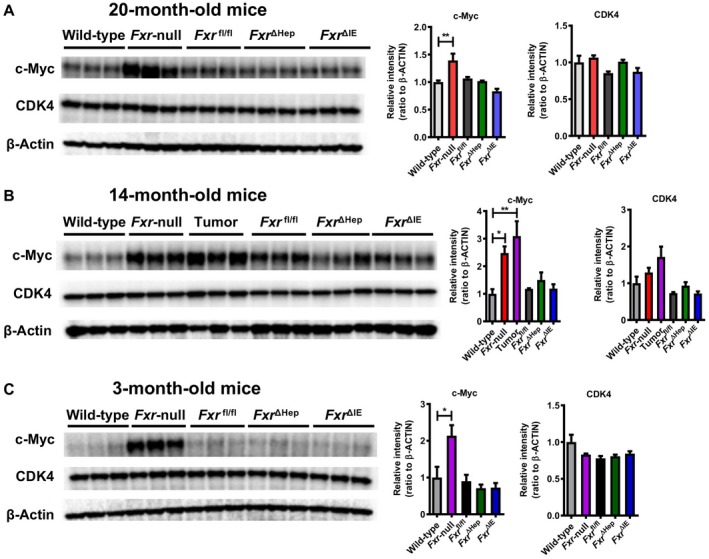
Immunoblot analysis of MYC/CDK4. Liver lysates (20 μg of protein) were electrophoresed with sodium dodecyl sulfate–polyacrylamide gel, transferred to a polyvinylidene fluoride membrane, and incubated with primary antibodies against c‐Myc and CDK4. The band of β‐actin was obtained by reprobing the membranes and was used as a loading control. Each band intensity was quantified using Bio‐Rad Image Lab software, normalized by those of the loading control, and subsequently expressed as fold change relative to WT mice of the respective age. Values are expressed as means ± SEM. ***P < 0.001, **P < 0.01, *P < 0.05 by one‐way ANOVA.
Figure 8.

TCA induces Myc expression only in Fxr‐null hepatocytes. (A) Primary hepatocytes isolated from WT and Fxr‐null mice were treated with 100 µM of TCA, TβMCA, or vehicle (DMSO) for 12 hours, and Myc mRNA levels were measured by qPCR (n = 3/group). mRNA levels were normalized to those of Ppia and subsequently expressed as fold change relative to those of vehicle‐treated WT hepatocytes. (B) Primary hepatocytes isolated from WT and Fxr‐null mice were treated with 0, 10, or 30 µM of TCA or vehicle (DMSO) for 12 hours, and Myc mRNA levels were measured by qPCR (n = 3/group). mRNA levels were normalized to those of Ppia mRNA and expressed as fold change relative to those of vehicle‐treated WT hepatocytes. (C) Primary hepatocytes isolated from Fxr ∆Hep or Fxr fl/fl mice were treated with TCA (100 µM), DCA (100 µM), TCA+DCA (100 µM each), or vehicle (DMSO) for 12 hours, and Myc mRNA levels were measured by qPCR (n = 4/group). mRNA levels were normalized to those of Ppia mRNA and expressed as fold change relative to those of vehicle‐treated hepatocytes from Fxr fl/fl mice. Values are means ± SEM. ***P < 0.001, **P < 0.01, *P < 0.05 versus control group by two‐way ANOVA. (D) Proposed mechanism on why the incidence of liver tumors is significantly lower in Fxr ∆Hep and Fxr ∆IE mice compared with Fxr‐null mice. Increased TCA levels are detected only in whole‐body Fxr‐null mice and TCA induces Myc expression only in Fxr‐null hepatocytes, thus promoting age‐dependent hepatic tumorigenesis in Fxr‐null mice. Therefore, disruption of intestinal Fxr alone is insufficient for liver tumor development because of normal TCA levels with intact hepatocyte Fxr function. Abbreviation: Veh, vehicle.
Results
Lower Incidence Of Liver Tumors In 20‐Month‐Old Tissue‐Specific Fxr‐Null Mice
We examined the prevalence of hepatic tumors in Fxr‐null, Fxr ∆Hep, and Fxr ∆IE 20‐month‐old mice to determine the influence of FXR disruption in different tissues on hepatic tumor formation. More than 90% of Fxr‐null mice had liver tumors, a finding consistent with published reports,11, 12 whereas the incidence of hepatic tumors in Fxr ∆Hep and Fxr ∆IE mice was as low as 20% and 5%, respectively (Fig. 1A). Most Fxr‐null livers were diffusely replaced with multiple tumors (Fig. 1A,C), and tumors in other organs were not seen in these mice. Liver weight, liver‐to‐body weight ratio, and serum AST and ALT activities were also markedly increased in Fxr‐null mice but not Fxr ∆Hep and Fxr ∆IE mice compared to respective control mice (Fig. 1B,D). Liver histologic analysis of nontumorous tissues revealed mild‐to‐moderate lobular inflammation in Fxr‐null mice (Fig. 1E), but there were no remarkable abnormalities in the nontumorous livers of Fxr ∆Hep and Fxr ∆IE mice (data not shown).
Hepatic Expression Of Myc/Cell‐Cycle Regulators In 20‐Month‐Old, Whole‐Body, And Tissue‐Specific Fxr‐Null Mice
The mRNA levels of Fxr and its downstream genes, such as bile salt export pump (BSEP, encoded by adenosine triphosphate‐binding cassette, subfamily B member 11 [Abcb11]) and nuclear receptor subfamily 0, group B, member 2 (Nr0b2, encoded by small heterodimer partner [Shp]), were significantly decreased in Fxr‐null and Fxr ∆Hep mice, while cytochrome P450 7A1 (Cyp7a1) mRNA was significantly elevated only in Fxr‐null mice (Fig. 1F). Although HCC is associated with persistent inflammation, cellular stress, and ensuing hepatic fibrosis, the mRNA levels of proinflammatory cytokines, oxidative stress‐generating enzyme (cytochrome b‐245 [Cybb]), and endoplasmic reticulum stress‐inducible gene (DNA‐damage inducible transcript 3 [Ddit3]) were not changed, except for chemokine (C‐C motif) ligand 2 (Ccl2) and transforming growth factor β1 (Tgfb1) (Supporting Fig. S1). Because overexpression of Myc, a crucial oncogene for HCC,18 and several G1/S and G2/M regulators, including cyclin D1 (Ccnd1) and Cdk4, have been frequently documented in human HCC,19, 20 the mRNA levels of these genes were measured; marked increases in Ccnd1, Ccne1, Cdk2a, Cdk4, and Myc were found only in 20‐month‐old Fxr‐null mice (Fig. 2).
Circulating BA Levels In 20‐Month‐Old, Whole‐Body, And Tissue‐Specific Fxr‐Null Mice
To determine the consequence of FXR disruption, serum BA profiles were quantified in Fxr‐null, Fxr ∆Hep, and Fxr ∆IE mice at the age of 20 months. TαMCA, TβMCA, T ωMCA, TCA (Fig. 3A), α‐muricholate (αMCA), βMCA, ωMCA, and cholate (CA) (Fig. 3B) were significantly increased in whole‐body Fxr‐null mice. However, such BA abnormalities were not found in Fxr ∆Hep and Fxr ∆IE mice. There were no significant differences in DCA and its taurine‐conjugated derivative (taurodeoxycholate [TDCA]) among the groups.
Hepatic Expression Of Myc/Cell‐Cycle Regulators In 14‐Month‐Old, Whole‐Body, And Tissue‐Specific Fxr‐Null Mice
Because most 20‐month‐old Fxr‐null mice had diffuse and massive liver tumors, we considered that increased expression of Myc and cyclins/CDKs and serum BAs might be a consequence of the increased tumor burden and ensuing intrahepatic cholestasis. To exclude this possibility and to clarify the interconnection of increased BA, Myc/cell‐cycle regulators overexpression, and hepatic tumorigenesis by whole‐body FXR disruption, liver phenotypes were assessed in Fxr‐null, Fxr ∆Hep, and Fxr ∆IE mice at the earlier age of 14 months. The prevalence of hepatic tumor was 100% in Fxr‐null mice but 0% and 14% in Fxr ∆Hep and Fxr ∆IE mice, respectively (Fig. 4A). The median number of liver tumors in Fxr‐null mice was less than that in 20‐month‐old Fxr‐null mice (Figs. 1A and 4A), and nontumorous and tumorous tissues were able to be clearly dissociated in 14‐month‐old Fxr‐null mice. Similar to 20‐month‐old mice, liver‐to‐body weight ratio and serum AST and ALT activities were increased only in Fxr‐null mice (Fig. 4B; Supporting Fig. S2A).
Among several cell‐cycle regulators/inhibitors, hepatic Ccnd1, Cdk1, Cdk4, and Myc mRNAs were highly increased in nontumorous and tumorous tissues of Fxr‐null mice but not in nontumorous tissues of Fxr ∆Hep or Fxr ∆IE mice (Fig. 4C; Supporting Fig. S2B). Myc is induced by several stimuli and following activation of oncogenic signaling, e.g., Wnt/β‐catenin, nuclear factor erythroid derived 2 like 2 (Nrf2)/sequestosome 1 (p62), Notch, and hedgehog pathways. Wnt8a and Wnt11 mRNA levels were significantly elevated in nontumorous tissue and tumors of Fxr‐null mice (Supporting Fig. S2C), while mRNA expressions of Nrf2/p62 and nicotinamide adenine dinucleotide phosphate (reduced form) dehydrogenase quinone 1 (Nqo1) a target gene of Nrf2, and Ddit3 were not changed (Supporting Fig. S2C). Additionally, mRNA levels of Cdkn1a (known as p21), a downstream gene of the Notch pathway, and smoothened frizzled class receptor (Smo), a key component of hedgehog signaling, were not altered among the groups (Supporting Fig. S2B,C). These results confirmed that Ccnd1, Cdk4, and Myc were up‐regulated even in 14‐month‐old Fxr‐null mice but not in Fxr ∆Hep or Fxr ∆IE mice, and this is likely associated with a significantly higher incidence of hepatic tumors.
Hepatic BA Levels In 14‐Month‐Old, Whole‐Body, And Tissue‐Specific Fxr‐Null Mice
Liver BA profiles were also assayed in Fxr‐null, Fxr ∆Hep, and Fxr ∆IE mice at the age of 14 months. The BAs that increased in both nontumorous and tumorous tissue of Fxr‐null mice but not Fxr ∆Hep or Fxr ∆IE mice were TβMCA, TωMCA, TCA (Fig. 5A), αMCA, βMCA, and ωMCA (Fig. 5B). Hepatic DCA levels were very low and did not differ among the groups (Supporting Fig. S2A). Collectively, TCA and TβMCA were the most abundant BAs in the livers of 14‐month‐old Fxr‐null mice and the sera of 20‐month‐old Fxr‐null mice, both of which showed a very high liver tumor incidence.
Increased c‐Myc Expression Only In The Livers Of Fxr‐Null Mice Even In The Absence Of Liver Tumor
To corroborate the link between up‐regulated Myc/cell‐cycle regulators and FXR disruption, we examined the livers of 3‐month‐old Fxr‐null, Fxr ∆Hep, and Fxr ∆IE mice in which tumors did not develop even in Fxr‐null mice. Similar to 20‐ and 14‐month‐old mice, liver‐to‐body weight ratio and serum AST and ALT activities were increased only in Fxr‐null mice (Fig. 6A). Additionally, hepatic mRNAs of Cdk4 and Myc were significantly increased in Fxr‐null mice but not in Fxr ∆Hep or Fxr ∆IE mice (Fig. 6B). Although Myc/Cdk4 mRNAs were increased only in Fxr‐null mice in common with the different ages, the increases in c‐Myc were only confirmed at the protein level (Fig. 7). Therefore, increased c‐Myc expression was likely a key driver of hepatic tumorigenesis in Fxr‐null mice.
TCA Induces Myc Expression In Fxr‐Null Hepatocytes
Increased BA levels were observed in Fxr‐null mice but not in Fxr ∆Hep or Fxr ∆IE mice (Figs. 3 and 5). Intestinal fibroblast growth factor (FGF) 15 (Fgf15) and hepatic BSEP (Abcb11), which are target genes of Fxr, play crucial roles in maintaining systemic BA concentrations. Hepatic Abcb11 mRNA levels were reduced in Fxr‐null and Fxr ∆Hep mice but not in Fxr ∆IE mice (Supporting Fig. S3). Additionally, ileal Fgf15 mRNA expression was decreased in Fxr‐null and Fxr ∆IE mice but not in Fxr ∆Hep mice (Supporting Fig. S4). The mRNA levels of liver receptor homolog 1 (LRH‐1, encoded by Nr5a2) were not different among the groups (Supporting Fig. S3). Therefore, impaired BA excretion from hepatocytes by low Abcb11 expression coupled with low intestinal Fgf15 expression was presumably one of the reasons for increased TCA/TβMCA only in Fxr‐null mice.
Based on the above results, the possibility exists that increased TCA/TβMCA levels might promote Myc overexpression in Fxr‐disrupted hepatocytes, accelerating liver tumorigenesis. To examine this possibility, primary hepatocytes isolated from WT and Fxr‐null mice were treated with TCA or TβMCA. Myc mRNA levels were significantly increased only in TCA‐treated Fxr‐null hepatocytes (Fig. 8A) in a TCA dose‐dependent manner (Fig. 8B).
We could not rule out the possibility that primary hepatocytes isolated from Fxr‐null mice were preprimed by BAs, and constitutively altered cell integrity. Additionally, because DCA is more toxic than TCA, it was not clear whether DCA could also induce Myc mRNA levels. To address this concern, primary hepatocytes isolated from Fxr ∆Hep or Fxr fl/fl mice were treated with TCA, DCA, and TCA+DCA. Myc mRNA levels were increased in Fxr ∆Hep hepatocytes treated with TCA and TCA+DCA but not with DCA (Fig. 8C). Collectively, these in vitro experiments confirmed a direct mechanistic link between the TCA‐Myc axis and hepatic tumorigenesis in the absence of hepatocyte FXR, enabling us to propose a novel mechanism on why the incidence of liver tumors is significantly lower in Fxr ∆Hep and Fxr ∆IE mice compared to Fxr‐null mice (Fig. 8D).
Discussion
This study revealed that global Fxr disruption is required for spontaneous age‐dependent hepatocarcinogenesis. Both hepatocyte‐specific and enterocyte‐specific Fxr disruption in mice resulted in a very low incidence of hepatic tumors, and this incidence was almost similar to that observed in WT C57BL/6N mice. However, global Fxr disruption in mice showed hepatomegaly, increased TCA levels, increased Myc expression, and marked incidence of liver tumors. The finding that TCA induced Myc expression only in Fxr‐null and Fxr ΔHep hepatocytes demonstrated that the combination of increased BA and FXR disruption in hepatocytes plays an important role in age‐dependent hepatocarcinogenesis in Fxr‐null mice.
Abnormalities in BA metabolism, such as increased TCA, and disruption of FXR signaling have been observed in HCC in humans and rodents.21, 22 Indeed, FXR activity may suppress HCC, and hepatic tumors spontaneously develop in Fxr‐null mice.11, 12, 23, 24 Because FXR regulates not only BA metabolism but also attenuates cellular stress and immune response associated with carcinogenesis, it remains unclear whether abnormalities in BA metabolism, disruption of FXR, or both are the cause or result of hepatocarcinogenesis in Fxr‐null mice. Results of the present study revealed potential synergistic roles of increased TCA and the absence of hepatocyte FXR in elevating Myc expression and promoting liver tumors, and the singular absence of Fxr in hepatocytes is not sufficient for promoting hepatic tumorigenesis and disrupting BA homeostasis. Indeed, others reported that no tumors were found in WT or Fxr ΔHep mice without treatment or with diethylnitrosamine only.25 However, with cholic acid treatment, some WT mice developed tumors while all Fxr ΔHep mice presented with severe liver injury and tumors.25 This finding may support observations in the present study that TCA induced Myc expression in Fxr ΔHep hepatocytes but not in Fxr fl/fl hepatocytes.
The expression of conventional cell‐cycle regulators was examined because some G1 cyclins and CDKs, such as Ccnd1 and Cdk4/6, were overexpressed in HCC.26, 27, 28 Although one study showed induction in G1 cyclins by LRH‐1, a nuclear receptor regulating BA/cholesterol metabolism,29 there were no significant differences in LRH‐1 levels in Fxr‐null mice. However, the present study found that c‐Myc, that plays a crucial role in HCC development due to induction of cell proliferation and migration,18 was overexpressed only in Fxr‐null mice. Additionally, TCA increased Myc expression in primary hepatocytes from Fxr‐null and Fxr ΔHep mice, indicating that not only Fxr disruption but also TCA increases are required for Myc activation in hepatocytes. TCA or TDCA have been reported to cause gastric or intestinal epithelial cell proliferation, respectively, through up‐regulating Myc,30, 31, 32 but to our knowledge, this is the first demonstration that TCA induces Myc expression in Fxr‐null hepatocytes. Future studies are needed to clarify the molecular mechanisms on how TCA induces Myc expression only in Fxr‐null hepatocytes. Because increased TCA levels and FXR down‐regulation are observed in human HCC, combinatory strategies, i.e., not only correcting/activating FXR signaling but also reducing serum/liver TCA levels, might be beneficial for chemoprevention of HCC.
Fxr ΔHep livers reportedly have increased basal expression of tumor suppressor p53 protein, apoptosis, and decreased basal cyclin D1 expression, which may prevent tumor development in Fxr ΔHep mice.25 BSEP transports BA from hepatocytes into canaliculi. In the present study, Abcb11 (Bsep) mRNA expression was significantly lower in both Fxr‐null mice and Fxr ΔHep mice compared to their wild‐type counterparts. BSEP expression was severely diminished in HCC tissues and markedly reduced in adjacent nontumorous tissues,33 and children with a deficiency in BSEP develop severe cholestasis and HCC at early ages.34, 35 Therefore, decreased BSEP might possibly have a role in tumorigenesis in Fxr‐null mice, resulting in TCA accumulation in the liver.
Most notable was the finding that a very low incidence of liver tumors occurred in Fxr ∆IE mice. Intestinal FXR activation can rescue Fxr‐null mice from hepatocarcinogenesis by restoring the intestinal FXR‐FGF15 axis, preserving intestinal epithelium integrity, and limiting hepatic inflammation and aberrant hepatocyte proliferation,36 demonstrating an important role for intestinal FXR‐FGF15 stimulation in HCC prevention. While intestinal FXR antagonism was recently proposed as a potential strategy for treating obesity, diabetes, and nonalcoholic fatty liver disease,1, 15, 37, 38 concerns arose about the possibility that enterocyte‐targeted FXR inhibitors might promote liver inflammation/injury and tumorigenesis. In the present study, serum AST, ALT, and TCA levels; hepatic expression levels of genes related to inflammation, cellular stress, and tumorigenesis; and actual incidence of hepatic tumors were similar between Fxr ∆IE and control Fxr fl/fl mice. Additionally, no induction of Myc was observed in 3‐, 14‐, and 20‐month‐old Fxr ∆IE mice. These results clearly demonstrate that disruption of intestinal Fxr alone is insufficient for liver tumor development because of normal TCA levels with intact hepatocyte Fxr function. This prompted us to conclude that singular intestine‐specific FXR antagonism would not increase the risk of liver tumorigenesis.
In conclusion, whole‐body loss of FXR signaling causes TCA elevation and Myc induction in the liver, eventually leading to age‐dependent hepatocarcinogenesis. This study revealed a relatively low incidence of hepatic tumors by FXR deficiency in either hepatocytes or enterocytes alone, likely due to the lack of increased TCA. These findings provide novel insights into the tight association between disrupted BA metabolism, FXR signaling, c‐Myc up‐expression, and hepatic tumorigenesis.
Potential conflict of interest
Nothing to report.
Supporting information
Acknowledgment
We thank Linda Byrd and John Buckley for help with the animal protocols and management of the mouse colony.
Supported by the National Cancer Institute Intramural Research Program, Center for Cancer Research, National Institutes of Health (NIH) and award U54 ES16015 (to F.J.G.), NIH 1R01AG049493, and NIH R01DK098336 (to M.L.), a Japanese Society for the Promotion of Science Research Fellowship for a Japanese Biomedical and Behavioral Researcher at NIH (KAITOKU‐NIH to S.T. and T.Y.), and the Japanese Society for the Promotion of Sciences, Advancing Strategic International Networks to Accelerate the Circulation of Talented Researchers (No. S2601 to F.T.).
References
Author names in bold designate shared co‐first authorship.
- 1. Tanaka N, Aoyama T, Kimura S, Gonzalez FJ. Targeting nuclear receptors for the treatment of fatty liver disease. Pharmacol Ther 2017;179:142‐157. [DOI] [PMC free article] [PubMed] [Google Scholar]
- 2. Kimura T, Kobayashi A, Tanaka N, Sano K, Komatsu M, Fujimori N, et al. Clinicopathological characteristics of non‐B non‐C hepatocellular carcinoma without past hepatitis B virus infection. Hepatol Res 2017;47:405‐418. [DOI] [PubMed] [Google Scholar]
- 3. Kimura T, Tanaka N, Fujimori N, Sugiura A, Yamazaki T, Joshita S, et al. Mild drinking habit is a risk factor for hepatocarcinogenesis in non‐alcoholic fatty liver disease with advanced fibrosis. World J Gastroenterol 2018;24:1440‐1450. [DOI] [PMC free article] [PubMed] [Google Scholar]
- 4. Komatsu M, Yazaki M, Tanaka N, Sano K, Hashimoto E, Takei Y, et al. Citrin deficiency as a cause of chronic liver disorder mimicking non‐alcoholic fatty liver disease. J Hepatol 2008;49:810‐820. [DOI] [PubMed] [Google Scholar]
- 5. Komatsu M, Kimura T, Yazaki M, Tanaka N, Yang Y, Nakajima T, et al. Steatogenesis in adult‐onset type II citrullinemia is associated with down‐regulation of PPARα. Biochim Biophys Acta 2015;1852:473‐481. [DOI] [PMC free article] [PubMed] [Google Scholar]
- 6. Llovet JM, Zucman‐Rossi J, Pikarsky E, Sangro B, Schwartz M, Sherman M, et al. Hepatocellular carcinoma. Nat Rev Dis Primers 2016;2:16018. [DOI] [PubMed] [Google Scholar]
- 7. Anakk S, Bhosale M, Schmidt VA, Johnson RL, Finegold MJ, Moore DD. Bile acids activate YAP to promote liver carcinogenesis. Cell Rep 2013;5:1060‐1069. [DOI] [PMC free article] [PubMed] [Google Scholar]
- 8. Meng Z, Wang X, Gan Y, Zhang Y, Zhou H, Ness CV, et al. Deletion of IFNγ enhances hepatocarcinogenesis in FXR knockout mice. J Hepatol 2012;57:1004‐1012. [DOI] [PMC free article] [PubMed] [Google Scholar]
- 9. Tanaka N, Matsubara T, Krausz KW, Patterson AD, Gonzalez FJ. Disruption of phospholipid and bile acid homeostasis in mice with nonalcoholic steatohepatitis. Hepatology 2012;56:118‐129. [DOI] [PMC free article] [PubMed] [Google Scholar]
- 10. Takahashi S, Tanaka N, Golla S, Fukami T, Krausz KW, Polunas MA, et al. Editor's highlight: farnesoid X receptor protects against low‐dose carbon tetrachloride‐induced liver injury through the taurocholate‐JNK pathway. Toxicol Sci 2017;158:334‐346. [DOI] [PMC free article] [PubMed] [Google Scholar]
- 11. Yang F, Huang X, Yi T, Yen Y, Moore DD, Huang W. Spontaneous development of liver tumors in the absence of the bile acid receptor farnesoid X receptor. Cancer Res 2007;67:863‐867. [DOI] [PubMed] [Google Scholar]
- 12. Kim I, Morimura K, Shah Y, Yang Q, Ward JM, Gonzalez FJ. Spontaneous hepatocarcinogenesis in farnesoid X receptor‐null mice. Carcinogenesis 2007;28:940‐946. [DOI] [PMC free article] [PubMed] [Google Scholar]
- 13. Liu N, Meng Z, Lou G, Zhou W, Wang X, Zhang Y, et al. Hepatocarcinogenesis in FXR‐/‐ mice mimics human HCC progression that operates through HNF1α regulation of FXR expression. Mol Endocrinol 2012;26:775‐785. [DOI] [PMC free article] [PubMed] [Google Scholar]
- 14. Sinal CJ, Tohkin M, Miyata M, Ward JM, Lambert G, Gonzalez FJ. Targeted disruption of the nuclear receptor FXR/BAR impairs bile acid and lipid homeostasis. Cell 2000;102:731‐744. [DOI] [PubMed] [Google Scholar]
- 15. Jiang C, Xie C, Li F, Zhang L, Nichols RG, Krausz KW, et al. Intestinal farnesoid X receptor signaling promotes nonalcoholic fatty liver disease. J Clin Invest 2015;125:386‐402. [DOI] [PMC free article] [PubMed] [Google Scholar]
- 16. Li F, Jiang C, Krausz KW, Li Y, Albert I, Hao H, et al. Microbiome remodelling leads to inhibition of intestinal farnesoid X receptor signalling and decreased obesity. Nat Commun 2013;4:2384. [DOI] [PMC free article] [PubMed] [Google Scholar]
- 17. Fang ZZ, Zhang D, Cao YF, Xie C, Lu D, Sun DX, et al. Irinotecan (CPT‐11)‐induced elevation of bile acids potentiates suppression of IL‐10 expression. Toxicol Appl Pharmacol 2016;291:21‐27. [DOI] [PMC free article] [PubMed] [Google Scholar]
- 18. Qu A, Jiang C, Cai Y, Kim JH, Tanaka N, Ward JM, et al. Role of Myc in hepatocellular proliferation and hepatocarcinogenesis. J Hepatol 2014;60:331‐338. [DOI] [PMC free article] [PubMed] [Google Scholar]
- 19. Fujimoto A, Furuta M, Totoki Y, Tsunoda T, Kato M, Shiraishi Y, et al. Whole‐genome mutational landscape and characterization of noncoding and structural mutations in liver cancer. Nat Genet 2016;48:500‐509. Erratum. In: Nat Genet 2016;48:700. [DOI] [PubMed] [Google Scholar]
- 20. Rao CV, Asch AS, Yamada HY. Frequently mutated genes/pathways and genomic instability as prevention targets in liver cancer. Carcinogenesis 2017;38:2‐11. [DOI] [PMC free article] [PubMed] [Google Scholar]
- 21. Zhang Y, Xu P, Park K, Choi Y, Moore DD, Wang L. Orphan receptor small heterodimer partner suppresses tumorigenesis by modulating cyclin D1 expression and cellular proliferation. Hepatology 2008;48:289‐298. [DOI] [PMC free article] [PubMed] [Google Scholar]
- 22. Niu Y, Xu M, Slagle BL, Huang H, Li S, Guo GL, et al. Farnesoid X receptor ablation sensitizes mice to hepatitis b virus X protein‐induced hepatocarcinogenesis. Hepatology 2017;65:893‐906. [DOI] [PMC free article] [PubMed] [Google Scholar]
- 23. Maran RR, Thomas A, Roth M, Sheng Z, Esterly N, Pinson D, et al. Farnesoid X receptor deficiency in mice leads to increased intestinal epithelial cell proliferation and tumor development. J Pharmacol Exp Ther 2009;328:469‐477. [DOI] [PMC free article] [PubMed] [Google Scholar]
- 24. Wolfe A, Thomas A, Edwards G, Jaseja R, Guo GL, Apte U. Increased activation of the Wnt/β‐catenin pathway in spontaneous hepatocellular carcinoma observed in farnesoid X receptor knockout mice. J Pharmacol Exp Ther 2011;338:12‐21. [DOI] [PMC free article] [PubMed] [Google Scholar]
- 25. Kong B, Zhu Y, Li G, Williams JA, Buckley K, Tawfik O, et al. Mice with hepatocyte‐specific FXR deficiency are resistant to spontaneous but susceptible to cholic acid‐induced hepatocarcinogenesis. Am J Physiol Gastrointest Liver Physiol 2016;310:G295‐G302. [DOI] [PMC free article] [PubMed] [Google Scholar]
- 26. Calvisi D, Eferl R. CDK4/6 inhibition and sorafenib: a ménage à deux in HCC therapy? Gut 2017;66:1179‐1180. [DOI] [PubMed] [Google Scholar]
- 27. Tanaka N, Moriya K, Kiyosawa K, Koike K, Aoyama T. Hepatitis C virus core protein induces spontaneous and persistent activation of peroxisome proliferator‐activated receptor alpha in transgenic mice: implications for HCV‐associated hepatocarcinogenesis. Int J Cancer 2008;122:124‐131. [DOI] [PubMed] [Google Scholar]
- 28. Tanaka N, Moriya K, Kiyosawa K, Koike K, Gonzalez FJ, Aoyama T. PPARalpha activation is essential for HCV core protein‐induced hepatic steatosis and hepatocellular carcinoma in mice. J Clin Invest 2008;118:683‐694. [DOI] [PMC free article] [PubMed] [Google Scholar]
- 29. Botrugno OA, Fayard E, Annicotte JS, Haby C, Brennan T, Wendling O, et al. Synergy between LRH‐1 and β‐catenin induces G1 cyclin‐mediated cell proliferation. Mol Cell 2004;15:499‐509. [DOI] [PubMed] [Google Scholar]
- 30. Yamaguchi J, Toledo A, Bass BL, Celeste FA, Rao JN, Wang JY, et al. Taurodeoxycholate increases intestinal epithelial cell proliferation through c‐myc expression. Surgery 2004;135:215‐221. [DOI] [PubMed] [Google Scholar]
- 31. Perrone EE, Liu L, Turner DJ, Strauch ED. Bile salts increase epithelial cell proliferation through HuR‐induced c‐Myc expression. J Surg Res 2012;178:155‐164. [DOI] [PMC free article] [PubMed] [Google Scholar]
- 32. Furihata C, Yamakoshi A, Hatta A, Tatematsu M, Iwata H, Hayashi K, et al. Induction of c‐fos and c‐myc oncogene expression in the pyloric mucosa of rat stomach by N‐methyl‐N'‐nitro‐N‐nitrosoguanidine and taurocholate. Cancer Lett 1994;83:215‐220. [DOI] [PubMed] [Google Scholar]
- 33. Chen Y, Song X, Valanejad L, Vasilenko A, More V, Qiu X, et al. Bile salt export pump is dysregulated with altered farnesoid X receptor isoform expression in patients with hepatocellular carcinoma. Hepatology 2013;57:1530‐1541. [DOI] [PMC free article] [PubMed] [Google Scholar]
- 34. Strautnieks SS, Byrne JA, Pawlikowska L, Cebecauerova D, Rayner A, Dutton L, et al. Severe bile salt export pump deficiency: 82 different ABCB11 mutations in 109 families. Gastroenterology 2008;134:1203‐1214. [DOI] [PubMed] [Google Scholar]
- 35. Knisely AS, Strautnieks SS, Meier Y, Stieger B, Byrne JA, Portmann BC, et al. Hepatocellular carcinoma in ten children under five years of age with bile salt export pump deficiency. Hepatology 2006;44:478‐486. [DOI] [PubMed] [Google Scholar]
- 36. Degirolamo C, Modica S, Vacca M, Di Tullio G, Morgano A, D'Orazio A, et al. Prevention of spontaneous hepatocarcinogenesis in farnesoid X receptor‐null mice by intestinal‐specific farnesoid X receptor reactivation. Hepatology 2015;61:161‐170. [DOI] [PubMed] [Google Scholar]
- 37. Jiang C, Xie C, Lv Y, Li J, Krausz KW, Shi J, et al. Intestine‐selective farnesoid X receptor inhibition improves obesity‐related metabolic dysfunction. Nat Commun 2015;6:10166. [DOI] [PMC free article] [PubMed] [Google Scholar]
- 38. Gonzalez FJ, Jiang C, Patterson AD. An intestinal microbiota‐farnesoid X receptor axis modulates metabolic disease. Gastroenterology 2016;151:845‐859. [DOI] [PMC free article] [PubMed] [Google Scholar]
Associated Data
This section collects any data citations, data availability statements, or supplementary materials included in this article.
Supplementary Materials