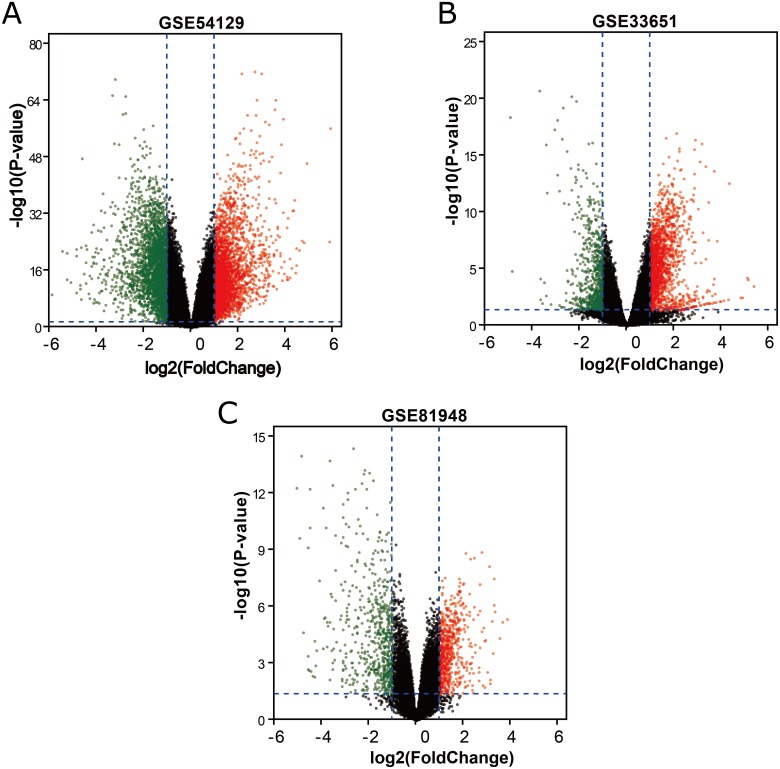
Figure 1. DEGs between GC samples and normal samples.
(A) The volcano plot for DEGs in GSE54129 data. (B) The volcano plot for DEGs in GSE33651 data. (C) The volcano plot for DEGs in GSE81948 data. x-axes index the log foldchange and y-axes index the -log (P-value). The red dots represent upregulated genes screened on the basis of |fold change| > 1.0, and adjusted P value of <0.05. The green dots represent downregulated genes screened on the basis of |fold change| > 1.0, and adjusted P value of <0.05. The green dots represent genes with no significant difference. FC is the fold change.

