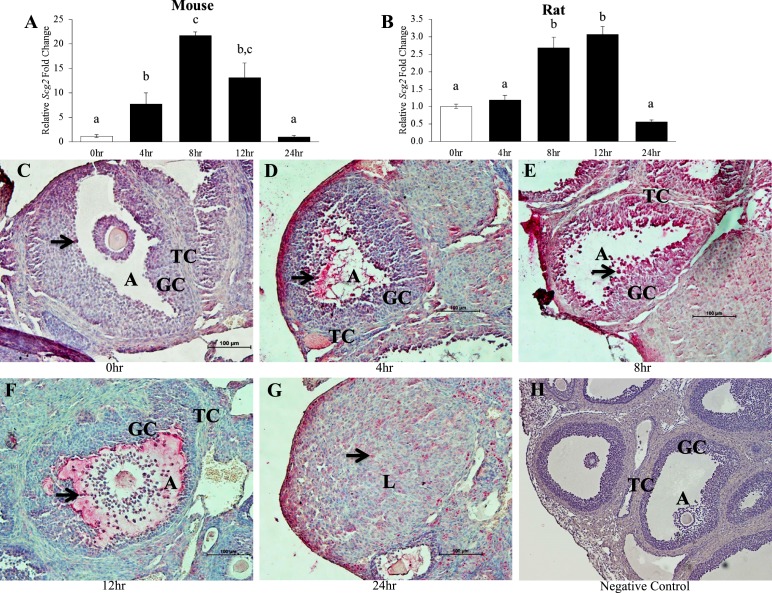
Figure 4.
Effect of hCG stimulation on (A and B) SCG2 mRNA and (C–G) protein in rodent granulosa cells in vivo. Whole ovaries and granulosa cells from immature mice and rats were collected across the periovulatory period following an ovarian stimulation protocol as described in “Materials and Methods.” (A and B) Granulosa cells were processed for mRNA isolation and cDNA synthesis and were subjected to qPCR to measure the mRNA levels of Scg2. All values were normalized to Rpl32. Graphs represent mean ± SEM. White bars indicate control samples, and black bars indicate hCG treatment samples. Bars that do not share a letter designation are significantly different (n = 5 to 8 rodents per group; P ≤ 0.05). (C–G) Whole ovaries from mice were processed for immunohistochemistry for SCG2 protein expression and localization. SCG2 staining is shown for (C) 0 hours, (D) 4 hours, (E) 8 hours, (F) 12 hours, (G) 24 hours, and (H) negative control samples. Pink/red indicates positive SCG2 staining, whereas blue/purple indicates negative staining as the slides were counterstained with hematoxylin. Black arrows indicate a specific cell/area that was stained positively for SCG2. Images are representative images from three mice per group. Scale bars, 100 μm. A, antrum; GC, granulosa cell; L, corpus luteum; TC, theca cell.

