Abstract
Motivated by the need to support those self-managing chronic pain, we report on the development and evaluation of a novel pressure-based tangible user interface (TUI) for the self-report of scalar values representing pain intensity. Our TUI consists of a conductive foam-based, force-sensitive resistor (FSR) covered in a soft rubber with embedded signal conditioning, an ARM Cortex-M0 microprocessor, and Bluetooth Low Energy (BLE). In-lab usability and feasibility studies with 28 participants found that individuals were able to use the device to make reliable reports with four degrees of freedom as well map squeeze pressure to pain level and visual feedback. Building on insights from these studies, we further redesigned the FSR into a wearable device with multiple form factors, including a necklace, bracelet, and keychain. A usability study with an additional 7 participants from our target population, elderly individuals with chronic pain, found high receptivity to the wearable design, which offered a number of participant-valued characteristics (e.g., discreetness) along with other design implications that serve to inform the continued refinement of tangible devices that support pain self-assessment.
Additional Key Words and Phrases: Self-report, Tangible User Interfaces, Experience Sampling Method, Ecological Momentary Assessment
1. INTRODUCTION
Chronic pain — that is, recurrent, persistent, or long-lasting pain — has been recognized by the World Health Organization as a serious public health problem around the globe. Worldwide, the prevalence of chronic pain is over 30% on average [Elzahaf et al. 2012], and numbers are considerably worse for the aging population: more than 50% of older adults and as many as 80% of older adults living in nursing homes experience chronic pain [Ferrell et al. 1995; Helme and Gibson 2001].
Common chronic pain conditions include osteoarthritis (OA), rheumatoid arthritis (RA), lower back pain, migraines, and headaches as well as injury-related conditions and repetitive stress disorders. Chronic pain impacts a wide range of disease and demographic groups [Goldberg and McGee 2011]; though, indicators of poor socioeconomic status (e.g., lower household income and unemployment) are significantly correlated with chronic pain conditions [Johannes et al. 2010], it is more common in women than in men [Fillingim et al. 2009], and, as mentioned, prevalence increases with age. Patients with chronic pain are frequently severely debilitated and face significant limitations in their ability to function or work. Further, chronic pain is associated with depression, sleep disturbance, fatigue, and decreased cognitive and physical abilities as well as overall reduced quality of life in terms of physical, psychological, and social well-being [Ashburn and Staats 1999].
Chronic pain is traditionally assessed based on patient recall during doctor visits once every 4–8 weeks, typically in the form of a self-report response to one of several standard pen-and-paper or verbal measures. However, such an approach faces problems. Namely, a growing body of literature indicates that reporting pain in this manner is affected by an array of retrospective and reconstruction biases [Schwarz 1999] and can have low test-retest reliability, especially for individuals with memory or other cognitive impairments [Coughlin 1990]. To mitigate these issues, researchers are increasingly turning to a class of data collection methods that afford in situ, frequent, and momentary assessment of physiological and psychological data: Ecological Momentary Assessment (EMA) [Stone and Shiffman 1994]. The validity of using momentary report to assess pain specifically has been previously validated [Stone et al. 2004] — though current instruments (typically diaries) still face limitations, as they can suffer from poor adherence and misreporting, especially if inconvenient to use [Bolger et al. 2003].
Aiming to relieve such burdens and improve data accuracy, coverage, and fidelity, passively sensing pain intensity has become a strategy of recent interest to the ubiquitous computing and pain research communities [Aung et al. 2016]. However, “pain is what the patient tells us it is” [McCaffery 1979] — in other words, pain is a subjective experience; and as such, self-assessment is still considered the best and truest descriptor of pain, making instruments that enable self-report essential to its effective measurement and, in turn, treatment.
Altogether, this motivates the development of novel tools for chronic pain measurement that support in-situ, naturalistic self-assessment that remains reliable and low burden even over prolonged periods of time. In this paper, we pursue the design of tangible, pressure-sensitive user interfaces that meet these requirements. We took this approach after observing the way in which people in moments of pain sometimes grasp the hand of a loved one, the arms of a chair, or some other object nearby. We were further inspired by the uncomplicated action of squeezing a stress ball, which can also be unobtrusive and very private. In seeking to integrate these types of interactions with intentional self-report, we make the following specific contributions:
A series of identified design challenges and practical trade-offs important to take into account when developing pressure-sensitive user interfaces for pain assessment.
Detailed hardware design specifications for three different versions of our tangible user interface intended to meet these constraints and other identified user requirements.
The findings of in-lab evaluations to demonstrate report reliability along with insights from interviews that provide an increased understanding of individual characteristics, preferences, experiences, and contexts that can impact chronic pain management practices and can inform the design of assessment tools aimed at meeting such needs, including more or less appropriate use cases and opportunities for future applications and refinements of our developed devices.
The remainder of the paper is organized as follows. We begin with background about pain and its assessment, including via technology, along with a review of previous work on pressure-based input devices and non-traditional pain reporting systems. We then describe in detail our approach and the iterative development of our first two versions of hardware. We then report both qualitative and quantitative results from lab studies evaluating the accuracy, feasibility, and users’ experiences reporting with our device. Next, we provide a description of the motivation, design, and evaluation of a third, wearable version, including qualitative insights from semi-structured in-person interviews with older adults with various types of chronic pain. We conclude by reflecting on the findings from our research, along with a discussion of alternative approaches and other opportunities for future work.
2. RELATED WORK
2.1 Assessing Pain
When it comes to assessing pain, there can be multiple dimensions to capture about the pain experience. Early research suggested three dimensions: discriminative, motivational-affective, and cognitive-evaluative [Melzack and Casey 1968] based on the neurophysiology of pain mechanisms; and subsequent work found that the words patients use to describe their pain often fall into categories that correspond to these dimensions [Mehack and Torgerson 1971].
More recently, pain has come to be characterized in terms of two dimensions commonly referred to as pain intensity and pain interference. Going beyond the mere presence of pain, intensity represents the severity of that pain (i.e, how much it hurts) while interference reflects how much the pain interferes with functioning, including one’s physical activities, mood, and social relationships (i.e., what the pain prevents a person from doing) [Cleeland et al. 1996]. Today, most pain assessment methods and scales focus on measuring pain intensity, given a consensus that “intensity of pain is without a doubt the most salient dimension of pain” [Turk and Melzack 2011]. Similarly, we therefore focus on measuring pain intensity in our work on developing frequent, in-situ self-report tools.
Instruments commonly employed for self-reporting pain include the Numerical Rating Scale (NRS) [Farrar et al. 2001], a version of the Faces Pain Scale (FPS) [Bieri et al. 1990; Hicks et al. 2001], a Pain Body Map (PBM) [Jaatun et al. 2014], or a variation of the Visual Analog Scale (VAS) [Hawker et al. 2011; Huskisson 1974]. FPS and PBM use drawings and visual representations to collect pain data, and NRS and VAS are unidimensional measures of pain intensity that typically use a horizontal or vertical line, with text descriptors at each end that describe the extremes of the scale (e.g., ”no pain” and ”pain as bad as it could be”). While these instruments are practically and clinically useful and enable generally straightforward administration, they do have limitations. For instance, test-retest reliability is normally high for the Visual Analogue Scale for Pain (VAS-P), but this reliability is lower among illiterate patients [Ferraz et al. 1990]; or, completion of the NRS is usually relatively brief (less than one minute) and easy, but it may be inadequate for capturing complex changes in pain levels and it is only intended for use with adults [Williams et al. 2000].
2.2 Using Technology to Support Pain Self-Assessment
As time goes on, these measures for self-reporting pain are increasingly being incorporated into technology-based reporting systems. Research typically confirms that studied measures are valid when deployed electronically, and further, (although it is not clear if it is a function of novelty, utility, user experience, or something else), studies tend to find that the electronic version is preferred by subjects [Gaertner et al. 2004]. As a result, there is a broad practice of deploying variations of the above measures or similar descriptive scales in modern technologies.
In particular, many tools focus on utilizing the smartphone medium due to its increasing ubiquity [Lalloo et al. 2015]. Smartphone applications developed by the academic community include ”ePAL” [Agboola et al. 2013] and ”Painometer” [de la Vega et al. 2014], which deliver standard pain intensity scales such as NRS and FPS. ”Pain Squad” [Stinson et al. 2013], which is designed to support pain management for adolescents with cancer, provides an electronic pain diary of 20 questions including VAS scales, body maps, selectable words, and free-text. A number of commercial pain assessment apps are available as well [Rosser and Eccleston 2011]; examples include ”Catch My Pain”1 and the ”Chronic Pain Diary”2.
Other research has focused on developing web applications or pervasive systems. For example, ”BodyDiagrams” [Jang et al. 2014] is an online interface that enables a user to indicate experienced pain and its intensity through drawings and other annotations. Similar work has developed tablet-and web-based programs for marking pain drawings [Jaatun et al. 2015]. Portable ”pain meters” that provide buttons to report pain levels have been developed as part of a pain monitoring system designed for use in hospital and home environments by nurses and patients [Alakarppa et al. 2009]. Research is also increasingly exploring novel interface functionalities and alternative styles of interaction to self-report pain. For instance, ”PainDroid” [Spyridonis et al. 2014] is a multimodal smartphone application that augments body-model based pain assessment with Virtual Reality (VR) functionality.
Such technological advancements are encouraging steps toward enhancing the self-assessment of pain and have been shown to facilitate pain management [McClellan et al. 2009; Vanderboom et al. 2014] and reduce associated emotional distress [Kristjánsdóttir et al. 2013]. However, scholars have called for more thorough evaluations of such tools to more confidently establish both their quality and usability [de la Vega and Miró 2014; Reynoldson et al. 2014]. Further, existing technologies for self-reporting pain still face several barriers to repeated, prolonged usage throughout daily life, in that their employed measures can be too time-consuming to support frequent use; are not discreet enough for individuals to feel comfortable using them in some contexts (e.g., social situations); and can be too burdensome to use [MacLeod et al. 2013], especially for individuals with cognitive impairments [Stephen 1996], low digital skills, or functional limitations (e.g., visual deficits) [Parker et al. 2013].
To address these challenges, we see a need to design novel self-report tools that better support quick, momentary, and unobtrusive use through intuitive, natural interactions. In particular, a portable personal device that provides a pressure-based interface seems an appropriate and desirable approach.
2.3 Pressure-Based User Input
Speaking to the value of pressure-based interaction, research has identified that pressure sensors are inexpensive, leverage and extend users’ familiarity with interaction styles, and, unlike tilt or motion sensors, do not require additional gross physical motions [Clarkson et al. 2006]. Numerous studies have explored such pressure-based input actions. For example, ”haptic conviction widgets” have been developed to allow (and at times require) users to convey their degree of conviction in performing an action, such as applying considerable force to permanently delete files from a trash can or using buttons that take different degrees of force to select [Chu et al. 2009]. A single-handed device made of pressure-sensitive, multi-functional strips found that linear strips afforded a number of interaction techniques, including controlling an on-screen slider or spring wheel, and that participants learned very quickly to exert the proper amounts of pressure [Blaskó and Feiner 2004]. Other work has investigated pressure-based input with a stylus, finding an individual’s control of pressure levels depends on there being a fixed number (at most six) of discrete pressure levels available [Ramos et al. 2004]. This has been confirmed by other research that reports three to seven discrete pressure levels allow accurate control of input [Cechanowicz et al. 2007; Mizobuchi et al. 2005]. This same work further indicates that greater force degrades the input experience, from both performance and comfort perspectives.
Such systems are based around a single-sided ‘push’ or ‘touch’ style interaction. Analogous to our inspiration of squeezing chair arms, a stress ball, or a loved one’s hand, there has been recent attention on two-sided pressure-based input instead — that is, a ‘grasp’ or ‘squeeze’ style interaction. Recent research has found that grasping or squeezing outperforms single-sided pressure-based input for tasks such as selecting a target and inputting a desired pressure [Stewart et al. 2010]. Further, this sort of squeezing has been experimentally confirmed as a viable input technique for device interaction, including over other interactions such as device tilting, though similar to the finding regarding single-sided pressure, performance degrades and input errors increase when greater force targets are used over longer time periods (specifically, longer than approximately three seconds) [Hoggan et al. 2011].
Regarding the use of pressure to assess physiological states, several researchers have used passively sensed pressure values as a way of inferring information about stress or affect. For example, higher typing pressure along with greater pressure put on one’s mouse has been associated with higher self-reported and sensed (via electrodermal activity, EDA) stress levels [Hernandez et al. 2014]. This experiment made use of a pressure-sensitive keyboard [Dietz et al. 2009] and further found through informal user testing that individuals were able to very quickly learn to control their input pressure. Custom-built devices have been developed for self-reporting affect as well, such as the ”Emotion Slider”, a long box with a round handle that can be pushed and pulled along the box’s main axis and that encounters resistance when pushed toward the ends of the device due to contained springs [Laurans et al. 2009].
The closest previous work to our research is a project from several decades ago that had subjects squeeze a bag in proportion to their pain severity [Huskisson 1974]. There is thus a compelling yet unseized opportunity to pursue the development of pressure-based pain self-report interfaces. In addition, continued contributions to the pressure-based user input literature is particularly timely given the widespread interest in and release of commercial devices with variable pressure inputs (e.g., Apple’s ”Force Touch” and more sensitive ”3D Touch” technologies3).
3. THE KEPPI SYSTEM (VERSIONS 1 & 2)
3.1 Design Considerations
As mentioned, our initial idea to design a pressure-sensitive tangible user interface (TUI) for self-reporting pain was inspired in part by a stress ball. Exploring this idea led us to create a compressible stick, which has many of the same affordances as a ball and not nearly as many physical design challenges. The design of this device, which we call ”Keppi”, was an iterative, experimental process during which we explored a variety of commodity pressure, flex, piezo-electric, and force sensors, all with different attributes such as flexibility, pressure thresholds, shape, and size, among many others.
The primary issue encountered with the commodity sensors was form factor. The two major issues with the form factor were that the cylindrical shape of the stick did not allow the sensor to sit flush against a rigid surface (which causes the signal to be very unpredictable and noisy) and that in order to cover enough surface area, many sensors would have to be used. Another issue we found with commodity force-sensitive resistors (FSRs) is that they generally are far too sensitive to withstand the force of a person’s grip. We did have some success with Flex sensors and plan to investigate them further. We also saw promise in some custom piezo-electric ceramic rings; however, they are quite fragile and subject to fracture, which could be harmful to users (e.g., by cutting a user while squeezing). After exploring all of these possibilities, we chose to design and experiment with custom FSRs.
In order to develop a robust FSR that could handle high thresholds of pressure while also having good resolution and sensitivity to lower pressures, we designed a series of sensors to test different force-sensitive resistive materials, different amounts of the material, different types and designs of electrodes, and different housings and mechanical designs. These prototypes were developed and benchmarked concurrently through a series of tests such as applying constant force with weights and clamps, testing the recovery time for varying the amount of impact and surface compression, and exploring the effect of different types of leads — both how they affect the change in resistance during compression as well as how they hold up physically given they are subject to bending. In the next section, we describe the hardware design and compare our first two versions of the Keppi TUI.
3.2 Hardware Design
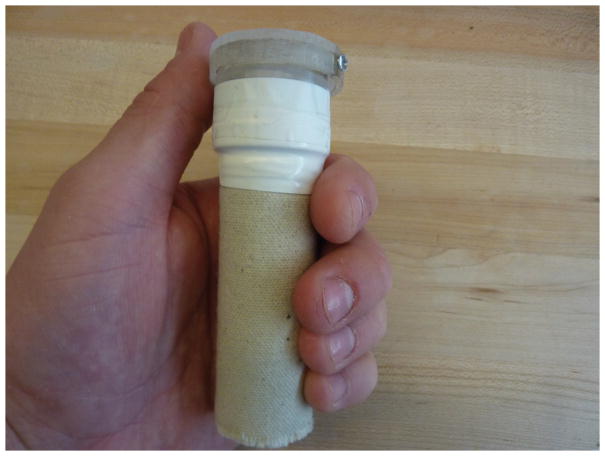
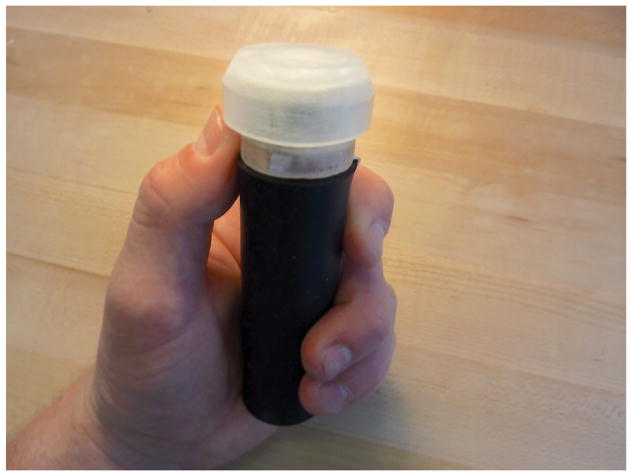
After running several pilot studies to determine the best basic structure of the hardware (weight, height, diameter, texture) and desirable materials to use, we developed two fully functional prototypes, as seen in Figures 1 and 2. While these prototypes are very similar, there are two major differences: the FSR design and the compressibility of each device.
Fig. 1.
Keppi Version 1
Fig. 2.
Keppi Version 2
3.2.1 Keppi V1 FSR
For Keppi V1, the design of the FSR consisted of a core electrode (copper tape) that covered the core shaft inside of Keppi, which is covered in medium density conductive foam. On top of this foam is an outer electrode that wraps all the way around the foam, as seen in Figure 3. The electrodes have industrial grade aluminum foil leads that are soldered into a board mounted at the top of the core. This entire system is cover in electrical tape to keep it isolated and stable. The outer electrode has a 3V charge pass through it, which then travels through the conductive foam to the core electrode. The output of the core electrode is passed into a signal conditioning circuit, which we will discuss in the electronics design section. When the foam is compressed, the density of the material is changed, which inherently changes the resistance (from approximately 60k Ohms to 7k Ohms) and the voltage/current.
Fig. 3.
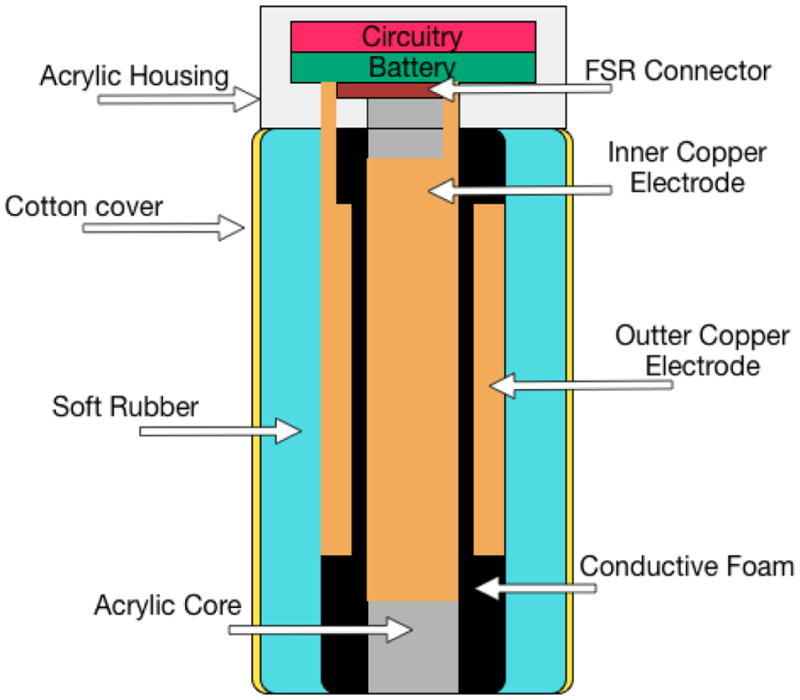
Keppi V1: sensor diagram
This design provided good resolution (approximately 30 points) and could handle a great deal of force. However, we found two major drawbacks. Specifically, the outer electrode’s lead encountered a great deal of movement, and the outer electrode would cause the conductive foam to temporarily deform in the case that a large change in pressure occurred. This resulted in the output signal sometimes getting stuck or behaving erratically while the material was returning to its neutral state. When heavy or rapid compression would occur, the outer electrode would crinkle, deforming its shape and the foam’s resistive qualities.
3.2.2 Keppi V2 FSR
Before retiring Keppi V1, we began developing Keppi V2. Taking into account some of the previous design issues, we primarily focused on creating a more stable FSR and increasing the resolution. The FSR in Keppi V2 was designed using two core electrode plates, each covering approximately half of the core shaft, as seen in Figure 4. This design immediately resolved the issue of mechanical wear on the FSR’s leads. The two electrodes were wrapped with the same conductive foam as V1; however instead of covering this in tape, we used thread evenly wrapped around to gently hold the components in place. This was then covered in a thin latex sleeve in order to prevent the outer layers, which are somewhat sticky, from damaging the foam. This FSR sees a change in resistance from 17k Ohms when not compressed to approximately 9.5k Ohms when fully compressed. While this is a much smaller range than demonstrated in V1, it has a much higher resolution due to the proximity and size of the electrodes, affording the user more control over the signal.
Fig. 4.
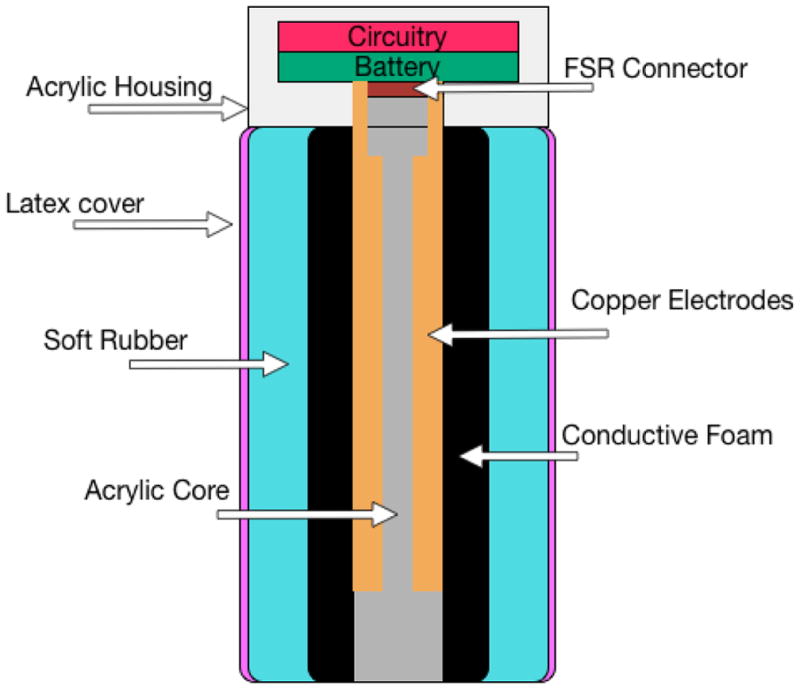
Keppi V2: sensor diagram
3.2.3 Casing
An important consideration when designing technologies that leverage force sensitive resistive materials is the design of the enclosure. This is particularly important when dealing with materials that are constantly being physically manipulated. It is important to design the system in a way that affords easy manipulation for the user yet still easily and quickly returns to a nominal state.
In Keppi V2, we achieved this by balancing the distribution of physical constraints with the ability to manipulate the device in meaningful way. The solution we arrived at was to use a flexible, thin latex that was firm enough to hold everything together but that also allowed the sensor to return to a nominal state rapidly, even after elongated periods of intense manipulation. The only part of the system that demonstrates physical constraint is the top of the device, in order to prevent the sensor from being pulled off or the electrodes from being damaged.
3.2.4 Making it squishy
We explored many different materials in order the find the optimal balance between a providing a squishy, stress ball-like texture and affording users control over input pressure. The material we selected is a soft, polyurethane rubber (Durometer 40A). This material combined with the soft, compressible conductive foam underneath provided a good balance in tactile sensation and control. It also demonstrated rapid recovery so that the sensor could easily normalize, and it was extremely resilient to tearing or misshaping.
3.2.5 Electronics
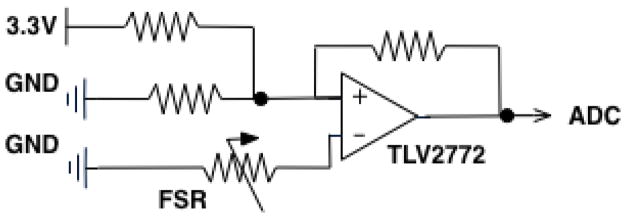
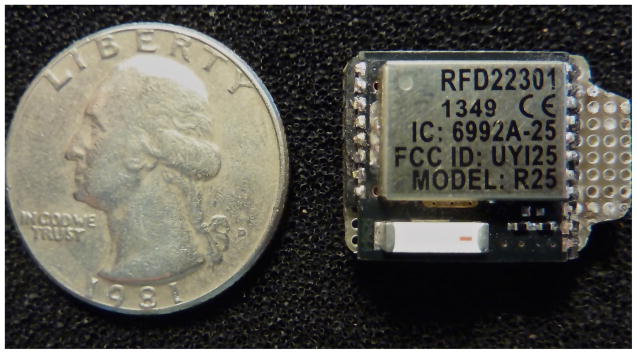
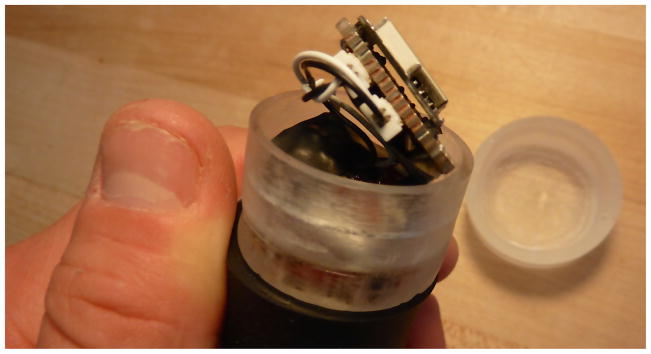
The electronic core of Keppi consists of three main components: analogue signal conditioning, Microprocessor, and Bluetooth Low Energy (BLE) (see Figure 5). For the signal conditioning circuit, we made use of a transimpedance (voltage to current) op-amp design using the Texas Instruments TLV2772 op-amp. We use a combined microprocessor/BLE chip (RFD22301) to read the signal with its onboard 10-bit Analog to Digital Convertor (ADC) and transmit it to a mobile device via BLE (see Figure 6).
Fig. 5.
Electronic schematic for Keppi V1 and V2
Fig. 6.
BLE and micro-processing unit (RFD22301)
The circuit also has a 3V, 0.25mA voltage regulator, breakout cable for USB programming, and connects directly to a 110mAh Polymer Lithium Ion Battery, which is attached to a micro-USB charging circuit (see Figure 7). All of these components fit in an acrylic housing on the device, in which they connect directly to the FSR. In order to manage voltage irregularity in the ADC, a signal is sent directly from the voltage regulator to another ADC, which can then be used as a coefficient to eliminate noise on the signal.
Fig. 7.
Electronics outside of the housing connected to the FSR
4. SYSTEM EVALUATION
We conducted in-lab usability and feasibility studies with a convenience and snowball sample of 28 participants recruited via in-person intercept and email. The average age was 25 years old (min 19, max 38); 10 participants were female, 18 male; and 10 of the 28 were experiencing some form of chronic pain (e.g., injury-related ankle or neck pain, frequent migraines, or lower back pain). Participants were compensated $10. The Cornell University IRB approved the study protocol.
Participants were given Keppi to hold and asked for their initial impressions regarding the device and how it might be used to report a value such as pain intensity. After confirming or explaining Keppi’s mapping from squeeze intensity to value range, participants familiarized themselves with this mapping by squeezing the device while being provided real-time visual feedback of squeeze intensity on a slider widget (no numbers were displayed). Once familiarized, participants completed three tasks while being provided visual feedback of the pressure they were applying:
Report the highest possible value (hardest squeeze)
Report a medium value and release, a high value and release, a low value and release.
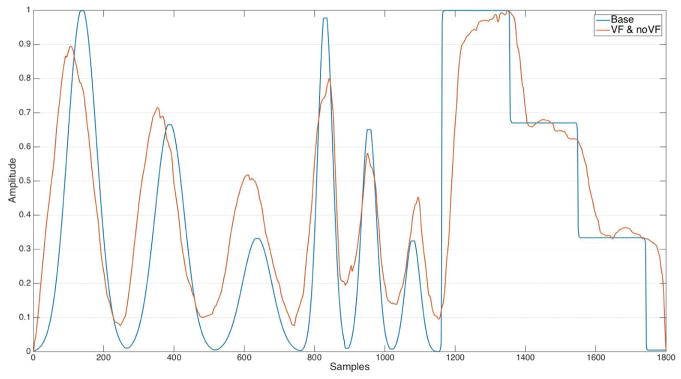
Watch an animation of a red circle tracing a series of sinusoidal curves and a step function (see Figure 8), and continuously report the values traced using Keppi.
Fig. 8.
Sinusoidal and step function curves for the continuous tracking tasks.
Participants then repeated these three tasks, this time without visual feedback of the pressure they were using. In concluding the study session, participants were asked some open-ended questions about their interaction with Keppi.
The first 10 participants used Keppi V1 and were provided their visual feedback on a smartphone, with Keppi transmitting data via Bluetooth LE. The next 18 participants used Keppi V2, which had been constructed and was available for evaluation by that time, and were provided with the same visual feedback but this time on a laptop screen, with Keppi transmitting data via a serial port. Given the improvements of Keppi V2 over V1 described above, we report quantitative findings only from the 18 participants using Keppi V2, though qualitative findings come from all 28 participants.
5. RESULTS AND DISCUSSION
5.1 Qualitative Responses
When initially handed Keppi and asked how they might use it to report pain levels, many respondents assumed squeezing to be the reporting modality. The squishy stick form-factor invites such a grip. Our design inspirations may also have been evident considering multiple participants suggested Keppi was like a stress ball. Two thought it might be a microphone, and one (P9) thought Keppi might “test my physiological status while holding it” — perhaps thinking of the handles on gym exercise machines that infer heart rate while being held.
Participants on the whole found the mapping from squeeze intensity to pain level made sense — e.g., “it is pretty intuitive, I naturally relate pain to more squeezing” (P5). Some of these participants along with others did identify several scenarios in which squeezing to report pain would make less sense though — e.g., “if I have a headache I don’t want to do anything to force more pressure” (P7).
In daily life, most participants imagined carrying the Keppi in trouser pockets, jacket pockets, and bags — e.g., “in the side pocket of my backpack; its the exact same size as my mace which I keep there too” (P6), though some participants expressed concern about the potential for accidental reporting, for example by sitting on Keppi. P10 reported wanting to wear Keppi around the neck. Although we did not ask about the use of Keppi in a clinical environment, several participants observed that the device could be deployed in such settings too. For example, P7 observed, “If I am having my teeth removed, I cannot communicate with the doctor. This device could be used to gauge pain scales to the doctor based on the force I use on the device.”
Toward the end of the session we invited participants to describe Keppi in three words. Keppi was viewed as convenient, useful, intuitive, easy-to-use, and practical. For some, Keppi was portable, compact, light, and mobile; though for others, it seemed bulky, heavy, and jerky. While it seemed advanced, innovative, technological, and interesting, Keppi for others came across as medical, confusing, and weird. Similarly, some users found Keppi to be fun, squishy, and to feel good to hold, while others did not like the (V1) texture.
One further reaction we probed was whether without the on-screen visual feedback, participants felt we should add an explicit feedback signal to Keppi to indicate that a squeeze was being monitored or provide a confirmation signal that a squeeze report had been received. We received mixed responses from participants. Just over half felt that additional feedback either was not necessary or at least not all the time, especially because the tactile sensation of squeezing Keppi itself provided such cues. The remainder of participants expressed interest in either a light or vibration-based indicator of a self-report being captured.
Based on this feedback, and while developing V2, we removed the cloth material cover and made the device easier to squeeze, as V1 was widely considered not squishy enough — e.g., “I would like it be more elastic because when I want to squeeze with more strength, I feel too much resistance with this” (P2). This issue of squishiness was one of both hedonics as well as perceived reporting range and resolution — with a squishier Keppi, participants believed it would be easier to report more values more accurately.
5.2 Quantitative Findings
For quantitative analysis, we separated out our data from the low/medium/high reporting task from the data from the continuous tracking task. For each participant, we have data from the condition where visual feedback was provided (VF) and the condition where no visual feedback was provided (NVF).
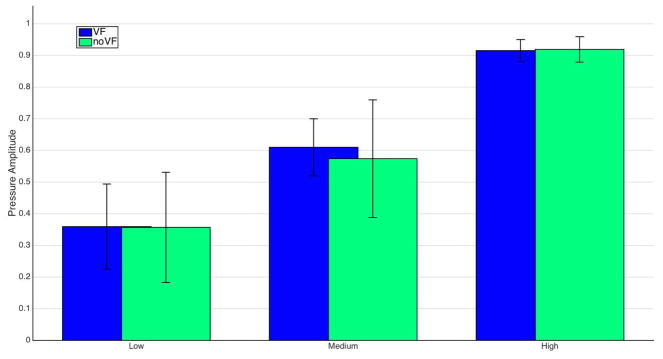
As shown in Figure 9, in the low/medium/high reporting task, we find via a one-way ANOVA that the means of none/low/medium/high reporting levels are significantly different in both the VF (p < 0:0001; F = 144:12; DoF = 2) and NVF (p < 0:0001; F = 61:73; DoF = 2) conditions, as well as when we ignore the visual condition and average them together (p < 0:0001; F = 132:46; DoF = 2). A two-way ANOVA between the VF and NVF conditions overall shows no significant difference (p = 0:78; F = 0:25; DoF = 2), indicating that participants were able to report intensities with four degrees of freedom both with and without visual feedback.
Fig. 9.
Participants were able to report intensities with four degrees of freedom (no pain is 0) with visual feedback or no visual feedback.
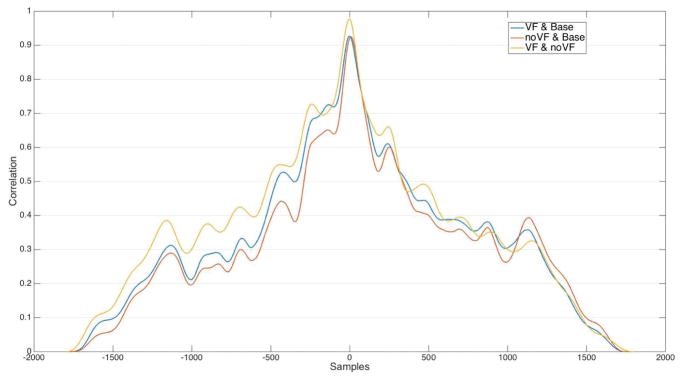
To analyze the continuous tracking task, we prepared the data by normalizing both the baseline curve and the user-tracking data. It was not necessary to normalize or fit the data in the x dimension, as it was equally spaced 1D data at the same sampling resolutions. We then looked into how well participants were able to track the baseline curve using Keppi. A visual inspection of the data (see Figure 10) indicated that participants on average tracked the baseline curve very well. Performing a cross-correlation of baseline and VF, baseline and NVF, and VF and NVF (see Figure 11) confirmed that each of these series were pairwise highly cross-correlated (0.98 w/lag = −0.044 sec, 0.93 w/lag = 0.1556 sec, and 0.92 w/lag = −0.0667 sec). Cross-correlation is a measure of the similarity of two series as a function of the lag of one relative to the other; in our data, we neither anticipated nor found a lag (participants tracked the baseline curve in real-time), so the peak in the cross-correlation plot is at lag=0. Similar to that from the visual inspection, this result shows that participants were able to very closely track the baseline curve in the continuous tracking task, both with and without visual feedback.
Fig. 10.
Visual comparison of the normalized and averaged continuous tracking data, over all data (orange) as compared to the baseline curve (blue).
Fig. 11.
Cross-correlation of Keppi continuous tracking task data: VF vs baseline (blue), NVF vs baseline (red), and VF vs NVF (yellow). The series are all highly correlated.
While we were able to quantitatively distinguish between different squeeze pressures, participants did report a perception of less pressure control at lower pressure levels. There is some evidence from prior research that there may be less pressure control at lower pressure levels [Ramos et al. 2004], though other work has found no such association [Srinivasan and Chen 1993]. In the case of Keppi, the squeezable material wrapped around the device does not deform linearly; rather, it deforms more easily at lower pressures when it is relatively less dense — and this may contribute to a perception of less control at lower pressure levels. This perception of differential control warrants further investigation, both in order to refine the user experience and to rule out its impact as a possible reporting bias.
Regarding visual feedback, which some prior work has reported is needed to ensure accurate pressure-based input [Shi et al. 2008; Stewart et al. 2010], our findings suggest that visual feedback may not be necessary for accurate reporting at four levels of pain intensity, at least after training. Though we found that participants apparently learned to calibrate self-reporting quite quickly, it is important to confirm that individuals can continue to accurately report using a TUI day after day and over long periods of time. Given one intended use case for Keppi is an EMA-style day-to-day report, we imagine this repeated use would serve as a sort of continued training and ever-increasing familiarity with the input interaction and how to fine-tune one’s reporting accuracy. Still, it may be desirable to explore the incorporation of feedback, including non-visual formats such as audio feedback, which previous research has suggested can be highly useful to improve pressure accuracy [Wilson et al. 2011].
5.3 Limitations
The squeeze-based self-report of Keppi is not intended for use by individuals experiencing some form of hand or wrist pain or movement limitation. Diminished strength or grip ability otherwise is not such an issue; the input sensitivity range can be adjusted and the output normalized. It has also become clear through our studies that for some other conditions such as migraines, pressure-based reporting may not be ideal.
Further, it is necessary to investigate the importance of on-device feedback that is provided during the reporting action (mid-squeeze), to indicate that a report has been captured (post-squeeze), or at both times. Our intuition is that, like a button, simply squeezing Keppi would provide sufficient (haptic) feedback that a squeeze is taking place; though, some vibration on-device or a notification of some sort on a connected smartphone may be useful. It is also possible that as the user becomes familiar with Keppi and can see accumulated reports or end-of-day summaries of their collected data, post-squeeze feedback would become less helpful. Furthermore, over time or in more public settings, such feedback might even become intrusive or a privacy concern. Exploring such trade-offs is a worthwhile next step.
Next, at higher pressure levels and for longer target tasks, pressure-based input may result in participant muscle fatigue [Heo and Lee 2011; Mizobuchi et al. 2005]. Empirically, the only participants to report fatigue when using Keppi were those seeking to maximize the high pressure value (i.e., to make the feedback slider widget go all the way to the top) and three participants that experienced some fatigue after the continuous tracking task (lasted 48 seconds and performed twice). We believe participant fatigue can be ameliorated in three ways: first, by increasing the squishiness of the device such that reporting across all pressure levels requires less exertion; second, by tailoring the reporting range to the individual, such that for any strength capability, reporting a high value requires, say, 70% of a max squeeze; and third, by recognizing that in EMA-style reporting, there will rarely be target tasks longer than a few seconds, and in a clinical continuous reporting setting, clinicians can invite subjects to report a low baseline level of pain and indicate only spikes in pain using Keppi, as appropriate.
6. KEPPI V3
6.1 Design Considerations
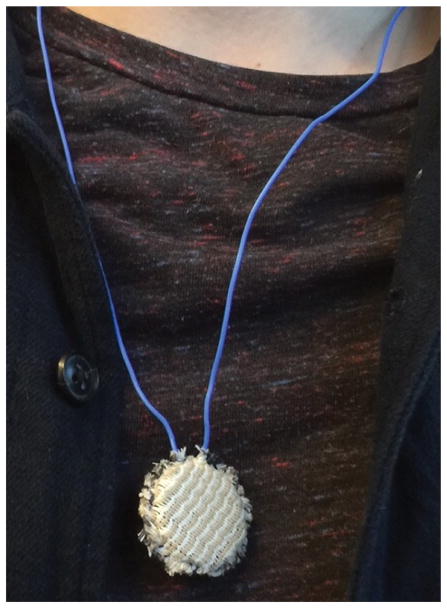
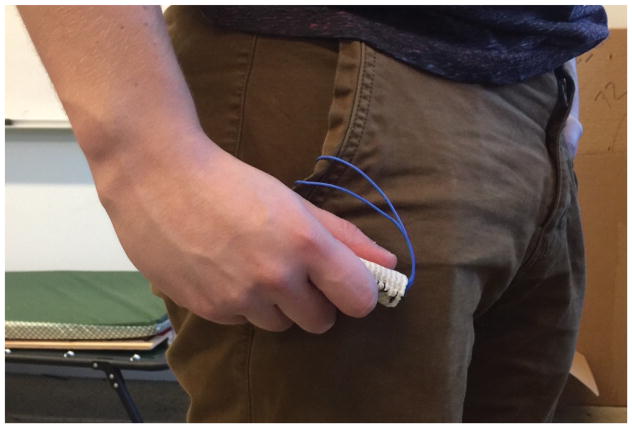
Finally, in order to explore additional materials and form factors and investigate which designs might be most suitable for elderly individuals with chronic pain, we examined the use of Keppi as a wearable device (Keppi V3). Prior research has found that when given the choice between a wearable device and a mobile application for self-reporting pain, over 2/3 of individuals preferred the wearable version [Rodríguez et al. 2016]. Based on such findings, we settled on two different form factors: one is a coin shaped disk (as seen in Figure 12), and the other is a small cylinder (as seen in Figure 13). To issue a self-report, either device can be squeezed between the thumb and the side of the index finger or by gripping the device in the palm of the hand. Both were fabricated as a necklace and as a keychain, though they could be modified to take on many form factors.
Fig. 12.
Keppi V3 worn as a necklace
Fig. 13.
Keppi V3 worn as a keychain
6.1.1 Hardware Design
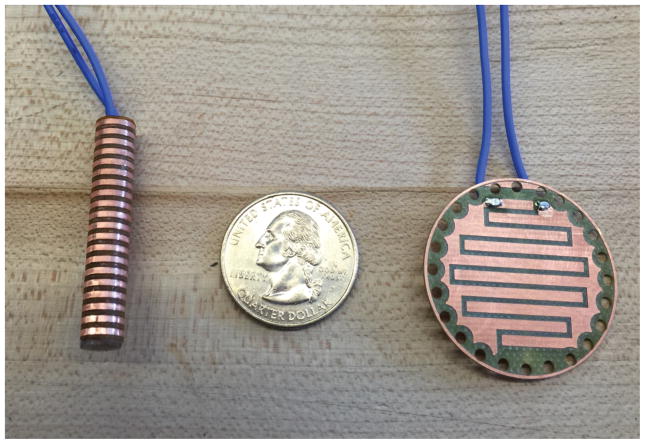
The primary difference between the hardware of Keppi V3 and the previous versions (beside the size and shape) is the electrode design, casing, and type of foam used in the FSR. We used several different materials, including various rubbers and foams, mixed with piezo-resistive foams and films to look deeper into how different levels of compression affected users’ experiences with Keppi. All V3 variations were covered in the same elastic cloth, which is commonly used as a medical wrap. We also changed the electrode design, as seen in Figure 14, to better balance how the distribution of pressure affected output.
Fig. 14.
Electrodes for the two variations of Keppi V3
6.1.2 Electronics
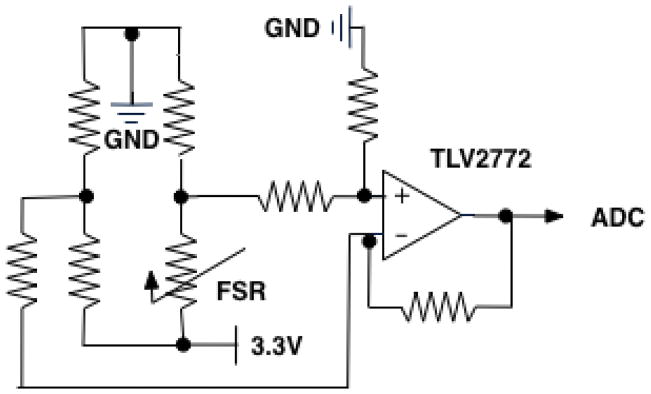
Considering Keppi V3’s move to a smaller size, we made modifications to the electronics that would allow for usage to maintain resolution within a small change in resistance. Specifically, we used a Wheatstone bridge amplification circuit, as seen in Figure 15, instead of the transimpedance amplifier circuit for signal conditioning used in Keppi V1 and V2. We also moved the electronics in such a way that they would suit the new size and design of the FSR, connecting them with silicon wire that also served as a chain for the device (e.g., a necklace chain).
Fig. 15.
Schematics for Keppi V3
6.2 Study
To assess usability, receptivity, and other qualitative reactions toward Keppi V3, we conducted semi-structured in-person interviews with 7 older adults (5 females, 2 males ranging from 58–72 years old, with an average age of 65) all with various types of chronic pain (e.g., arthritis, rotator cuff injury, knee replacement surgery). Participants were recruited through emailing chronic pain patients and through snowball sampling, compensated $20, and Cornell’s IRB approved all procedures. Semi-structured interviews were specifically used to surface, explore, and probe for key elements from participants’ responses and reactions, as well as to avoid acquiescence bias. Interviews lasted 30–60 minutes and were audio-recorded, transcribed verbatim, and edited to remove identifiers and other references that may identify the participants and/or anyone they mentioned during the interview. Data analysis was conducted using thematic analysis [Boyatzis 1998] whereby we collaboratively and iteratively refined themes to produce the following findings.
While two participants thought the Keppi devices resembled a treatment apparatus (e.g., that would administer some sort of drug or electrical pulse to the area where it was applied), all participants quickly warmed to the idea of using Keppi V3 to self-report pain.
The majority of the participants felt that squeezing was a natural interaction, associating higher levels of pain with harder squeezes — e.g., “If it’s a small pain that I want to record, probably a quick squeeze would mean a low amount of pain. If it was longer and harder, it would mean more pain” (P1). Keppi was also seen as a potential outlet for pain, with squeezing as a way to express and externalize negative perceptions and experiences with pain. Two participants, however, thought pressure was too subjective and found it more intuitive to map pain level to the number of squeezes or the length of a squeeze rather than the intensity of a squeeze — e.g., “I think squeezing it 1–5 seconds. 1 second for a quick, sharp pain; 5 seconds if it’s really, really intense. Holding onto it 5 seconds is not too long… Or, you could press it 5 times. That’d be better - the number of touches instead of the length of them. That’s my preference” (P6).
Other participants were concerned about the likelihood of unintentional logging, given that a small device like Keppi could be easily be sat on, pressed against, or otherwise triggered accidentally; and they thought certain patterns of touch, as opposed to pressure alone, might be helpful in combatting such misreports. Similarly, P6 suggested that some form of visual feedback after logging a pain episode would be helpful, so that he would not have to worry that the device had accidentally failed to record a severe instance of pain. Further, P7 pointed out that any sort of squeezing might be problematic given her arthritic hand pain and suggested a similar form factor but with a dial or knob. Two other participants likewise suggested incorporating buttons onto the device (P4), not unlike an electronic car key fob (P5), in order to remove some of the ambiguity and potential inconsistency associated with pressure-based input.
None of the participants found Keppi V3 to be bulky or heavy (in contrast to the findings of V1/V2), and most preferred the flat, coin-shaped form factor rather than the cylindrical version akin to a miniature Keppi V2. They envisioned wearing the device as a necklace or on one’s wrist, belt, or keychain; however, not all participants shared the same viewpoint when it came to wearability. For example, two participants (one female, one male) wanted to wear Keppi around the neck (e.g., because it fit with one participant’s aesthetic sense and fondness for necklaces); while other participants were adamantly opposed to that idea because it would be “obnoxious” (P1), “too obvious and not fashionable enough” (P5), or would exacerbate pre-existing neck pain (P7).
Regardless of the specific look-and-feel of the device, overall, two qualities were most important to participants: they wanted a device to be handy and discreet. First, participants explained that it was important to have the device easily accessible throughout the day (e.g., including while sleeping-P6), which did make a body-worn Keppi more appealing (e.g., participants believed a wristband might be more accessible and less likely to be lost compared to, for instance, a keychain, which at least 2 participants mentioned often not carrying with them).
The second feature that participants strongly valued in a logging device like Keppi was for it to be inconspicuous and unlikely to draw attention. It was important that Keppi could be easily concealed (for instance by slipping it under a shirt) or that it could be passed off as a common fitness device - e.g., “I tend to be more private about my pain. I don’t want to talk to people about it. Don’t want them to know I’m in pain. I don’t want them coming up and saying to me, ‘What is that little thing that you’re squeezing?’” (P1) Most participants emphasized that this was not because they were ashamed of their pain or wanted to hide the fact that they had a pain condition (which several participants explained was evident anyway, given that they carried canes, had noticeable trouble walking, or frequently massaged a painful body part). Rather, they just “don’t want to make a big deal out of it” (P6).
While participants appreciated Keppi’s ability to be discreet and privacy-sensitive, participants described social benefits that could stem from its use as well. For example, one participant noted that if his family witnessed him trying to log pain with Keppi, they would be comforted that he was taking proactive steps to manage his condition; and another participant said she would like to use the collected data to “prove” she was experiencing severe pain in order to gain empathy from her spouse. Logs of pain data could similarly supply credibility when discussing treatments with doctors, as participants explain Keppi could help them substantiate intuitions about how pain fluctuates with real evidence or help overcome the limitations of retrospective recall they normally face when trying to convey their recent pain experiences during clinical visits. Some participants were also interested in seeing their own data to learn more about the patterns of their experience of pain.
Overall, these interviews suggest that a discreet, body-worn tangible user interface like Keppi V3 would be positively received by a diverse set of older individuals experiencing chronic pain. At the same time, our findings illustrate the importance of understanding and accommodating personal preferences and nuances in various physical and aesthetic design choices - for instance by allowing a user to manipulate the device in one of several ways to report pain (e.g., using pressure, duration, or number of touches) or by providing ways to customize the appearance of the device (e.g., “If it had different covers, multicolored, that you could slip on, slip off, be interchangeable, then it becomes fashion instead of just a medical device” P6).
7. FUTURE WORK
In addition to the future directions mentioned in previous sections (e.g., investigating reporting accuracy at lower levels of pressure and exploring the use of visual or other forms of reporting feedback), an imperative next step is conducting field trials of Keppi to evaluate its efficacy and usage in natural settings over prolonged periods of time. To date, far less work has been conducted on pressure-based interactions outside controlled laboratory settings, and findings speaking to real-world applicability would be highly valuable.
8. CONCLUSION
This paper reports on the development of Keppi, a novel pressure-based user input device for self-reporting scalar values — in this case, of pain intensity. Constructing three versions of Keppi to meet a variety of identified design considerations, hardware constraints, and user preferences, we illustrated the reliability and utility of our approach to support the momentary self-assessment of pain levels through an unobtrusive and natural tangible interaction. Our findings provide a number of implications for the continued development and evaluation of such tools.
Acknowledgments
This work is supported by the National Science Foundation under grant SCH-1344587 as well as an award from the Translational Research Institute of Pain in Later Life (TRIPLL).
Footnotes
Contributor Information
Alexander T Adams, Cornell University.
Phil Adams, Cornell University.
Elizabeth L Murnane, Cornell University.
Mike Elfenbein, Cornell University.
Shruti Sannon, Cornell University.
Geri Gay, Cornell University.
Tanzeem Choudhury, Cornell University.
Pamara F Chang, University of Cincinnatti.
References
- Agboola Stephen, Kamdar Mihir, Flanagan Clare, Searl Meghan, Traeger Lara, Kvedar Joseph, Jethwani Kamal. Pain management in cancer patients using a mobile app: study design of a randomized controlled trial. JMIR research protocols. 2013;3(4):e76–e76. doi: 10.2196/resprot.3957. [DOI] [PMC free article] [PubMed] [Google Scholar]
- Alakarppa Ismo, Riekki Jukka, Koukkula Rauni. Pervasive pain monitoring system: User experiences and adoption requirements in the hospital and home environments. Pervasive Computing Technologies for Healthcare, 2009. Pervasive-Health 2009. 3rd International Conference on; IEEE; 2009. pp. 1–8. [Google Scholar]
- Ashburn Michael A, Staats Peter S. Management of chronic pain. The Lancet. 1999;353(9167):1865–1869. doi: 10.1016/S0140-6736(99)04088-X. [DOI] [PubMed] [Google Scholar]
- Hane Aung Min S, Alquaddoomi Faisal, Hsieh Cheng-Kang, Rabbi Mashfiqui, Yang Longqi, Pollak JP, Estrin Deborah, Choudhury Tanzeem. Leveraging multi-modal sensing for mobile health: a case review in chronic pain. IEEE Journal of Selected Topics in Signal Processing. 2016;10(5):962–974. doi: 10.1109/JSTSP.2016.2565381. [DOI] [PMC free article] [PubMed] [Google Scholar]
- Bieri Daiva, Reeve Robert A, David Champion G, Addicoat Louise, Ziegler John B. The Faces Pain Scale for the self-assessment of the severity of pain experienced by children: development, initial validation, and preliminary investigation for ratio scale properties. Pain. 1990;41(2):139–150. doi: 10.1016/0304-3959(90)90018-9. [DOI] [PubMed] [Google Scholar]
- Blaskó Gábor, Feiner Steven. CHI’04 extended abstracts on Human factors in computing systems. ACM; 2004. Single-handed interaction techniques for multiple pressure-sensitive strips; pp. 1461–1464. [Google Scholar]
- Bolger Niall, Davis Angelina, Rafaeli Eshkol. Diary methods: Capturing life as it is lived. Annual review of psychology. 2003;54(1):579–616. doi: 10.1146/annurev.psych.54.101601.145030. [DOI] [PubMed] [Google Scholar]
- Boyatzis Richard E. Transforming qualitative information: Thematic analysis and code development. Sage; 1998. [Google Scholar]
- Cechanowicz Jared, Irani Pourang, Subramanian Sriram. Augmenting the mouse with pressure sensitive input. Proceedings of the SIGCHI conference on Human factors in computing systems; ACM; 2007. pp. 1385–1394. [Google Scholar]
- Chu Gerry, Moscovich Tomer, Balakrishnan Ravin. Haptic Conviction Widgets. Proceedings of Graphics Interface 2009 (GI ’09); Canada. Toronto, Ont., Canada: Canadian Information Processing Society; 2009. pp. 207–210. [Google Scholar]
- Clarkson Edward C, Patel Shwetak N, Pierce Jeffrey S, Abowd Gregory D. Exploring continuous pressure input for mobile phones. UIST 2006 [Google Scholar]
- Cleeland Charles S, Nakamura Yoshio, Mendoza Tito R, Edwards Katherine R, Douglas Jeff, Serlin Ronald C. Dimensions of the impact of cancer pain in a four country sample: new information from multidimensional scaling. Pain. 1996;67(2–3):267–273. doi: 10.1016/0304-3959(96)03131-4. [DOI] [PubMed] [Google Scholar]
- Coughlin Steven S. Recall bias in epidemiologic studies. Journal of clinical epidemiology. 1990;43(1):87–91. doi: 10.1016/0895-4356(90)90060-3. [DOI] [PubMed] [Google Scholar]
- de la Vega Rocío, Miró Jordi. mHealth: a strategic field without a solid scientific soul. a systematic review of pain-related apps. PLoS One. 2014;9(7):e101312. doi: 10.1371/journal.pone.0101312. [DOI] [PMC free article] [PubMed] [Google Scholar]
- de la Vega Rocío, Roset Roman, Castarlenas Elena, Sánchez-Rodíguez Elisabet, Solé Ester, Miró Jordi. Development and testing of painometer: A smartphone app to assess pain intensity. The Journal of Pain. 2014;15(10):1001–1007. doi: 10.1016/j.jpain.2014.04.009. [DOI] [PubMed] [Google Scholar]
- Dietz Paul H, Eidelson Benjamin, Westhues Jonathan, Bathiche Steven. A practical pressure sensitive computer keyboard. Proceedings of the 22nd annual ACM symposium on User interface software and technology; ACM; 2009. pp. 55–58. [Google Scholar]
- Elzahaf Raga A, Tashani Osama A, Unsworth Biddy A, Johnson Mark I. The prevalence of chronic pain with an analysis of countries with a Human Development Index less than 0.9: a systematic review without meta-analysis. Current medical research and opinion. 2012;28(7):1221–1229. doi: 10.1185/03007995.2012.703132. [DOI] [PubMed] [Google Scholar]
- Farrar John T, Young James P, Jr, LaMoreaux Linda, Werth John L, Michael Poole R. Clinical importance of changes in chronic pain intensity measured on an 11-point numerical pain rating scale. Pain. 2001;94(2):149–158. doi: 10.1016/S0304-3959(01)00349-9. [DOI] [PubMed] [Google Scholar]
- Bosi Ferraz M, Quaresma MR, Aquino LR, Atra E, Tugwell P, Goldsmith CH. Reliability of pain scales in the assessment of literate and illiterate patients with rheumatoid arthritis. The Journal of rheumatology. 1990;17(8):1022–1024. [PubMed] [Google Scholar]
- Ferrell Bruce A, Ferrell Betty R, Rivera Lynne. Pain in cognitively impaired nursing home patients. Journal of pain and symptom management. 1995;10(8):591–598. doi: 10.1016/0885-3924(95)00121-2. [DOI] [PubMed] [Google Scholar]
- Fillingim Roger B, King Christopher D, Ribeiro-Dasilva Margarete C, Rahim-Williams Bridgett, Riley Joseph L. Sex, gender, and pain: a review of recent clinical and experimental findings. The journal of pain. 2009;10(5):447–485. doi: 10.1016/j.jpain.2008.12.001. [DOI] [PMC free article] [PubMed] [Google Scholar]
- Gaertner Jan, Elsner Frank, Pollmann-Dahmen Klaus, Radbruch Lukas, Sabatowski Rainer. Electronic pain diary: a randomized crossover study. Journal of pain and symptom management. 2004;28(3):259–267. doi: 10.1016/j.jpainsymman.2003.12.017. [DOI] [PubMed] [Google Scholar]
- Goldberg Daniel S, McGee Summer J. Pain as a global public health priority. BMC public health. 2011;11(1):770. doi: 10.1186/1471-2458-11-770. [DOI] [PMC free article] [PubMed] [Google Scholar]
- Hawker Gillian A, Mian Samra, Kendzerska Tetyana, French Melissa. Measures of adult pain: Visual analog scale for pain (vas pain), numeric rating scale for pain (nrs pain), mcgill pain questionnaire (mpq), short-form mcgill pain questionnaire (sf-mpq), chronic pain grade scale (cpgs), short form-36 bodily pain scale (sf-36 bps), and measure of intermittent and constant osteoarthritis pain (icoap) Arthritis care & research. 2011;63(S11):S240–S252. doi: 10.1002/acr.20543. [DOI] [PubMed] [Google Scholar]
- Helme Robert D, Gibson Stephen J. The epidemiology of pain in elderly people. Clinics in geriatric medicine. 2001;17(3):417–431. doi: 10.1016/s0749-0690(05)70078-1. [DOI] [PubMed] [Google Scholar]
- Heo Seongkook, Lee Geehyuk. Force Gestures: Augmenting Touch Screen Gestures with Normal and Tangential Forces. Proceedings of the 24th Annual ACM Symposium on User Interface Software and Technology (UIST ’11); New York, NY, USA: ACM; 2011. pp. 621–626. [Google Scholar]
- Hernandez Javier, Paredes Pablo, Roseway Asta, Czerwinski Mary. Under pressure: sensing stress of computer users. Proceedings of the 32nd annual ACM conference on Human factors in computing systems; ACM; 2014. pp. 51–60. [Google Scholar]
- Hicks Carrie L, von Baeyer Carl L, Spafford Pamela A, van Korlaar Inez, Goodenough Belinda. The Faces Pain Scale–Revised: toward a common metric in pediatric pain measurement. Pain. 2001;93(2):173–183. doi: 10.1016/S0304-3959(01)00314-1. [DOI] [PubMed] [Google Scholar]
- Hoggan Eve, Trendafilov Dari, Ahmaniemi Teemu, Raisamo Roope. Squeeze vs. Tilt: A Comparative Study Using Continuous Tactile Feedback. CHI ’11 Extended Abstracts on Human Factors in Computing Systems (CHI EA ’11); New York, NY, USA: ACM; 2011. pp. 1309–1314. [Google Scholar]
- Huskisson EC. Measurement of Pain. The Lancet. 1974;304(7889):1127–1131. doi: 10.1016/s0140-6736(74)90884-8. [DOI] [PubMed] [Google Scholar]
- Jaatun Ellen Anna Andreassen, Haugen Dagny Faksvåg, Dahl Yngve, Kofod-Petersen Anders. Designing a reliable pain drawing tool: avoiding interaction flaws by better tailoring to patients impairments. Personal and Ubiquitous Computing. 2015;19(3–4):635–648. [Google Scholar]
- Jaatun Ellen Anna Andreassen, Hjermstad Marianne Jensen, Gundersen Odd Erik, Oldervoll Line, Kaasa Stein, Haugen Dagny Faksvåg, et al. European Palliative Care Research Collaborative (EPCRC) Development and testing of a computerized pain body map in patients with advanced cancer. Journal of pain and symptom management. 2014;47(1):45–56. doi: 10.1016/j.jpainsymman.2013.02.025. [DOI] [PubMed] [Google Scholar]
- Jang Amy, MacLean Diana L, Heer Jeffrey. Bodydiagrams: improving communication of pain symptoms through drawing. Proceedings of the 32nd annual ACM conference on Human factors in computing systems; ACM; 2014. pp. 1153–1162. [Google Scholar]
- Johannes Catherine B, Kim Le T, Zhou Xiaolei, Johnston Joseph A, Dworkin Robert H. The prevalence of chronic pain in United States adults: results of an Internet-based survey. The Journal of Pain. 2010;11(11):1230–1239. doi: 10.1016/j.jpain.2010.07.002. [DOI] [PubMed] [Google Scholar]
- Kristjánsdóttir Ólöf Birna, Fors Egil A, Eide Erlend, Finset Arnstein, Stensrud Tonje Lauritzen, van Dulmen Sandra, Wigers Sigrid Hørven, Eide Hilde. A smartphone-based intervention with diaries and therapist-feedback to reduce catastrophizing and increase functioning in women with chronic widespread pain: randomized controlled trial. Journal of Medical Internet Research. 2013;15(1):e5. doi: 10.2196/jmir.2249. [DOI] [PMC free article] [PubMed] [Google Scholar]
- Lalloo Chitra, Jibb Lindsay A, Rivera Jordan, Agarwal Arnav, Stinson Jennifer N. Theresa pain App for that: Review of patient-targeted smartphone applications for pain management. The Clinical journal of pain. 2015;31(6):557–563. doi: 10.1097/AJP.0000000000000171. [DOI] [PubMed] [Google Scholar]
- Laurans Gaël, Desmet P, Hekkert Paul. The emotion slider: A self-report device for the continuous measurement of emotion. Affective Computing and Intelligent Interaction and Workshops, 2009. ACII 2009. 3rd International Conference on; IEEE; 2009. pp. 1–6. [Google Scholar]
- MacLeod Haley, Tang Anthony, Carpendale Sheelagh. Personal Informatics in Chronic Illness Management. Proceedings of Graphics Interface 2013 (GI ’13); Canada. Toronto, Ont., Canada: Canadian Information Processing Society; 2013. pp. 149–156. [Google Scholar]
- McCaffery M. Nursing management of the patient with pain. JB Lippincot Company; Philadelphia, USA: 1979. [Google Scholar]
- McClellan Catherine B, Schatz Jeffrey C, Puffer Eve, Sanchez Carmen E, Stancil Melita T, Roberts Carla W. Use of handheld wireless technology for a home-based sickle cell pain management protocol. Journal of pediatric psychology. 2009;34(5):564–573. doi: 10.1093/jpepsy/jsn121. [DOI] [PubMed] [Google Scholar]
- Mehack R, Torgerson Warren S. On the language of pain. Anesthesiology. 1971;34(1):50–59. doi: 10.1097/00000542-197101000-00017. [DOI] [PubMed] [Google Scholar]
- Melzack Ronald, Casey Kenneth L. Sensory, motivational and central control determinants of pain: a new conceptual model. The skin senses. 1968;1 [Google Scholar]
- Mizobuchi Sachi, Terasaki Shinya, Keski-Jaskari Turo, Nousiainen Jari, Ryynanen Matti, Silfverberg Miika. Making an impression: force-controlled pen input for handheld devices. CHI’05 extended abstracts on Human factors in computing systems; ACM; 2005. pp. 1661–1664. [Google Scholar]
- Parker Samantha J, Jessel Sonal, Richardson Joshua E, Cary Reid M. Older adults are mobile too! Identifying the barriers and facilitators to older adults use of mHealth for pain management. BMC geriatrics. 2013;13(1):43. doi: 10.1186/1471-2318-13-43. [DOI] [PMC free article] [PubMed] [Google Scholar]
- Ramos Gonzalo, Boulos Matthew, Balakrishnan Ravin. Pressure widgets. Proceedings of the SIGCHI conference on Human factors in computing systems; ACM; 2004. pp. 487–494. [Google Scholar]
- Reynoldson Charmian, Stones Catherine, Allsop Matthew, Gardner Peter, Bennett Michael I, José Closs S, Jones Rick, Knapp Peter. Assessing the Quality and Usability of Smartphone Apps for Pain Self-Management. Pain Medicine. 2014;15(6):898–909. doi: 10.1111/pme.12327. [DOI] [PubMed] [Google Scholar]
- Rodríguez Iyubanit, Fuentes Carolina, Herskovic Valeria, Campos Mauricio. Monitoring Chronic Pain: Comparing Wearable and Mobile Interfaces. Proceedings, Part I 10; Ubiquitous Computing and Ambient Intelligence: 10th International Conference, UCAmI 2016; San Bartolomé de Tirajana, Gran Canaria, Spain. November 29–December 2, 2016; Springer; 2016. pp. 234–245. [Google Scholar]
- Rosser Benjamin A, Eccleston Christopher. Smartphone applications for pain management. Journal of telemedicine and telecare. 2011;17(6):308–312. doi: 10.1258/jtt.2011.101102. [DOI] [PubMed] [Google Scholar]
- Schwarz Norbert. Self-reports: how the questions shape the answers. American psychologist. 1999;54(2):93. [Google Scholar]
- Shi Kang, Irani Pourang, Gustafson Sean, Subramanian Sriram. PressureFish: A Method to Improve Control of Discrete Pressure-based Input. Proceedings of the SIGCHI Conference on Human Factors in Computing Systems (CHI ’08); New York, NY, USA: ACM; 2008. pp. 1295–1298. [Google Scholar]
- Spyridonis Fotios, Hansen Jarle, Grønli Tor-Morten, Ghinea Gheorghita. PainDroid: an android-based virtual reality application for pain assessment. Multimedia tools and applications. 2014;72(1):191–206. [Google Scholar]
- Srinivasan Mandayam A, Chen Jyh-shing. Human performance in controlling normal forces of contact with rigid objects. ASME DYN SYST Control Div Publ DSC, ASME, New York, NY,(USA), 1993. 1993;49:119–125. [Google Scholar]
- Stephen A. Pain measurement tools for clinical practice and research. AANA journal. 1996 [PubMed] [Google Scholar]
- Stewart Craig, Rohs Michael, Kratz Sven, Essl Georg. Characteristics of pressure-based input for mobile devices. Proceedings of the SIGCHI Conference on Human Factors in Computing Systems; ACM; 2010. pp. 801–810. [Google Scholar]
- Stinson Jennifer N, Jibb Lindsay A, Nguyen Cynthia, Nathan Paul C, Maloney Anne Marie, Lee Dupuis L, Ted Gerstle J, Alman Benjamin, Hopyan Sevan, Strahlendorf Caron, et al. Development and testing of a multidimensional iPhone pain assessment application for adolescents with cancer. Journal of medical Internet research. 2013;15(3) doi: 10.2196/jmir.2350. [DOI] [PMC free article] [PubMed] [Google Scholar]
- Stone Arthur A, Broderick Joan E, Shiffman Saul S, Schwartz Joseph E. Understanding recall of weekly pain from a momentary assessment perspective: absolute agreement, between-and within-person consistency, and judged change in weekly pain. Pain. 2004;107(1):61–69. doi: 10.1016/j.pain.2003.09.020. [DOI] [PubMed] [Google Scholar]
- Stone Arthur A, Shiffman Saul. Ecological momentary assessment (EMA) in behavorial medicine. Annals of Behavioral Medicine 1994 [Google Scholar]
- Turk Dennis C, Melzack Ronald. Handbook of Pain Assessment. 3. Guilford Press; 2011. [Google Scholar]
- Vanderboom Catherine E, Vincent Ann, Luedtke Connie A, Rhudy Lori M, Bowles Kathryn H. Feasibility of interactive technology for symptom monitoring in patients with fibromyalgia. Pain Management Nursing. 2014;15(3):557–564. doi: 10.1016/j.pmn.2012.12.001. [DOI] [PubMed] [Google Scholar]
- de C Williams Amanda C, Davies Huw Talfryn Oakley, Chadury Yasmin. Simple pain rating scales hide complex idiosyncratic meanings. Pain. 2000;85(3):457–463. doi: 10.1016/S0304-3959(99)00299-7. [DOI] [PubMed] [Google Scholar]
- Wilson Graham, Brewster Stephen A, Halvey Martin, Crossan Andrew, Stewart Craig. The Effects of Walking, Feedback and Control Method on Pressure-based Interaction. Proceedings of the 13th International Conference on Human Computer Interaction with Mobile Devices and Services (MobileHCI ’11); New York, NY, USA: ACM; 2011. pp. 147–156. [Google Scholar]


