

ABSTRACT
The thyroid hormone triiodothyronine (T3) activates thermogenesis by uncoupling electron transport from ATP synthesis in brown adipose tissue (BAT) mitochondria. Although T3 can induce thermogenesis by sympathetic innervation, little is known about its cell autonomous effects on BAT mitochondria. We thus examined effects of T3 on mitochondrial activity, autophagy, and metabolism in primary brown adipocytes and BAT and found that T3 increased fatty acid oxidation and mitochondrial respiration as well as autophagic flux, mitophagy, and mitochondrial biogenesis. Interestingly, there was no significant induction of intracellular reactive oxygen species (ROS) despite high mitochondrial respiration and UCP1 induction by T3. However, when cells were treated with Atg5 siRNA to block autophagy, induction of mitochondrial respiration by T3 decreased, and was accompanied by ROS accumulation, demonstrating a critical role for autophagic mitochondrial turnover. We next generated an Atg5 conditional knockout mouse model (Atg5 cKO) by injecting Ucp1 promoter-driven Cre-expressing adenovirus into Atg5Flox/Flox mice to examine effects of BAT-specific autophagy on thermogenesis in vivo. Hyperthyroid Atg5 cKO mice exhibited lower body temperature than hyperthyroid or euthyroid control mice. Metabolomic analysis showed that T3 increased short and long chain acylcarnitines in BAT, consistent with increased β-oxidation. T3 also decreased amino acid levels, and in conjunction with SIRT1 activation, decreased MTOR activity to stimulate autophagy. In summary, T3 has direct effects on mitochondrial autophagy, activity, and turnover in BAT that are essential for thermogenesis. Stimulation of BAT activity by thyroid hormone or its analogs may represent a potential therapeutic strategy for obesity and metabolic diseases.
Abbreviations: ACACA: acetyl-Coenzyme A carboxylase alpha; AMPK: AMP-activated protein kinase; Acsl1: acyl-CoA synthetase long-chain family member 1; ATG5: autophagy related 5; ATG7: autophagy related 7; ATP: adenosine triphosphate; BAT: brown adipose tissue; cKO: conditional knockout; COX4I1: cytochrome c oxidase subunit 4I1; Cpt1b: carnitine palmitoyltransferase 1b, muscle; CQ: chloroquine; DAPI: 4ʹ,6-diamidino-2-phenylindole; DIO2: deiodinase, iodothyronine, type 2; DMEM: Dulbecco’s modified Eagle’s medium; EIF4EBP1: eukaryotic translation initiation factor 4E binding protein 1; Fabp4: fatty acid binding protein 4, adipocyte; FBS: fetal bovine serum; FCCP: carbonyl cyanide-4-(trifluoromethoxy)phenylhydrazone; FGF: fibroblast growth factor; FOXO1: forkhead box O1; GAPDH: glyceraldehyde-3-phosphate dehydrogenase; GFP: green fluorescent protein; Gpx1: glutathione peroxidase 1; Lipe: lipase, hormone sensitive; MAP1LC3B: microtubule-associated protein 1 light chain 3; mRNA: messenger RNA; MTORC1: mechanistic target of rapamycin kinase complex 1; NAD: nicotinamide adenine dinucleotide; Nrf1: nuclear respiratory factor 1; OCR: oxygen consumption rate; PBS: phosphate-buffered saline; PCR: polymerase chain reaction; PPARGC1A: peroxisome proliferative activated receptor, gamma, coactivator 1 alpha; Pnpla2: patatin-like phospholipase domain containing 2; Prdm16: PR domain containing 16; PRKA: protein kinase, AMP-activated; RPS6KB: ribosomal protein S6 kinase; RFP: red fluorescent protein; ROS: reactive oxygen species; SD: standard deviation; SEM: standard error of the mean; siRNA: small interfering RNA; SIRT1: sirtuin 1; Sod1: superoxide dismutase 1, soluble; Sod2: superoxide dismutase 2, mitochondrial; SQSTM1: sequestosome 1; T3: 3,5,3ʹ-triiodothyronine; TFEB: transcription factor EB; TOMM20: translocase of outer mitochondrial membrane 20; UCP1: uncoupling protein 1 (mitochondrial, proton carrier); ULK1: unc-51 like kinase 1; VDAC1: voltage-dependent anion channel 1; WAT: white adipose tissue
KEYWORDS: Autophagy, brown adipose tissue, mitochondria, mitophagy, thermogenesis, thyroid hormone
Introduction
The 2 forms of thyroid hormones, thyroxine (T4) and its active metabolite 3,5,3ʹ-triiodothyronine (T3), regulate metabolic processes that control energy utilization. The intracellular levels of these hormones are controlled by DIO1 (deiodinase, iodothyronine, type 1) and DIO2 that catalyze the conversion of T4 to its active form T3 [1]. In homeothermic species, these processes are important in generating heat to maintain body temperature. T3 has long been implicated in stimulating both obligatory and adaptive thermogenesis in various tissues [2–4]. Especially in brown adipose tissue (BAT), T3 stimulates thermogenesis by inducing metabolic inefficiency through the induction of the mitochondrial uncoupling protein, UCP1 [2,3]. The opposite occurs in the absence of T3, as thermogenic capacity of brown adipose tissue (BAT) is greatly reduced [5]. Clinically, these effects are manifested by hyperthermia and hypothermia observed in patients with severe hyperthyroidism and hypothyroidism, respectively.
BAT is present in almost all eutherian mammals and is responsible for non-shivering adaptive thermogenesis [6]. It is prominent in neonates and small mammals, and also metabolically active in adult humans, especially in response to cold. Due to its ability to oxidize fatty acids and increase glucose utilization by lowering insulin resistance, pharmacological activation of BAT has been considered an attractive potential therapeutic approach to treat obesity and diabetes [7]. Fetal rat BAT has DIO2 expression, suggesting that T3 may be responsible for embryonic development of BAT [8]. In addition, mouse embryos with targeted disruption of DIO2 show impaired adipogenesis (decreased expression of Fabp4/aP2, Cidea, and Acsl5) and adaptive thermogenesis (decreased expression of Ucp1 and Ppargc1a) [9]. These defects persist throughout adulthood as adaptive thermogenesis is hindered by loss of T3-mediated lipogenesis and lipolysis [5,10]. Thyroid status also is highly correlated with BAT activity in mice. Hyperthyroid mice have higher BAT volume, fatty acid oxidation, and glucose uptake [11]. In mature BAT, there is increased adaptive thermogenesis by the sympathetic nervous system (SNS) in response to cold. T3 also increases hypothalamic stimulation of sympathetic nervous system to induce DIO2 expression and increase local conversion from T4 to T3 to increase UCP1 expression [4,5,12–15]. Additionally, catecholamines increase the intracellular cAMP level, protein kinase A activity and hormone-sensitive lipase (LIPE/HSL) phosphorylation to stimulate lipolysis in both WAT and BAT to provide fatty acid substrates for β-oxidation [16]. T3 increases adrenergic stimulation of UCP1 expression in vivo [17–20] and may sensitize cultured brown adipocytes to adrenergic stimulation of UCP1 expression [21]. On the other hand, T3 has been reported to induce UCP1 expression in fetal rat brown adipocytes in primary culture without any adrenergic stimulation [22]. Thus, the question of a cell autonomous role of T3 on BAT currently is unresolved.
In metabolically active tissues, autophagy is necessary for efficient turnover of damaged organelles such as mitochondria (mitophagy). Mice with an adipose-specific deletion of Atg7 (autophagy related 7) have more mitochondria in adipose tissues [23] suggesting that autophagy is essential for mitochondrial clearance. Recently, Martinez-Lopez et al. and Mottillo et al. have found that cold exposure at 4°C induces lipophagy and mitophagy in BAT [24,25], suggesting that autophagy is needed for adaptive thermogenesis. We have recently shown that T3 maintains mitochondrial homeostasis by inducing autophagy of lipids (lipophagy) and mitophagy in liver and skeletal muscle [26,27]. We thus investigated whether T3 has a cell autonomous role on the activation of BAT by examining autophagy, mitochondrial turnover, fatty acid metabolism, and mitochondrial respiration in primary brown adipocytes and a brown adipocyte cell line in cell culture studies as well as performing in vivo experiments in both hyperthyroid and BAT-specific Atg5 conditional knockout mouse models at room temperature in order to minimize the contribution from sympathetic stimulation. Our findings showed that T3 has cell autonomous effects on mitochondrial activity, biogenesis, mitophagy, and lipid metabolism in BAT, and suggest that T3 or its analogs may have potential beneficial effects on obesity by directly stimulating BAT activity.
Results
T3 induces autophagic flux in BAT, primary brown adipocytes, and mBAP9 cells
To investigate the effect of T3 on autophagy in BAT, we examined BAT samples from hyperthyroid mice that were treated with T3 (10 μg/100 g body weight) for 10 d at room temperature. We found increased lipidated MAP1LC3B/LC3B (MAP1LC3B-II) and reduced SQSTM1/p62 levels in BAT from hyperthyroid mice, indicating that there was increased autophagic flux (Figure 1(a)). Accordingly, we observed more autophagic vesicles in electron microscopy images of hyperthyroid BAT (Figures 1(b) and S1(a)). In primary brown adipocytes, T3 also increased the MAP1LC3B-II level in a time- and dose-dependent manner (Figures 1(c) and S1(b)) without affecting cell viability (Figure S1(c)), and was consistent with increased number of autophagic vesicles in T3-treated primary brown adipocytes (Figures 1(d) and S1(d)). Bafilomycin A1 (Baf), a pharmacological inhibitor of vacuolar H+ ATPase/lysosomal acidification, caused MAP1LC3B-II accumulation in BAT; however, when it was added together with T3, there was a further increase in MAP1LC3B-II level compared to samples treated with T3 alone, strongly suggesting that T3 stimulated synthesis of new autophagosomes and increased autophagic flux (Figure 1(e)). We further demonstrated autophagic flux by transfecting a tandem fluorescent MAP1LC3B (RFP-eGFP-MAP1LC3B) plasmid expressing MAP1LC3B with the green and red fluorescent domains into a brown adipocyte mouse mBAP-9 cell line. When this fusion protein is incorporated within an autophagosome, both green and red signals are emitted, resulting in a yellow color in overlay image. However, when the autophagosome fuses with a lysosome to form an autolysosome, the acidic environment quenches the green signal and only red signal is detected. Therefore, the amount of red signal reflects the rate of autophagic flux. Confocal images of T3-treated brown adipocytes showed increases in the number of red puncta (Figure 1(f)) and the red to yellow signal ratios (Figure 1(g)), indicating that they had higher autophagic flux than control brown adipocytes.
Figure 1.
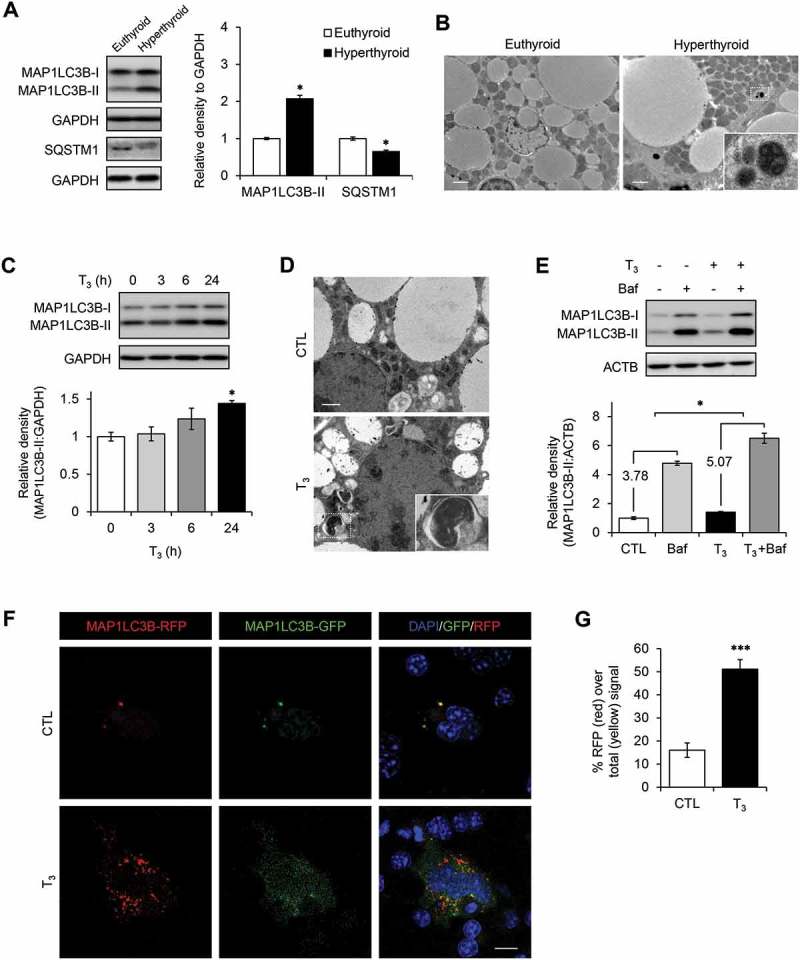
T3 induces autophagy in BAT and brown adipocytes. (a) Increased autophagic flux in T3-treated BATs. Immunoblots and densitometry showing MAP1LC3B-II and SQSTM1 levels in BATs of hyperthyroid mice. Results represent mean ± SEM (n = 3). (b) Electron microscopy images showing increased number of autophagic vesicles in hyperthyroid BAT. Scale bar: 2 μm. (c) Time course of MAP1LC3B-II induction in primary brown adipocytes treated with 10 nM T3 for 0, 3, 6 and 24 h. (d) Electron microscopy images showing increased number of autophagic vesicles in primary brown adipocytes treated with 10 nM T3 for 24 h. Scale bar: 1 μm. (e) Autophagic flux analysis showing accumulation of MAP1LC3B-II following autophagy inhibition. Primary brown adipocytes were treated with 10 nM T3 for 24 h. Cells were treated with 50 nM Baf to block autophagosome clearance 6 h before harvest. Result shows mean ± SD (n = 3) where n represents number of independent experiments. (f) Confocal images showing brown adipocyte cell line mBAP-9 transfected with eGFP-MAP1LC3B plasmid and treated with 10 nM T3 for 24 h. Yellow color represents MAP1LC3B-II on autophgosomes. Red color represents MAP1LC3B-II on lysosomes. Scale bar: 10 μm. (g) Quantitative analysis of the RFP (red) fluorescence relative to total (yellow) signal. Quantification of images (at least 10 transfected cells per each sample in 3 different fields) was done using ImageJ software. Result shows mean ± SD. *: P < 0.05, **: P < 0.01, ***: P < 0.001.
T3 increases mitophagy in BAT, primary brown adipocytes, and mBAP-9 cells
To investigate mitophagy in vivo, we used the lysosomal inhibitor, chloroquine (CQ), to block autophagy clearance in hyperthyroid mice. We found increased accumulation of the mitochondrial proteins, COX4I1 (cytochrome c oxidase subunit 4I1) and TOMM20 (translocase of outer mitochondrial membrane 20), in BAT from hyperthyroid mice (Figures 2(a) and S2(a)), suggesting that mitochondrial clearance was dependent on autophagy (mitophagy). Mitochondrial remnants also were observed inside autophagic vesicles in electron microscopic images from CQ-treated hyperthyroid mice (Figure 2(b)) and in primary brown adipocytes treated with Baf and T3 (data not shown). Baf increased accumulation of TOMM20 (a mitochondrial outer membrane protein) and VDAC1 (voltage-dependent anion channel 1; a major isoform highly and predominantly expressed on the mitochondrial outer membrane) (basal mitophagy) in primary brown adipocytes; however, when both Baf and T3 were given together, there was a further increase in accumulation of TOMM20 and VDAC1 in primary brown adipocytes (Figure 2(c)). These in vivo and cell culture studies strongly suggested that mitochondria were bona fide cargoes of T3-induced autophagy. To further confirm these observations, a tandem-tagged mito-RFP-EGFP plasmid, which encodes a fusion protein containing a mitochondrial targeting signal alongside green and red fluorescent proteins, was transfected into mBAP-9 brown adipocyte cells (Figure 2(d)). At cytosolic pH levels, mitochondria fluoresce at both green and red wavelengths resulting in a yellow color. However, in the low-pH environment within autolysosomes, the green signal is quenched and only red color is emitted. T3 treatment increased the number of red puncta (Figure 2(d)) and the amount of red to yellow signal ratio (Figure 2(e)), demonstrating that T3 increased mitophagy. To further visualize lysosomal mitochondria, we transfected a pMT-mKeima-Red plasmid into mBAP-9 brown adipocyte cells (Figure S2(b)). The plasmid encodes a fusion protein that targets the fluorescent protein Keima to the mitochondrial matrix. Keima is a pH-sensitive fluorescent protein that has dual excitation wavelengths. At the physiological pH of the mitochondria, the protein preferentially excites at 440 nm. Under acidic environment inside autolysosomes, the excitation wavelength is shifted to 550 nm. Using this technique, we found that T3 treatment increased the number of lysosome-resident mitochondria in primary brown adipocytes (Figure S2(c)), confirming that T3 directly activated mitophagy. Consistent with increased mitophagy, we also detected higher levels of SQSTM1 and MAP1LC3B-II in the mitochondrial fraction of T3-treated BAT and primary brown adipocytes (Figure S2(d,e)). Last, we observed a higher percentage of cells that had colocalization of SQSTM1 and mitochondria marker, MitoTracker Red, in T3-treated primary brown adipocytes using immunohistochemistry and confocal microscopy (Figure S2(f,g)).
Figure 2.
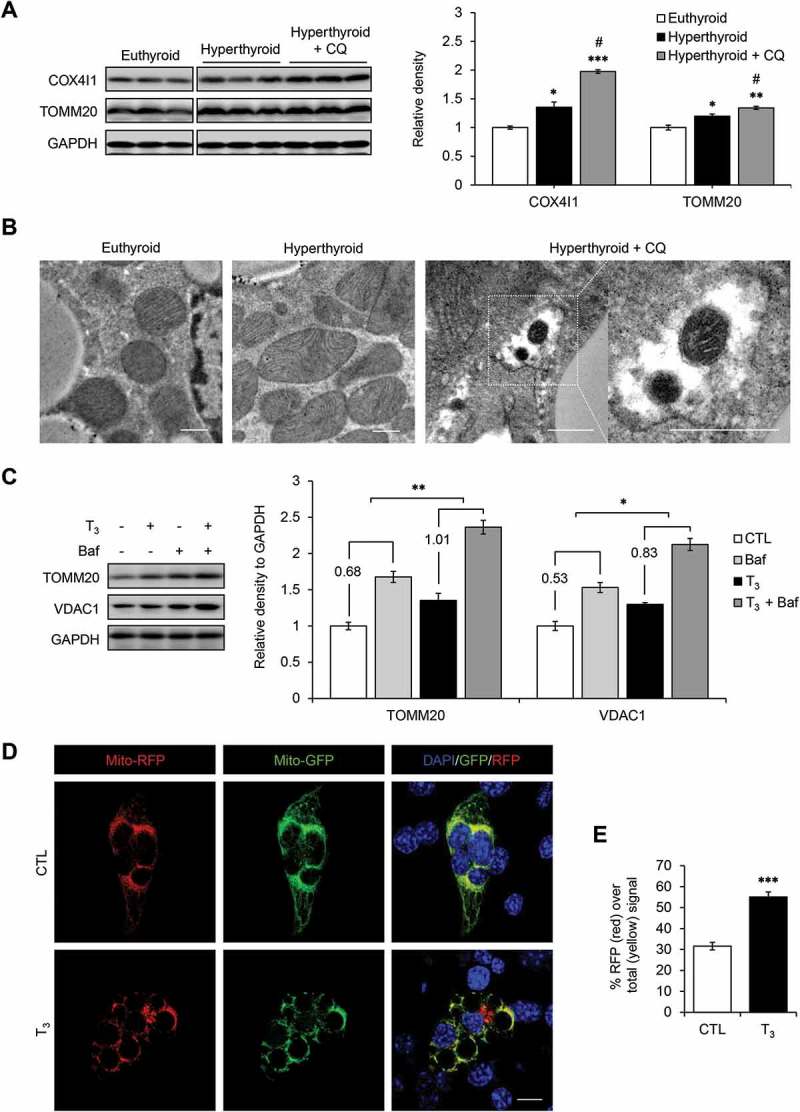
T3 induces mitophagy in BAT and primary adipocytes. (a) Immunoblots and densitometry showing COX4I1 and TOMM20 levels relative to GAPDH in BATs of hyperthyroid mice injected with chloroquine (CQ) to block autophagy. The blots were from the same gel but cropped for better presentation (Figure S1). Result represents mean ± SD (n = 3). (b) Electron microscopy images showing mitochondria inside autophagic vesicles in CQ-treated hyperthyroid BATs. Scale bar: 0.5 μm. (c) Representative blots and quantification showing accumulation of TOMM20 and COX4I1 in T3-treated primary brown adipocytes after autophagy inhibition. Cells were treated 10 nM T3 for 24 h, followed by 50 nM Baf treatment 6 h before harvest. Result shows mean ± SD (n = 3) where n represents number of independent experiments. (d) Confocal images showing mBAP-9 cells transiently transfected with mito-RFP/GFP plasmid and treated with 10 nM T3 for 24 h. Yellow color represents normal cytosolic mitochondria. Red color represents mitochondria inside lysosomes. Scale bar: 10 μm. (e) Quantitative analysis of RFP (red) fluorescence over total (yellow) signal to represent relative mitophagy. ImageJ software was used for quantification (at least 10 transfected cells per each sample in 3 different fields). Result shows mean ± SD. *: P < 0.05, **: P < 0.01 ***: P < 0.001 compared to control. #:P < 0.05 compared to T3-treated group.
T3 induces mitochondrial biogenesis and mitochondrial turnover in BAT, primary brown adipocytes, and mBAP-9 cells
To better understand the regulation of mitochondrial homeostasis in BAT, we examined whether T3 increased expression of genes involved in mitochondrial pathways and biogenesis in BAT. We found that expression of genes involved in thermogenesis (Ucp1, Prdm16, Ppargc1a), fatty acid oxidation (Cpt1b, Acsl1) and lipolysis (Pnpla2, Lipe) were induced in BAT from hyperthyroid mice (Figure 3(a)). T3 also increased the expression of mitochondrial proteins, COX4I1, TOMM20, VDAC1, and UCP1 (Figure 3(b)), as well and mitochondrial DNA copy number (Figure 3(c)). The increase in Ucp1 mRNA and UCP1 protein expression was similar to those observed for other mitochondrial proteins, suggesting that its induction by T3 was likely due to an overall increase in mitochondrial biogenesis rather than distinct pattern of expression that was unrelated to other mitochondrial proteins. Additionally, T3 increased mitochondrial thermogenic gene mRNA (Figure 3(d)), and protein (Figure 3(e)) expression in primary mature brown adipocytes.
Figure 3.
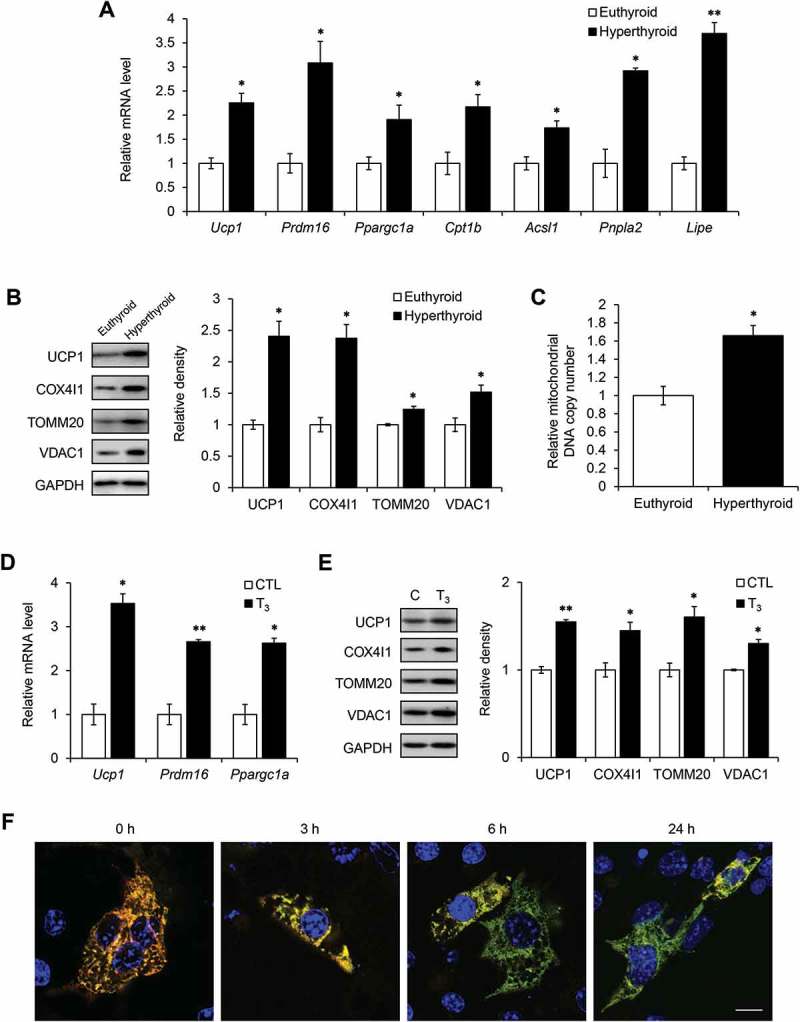
T3 increases mitochondrial biogenesis and turnover in BAT and primary brown adipocytes. (a) Real time PCR analysis of mRNA levels of Ucp1, Prdm16, Ppargc1a, Cpt1b, Acsl1, Pnpla2 and Lipe in BATs from hyperthyroid mice using Polr2a as the internal control. Result represents mean ± SEM (n = 5). (b) Representative blots and densitometry showing expression levels of COX4I1, TOMM20 and VDAC1 relative to GAPDH in hyperthyroid BATs. Bar represents mean ± SD (n = 3). (c) Graph showing increased mitochondrial DNA copy number in hyperthyroid BAT. Bar represents mean ± SEM (n = 5). (d) Real time PCR analysis of transcript levels of Ucp1, Prdm16 and Ppargc1a. Primary brown adipocytes were treated with 10 nM T3 for 24 h. Bar represents mean ± SD (n = 6) where n represents number of independent experiments. (e) Representative immunoblots and quantification showing expression levels of COX4I1, TOMM20 and VDAC1 relative to GAPDH in cells treated with 10 nM T3 for 24 h. Result represents mean ± SD (n = 3) where n represents number of independent experiments. *: P < 0.05, **: P < 0.01, ***: P < 0.001. (f) Confocal images showing brown adipocyte cell line mBAP-9 transfected with pMitoTimer plasmid for 72 h. Green represents newly synthesized mitochondria. Red represents mature mitochondria. At indicated time periods before harvest, cells were treated with 10 nM T3. Scale bar: 10 μm.
To further investigate the dual regulation of mitochondrial biogenesis and mitophagy (mitochondrial turnover) by T3, we employed the recently described MitoTimer methodology [28,29] in mBAP-9 cells. pMitoTimer expresses a mutant version of DsRed, a protein that fluoresces from green to red over 48 h specifically in mitochondria, and thus can help distinguish newly synthesized mitochondria from mature mitochondria. When we examined the effects of T3 on mitochondrial turnover, there was decreased red signal and increased green signal after 6 and 24 h of T3 treatment (Figure 3(f)). These findings showed that T3 simultaneously increased both mitochondrial synthesis and clearance, however, since overall levels of mitochondrial proteins were higher after T3 treatment (Figure 3(b,e)), new mitochondrial synthesis predominated over clearance.
T3 increases fatty acid oxidation in BAT and increases mitochondrial respiration in primary brown adipocytes
Since T3 induces both mitophagy and mitochondrial biogenesis, we further investigated whether T3 stimulates overall mitochondrial activity. Acyl-CoAs are translocated as acylcarnitines into the mitochondrial matrix where they undergo fatty acid β-oxidation. Using a metabolomics approach, we found that the levels of short chain acylcarnitine, C2 (acetyl-carnitines), C3 (propionyl-carnitines), C4 (butyryl-carnitines) and long chain acylcarnitines were higher in BAT from hyperthyroid mice (Figure 4(a,b)), in conjunction with increased Cpt1b mRNA (Figure 3(a)). The increase in C2 and C4 levels suggested that there was increased acylcarnitine flux due to fatty acid β-oxidation since they are the end products of fatty acid β-oxidation (Figure 4(a)). The elevated C3 level suggested that there was increased oxidation of isoleucine, valine, threonine, and methionine since C3 is primarily derived from the metabolism of these amino acids. In addition, the higher levels of the long chain acylcarnitines, specifically C16 and C18, in BAT from hyperthyroid mice suggested that there was an increase in long chain fatty acid levels due to WAT and BAT lipolysis induced by T3. Thus, this increase in long chain fatty acid and acylcarnitine levels provided the necessary fuel to sustain increased fatty acid β-oxidation by BAT in hyperthyroid animals (Figure 4(b)).
Figure 4.
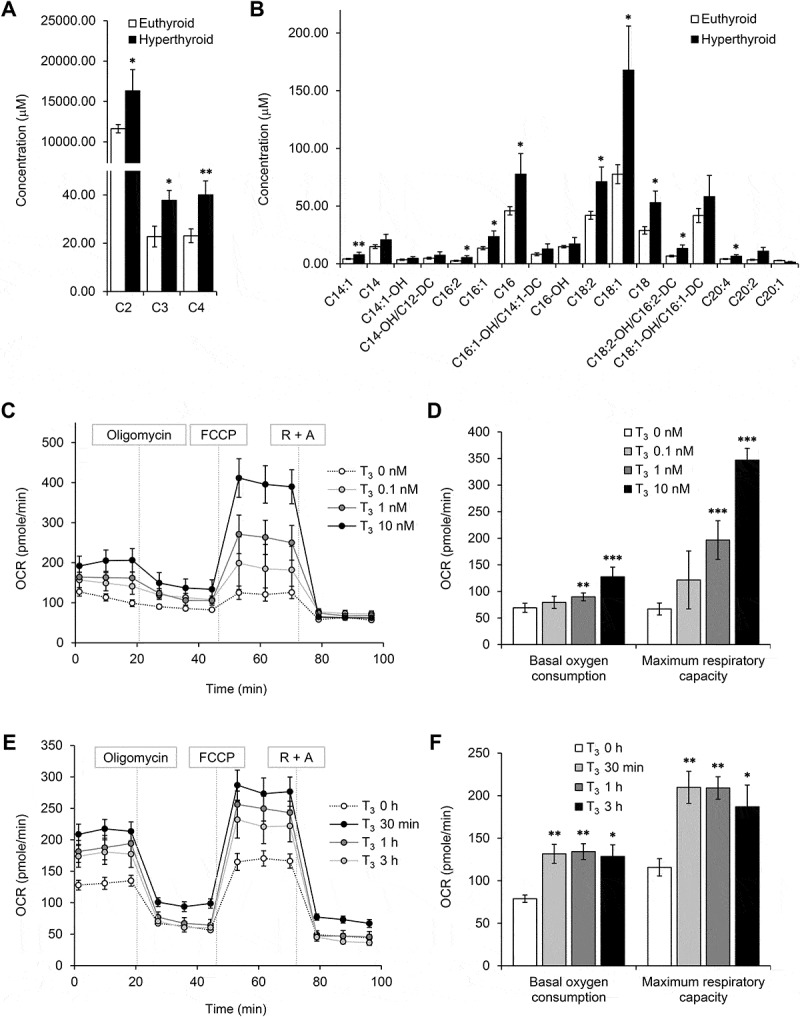
T3 increases fatty acid oxidation and oxygen consumption in BAT and primary brown adipocytes. Metabolomic profiling of acylcarnitine levels in BATs. Graphs showing concentrations of (a) short chain and (b) long chain acylcarnitines in BATs from hyperthyroid mice. Result represents mean ± SEM (n = 6) (c, d) Seahorse analysis of oxygen consumption rate (OCR) for primary brown adipocytes treated with various doses of T3 for 24 h. OCR was measured continuously throughout the experimental period at baseline and in the presence of the indicated drugs: 1 μM oligomycin, 1 μM FCCP and 1 μM rotenone with 1 μM antimycin A (R + A). (e) Seahorse analysis of OCR for primary brown adipocytes treated with 10 μM of T3 for 30 min, 1 and 3 h (f) Graphs showing basal and maximal OCR at different concentrations of T3. Basal OCR denotes [OCR without inhibitor – OCR with rotenone and antimycin A (R + A) injection]. Maximal OCR or respiratory capacity is calculated by [OCR after FCCP injection – OCR with R + A injection]. Result shows mean ± SD (n = 6) where n represents number of independent experiments. *: P < 0.05, **: P < 0.01, ***: P < 0.001.
We next examined the cell autonomous effects of T3 on BAT mitochondria respiration by using Seahorse analyses to measure oxygen consumption rate (OCR) of primary brown adipocytes treated with T3 (Figure 4(c)). We found that 24 h of T3 treatment increased basal OCR and maximum respiratory capacity in primary brown adipocytes in a dose-dependent manner (Figure 4(d)). Interestingly, mitochondrial respiration was upregulated after acute T3 treatment for 30 min (Figure 4(e,f)), suggesting that T3 also may have non-transcriptional effects on brown adipocytes. Taken together, our data showed that T3 was able to activate brown adipocytes in a cell autonomous manner.
T3 stimulates mitochondrial respiration without significant intracellular ROS generation or AMPK activation
We have previously shown that T3 increases mitochondrial ROS which leads to AMP-activated protein kinase (AMPK) activation and the induction of autophagy in liver and muscle [26,27]. Accordingly, we investigated ROS production and AMPK activation in BAT from hyperthyroid mice by measuring the amount of carbonyl proteins in BAT from euthyroid and hyperthyroid mice. Surprisingly, BAT from hyperthyroid mice showed no significant increase in carbonyl proteins despite having higher mitochondrial activity (Figure S3(a)). Similarly, T3 treatment did not increase carbonyl proteins in primary brown adipocytes (Figure S3(b)), in contrast to norepinephrine treatment (Figure S3(c)). In conjunction with the lack of significant intracellular ROS production, there also was no change in phosphorylation levels of both AMPK and its downstream target ACACA/ACC after T3 treatment (Figure S3(d,e)), suggesting that AMPK was not activated by T3 in brown adipocytes. Because mitochondrial uncoupling may contribute to ROS and AMPK activation, we also examined the effect of Ucp1 knockdown on autophagy induction. We found that T3 was able to induce autophagy in the absence of UCP1 upregulation (Figure S3(f)). Moreover, when an ROS inhibitor, N-acetyl-L-cysteine (L-NAC), was added to primary brown adipocytes, T3 still was able to induce autophagy (data not shown). Taken together, our results showed that AMPK activation and ROS generation were not necessary for autophagy in BAT.
Autophagy facilitates mitochondrial turnover to confer protection from oxidative stress
To demonstrate the crucial role of mitophagy in maintaining mitochondrial function, we analyzed OCR in primary brown adipocytes in which autophagy was inhibited by Atg5 siRNA (Figures 5(a,b) and S4(a)) or Baf (Figure S4(b,c)). Both treatments blocked the T3-mediated increase in basal oxygen consumption and maximum respiratory capacity. Interestingly, increased carbonyl protein formation was observed in T3-treated primary brown adipocytes cells transfected with Atg5 siRNA or treated with Baf compared to controls (Figure 5(c,d)). Since the lack of ROS induction despite high levels of mitochondrial respiration and UCP1 expression by T3 was unexpected, we examined the mRNA expression of antioxidant enzymes after T3 treatment. Surprisingly, there was no induction of antioxidant enzyme mRNAs when primary brown adipocytes were treated with T3 for 24 h (Figure 5(e)), the same time period when autophagy (Figure 1(e)) and mitochondrial activity (Figure S4(b)) were highly stimulated by T3. However, they all were significantly induced when autophagy was blocked by Baf (Figure 5(e)). These findings suggested that mitophagy played a major role in maintaining mitochondrial quality control by preventing the accumulation of intracellular ROS in brown adipocytes treated with T3 as the mRNA expression of antioxidant enzymes increased only when autophagy was blocked.
Figure 5.
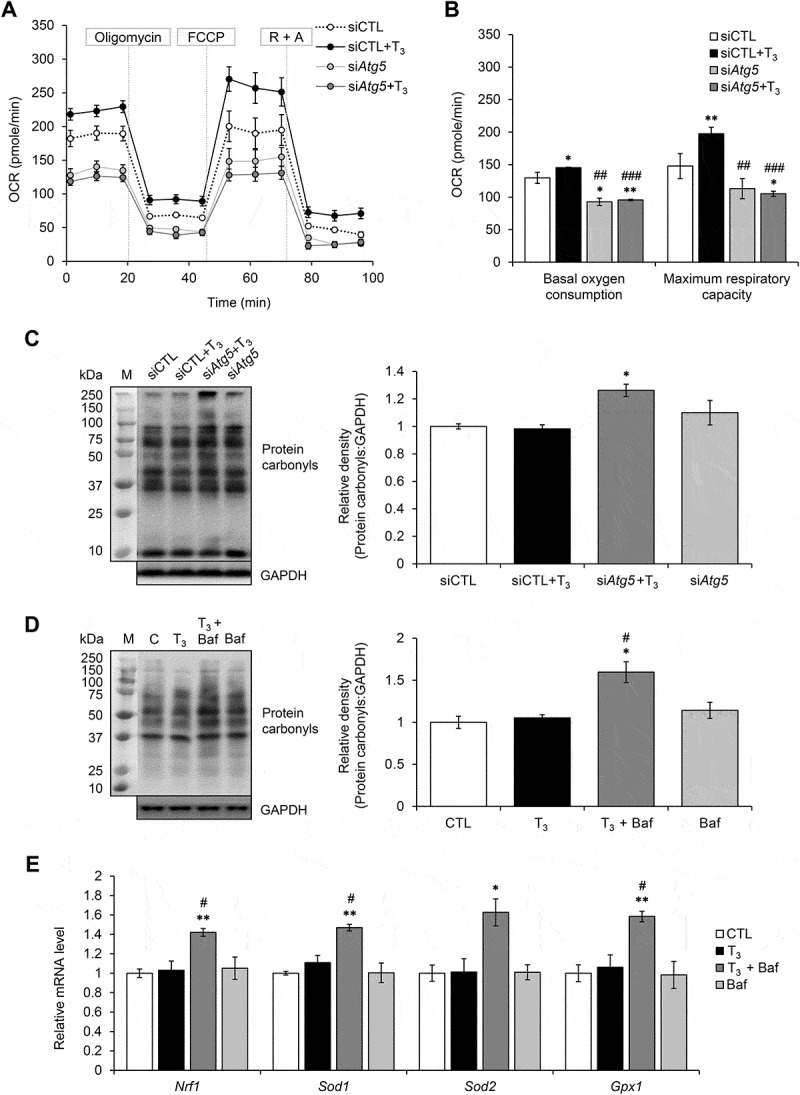
Autophagy inhibition led to increased oxidative stress and reduces mitochondrial activity in primary brown adipocytes. (a) Seahorse analysis of OCR for primary brown adipocytes transfected with control (siCTL) or Atg5 siRNA (siAtg5) for 48 h and treated with or without 10 nM T3 for 24 h. (b) Graphs showing basal and maximal OCR of Atg5 siRNA transfected primary brown adipocytes treated with or without 10 nM T3. Result shows mean ± SD (n = 6) where n represents number of independent experiments. (c) Representative immunoblots and quantification showing protein carbonylation in primary brown adipocytes. Cell were transfected with Atg5 siRNA for 48 h and treated with or without 10 nM T3 24 h before harvest. Bar represents mean ± SD (n = 3) where n represents number of independent experiments. (d) Representative immunoblots and quantification showing protein carbonylation in primary brown adipocytes treated with 10 nM T3 for 24 h. Baf was added 6 h before harvest (Baf). Bar represents mean ± SD (n = 3) where n represents number of independent experiments. (e) Quantitative PCR result showing mRNA level of antioxidant proteins Nrf1, Sod1, Sod2 and Gpx1 using Polr2a as the internal control. Cell were treated with 10 nM T3 for 24 h with or without Baf. Bar represents mean ± SD (n = 3) where n represents number of independent experiments. *: P < 0.05, **: P < 0.01, ***: P < 0.001 compared to control. #: P < 0.05, ##: P < 0.01, ###: P < 0.001 compared to T3-treated group.
Induction of thermogenesis in vivo by T3 requires BAT-specific autophagy
To investigate role of autophagy on thermogenesis in vivo, we generated BAT-specific Atg5 conditional knockout mice (Atg5 cKO) by injecting Ucp1 promoter-driven Cre-expressing adeno-associated virus into Atg5Flox/Flox mice (Figures 6(a) and S5). In control mice injected with control adenovirus, hyperthyroid mice receiving daily T3 injection for 10 d exhibited significantly higher body temperature than euthyroid mice. In contrast, hyperthyroid Atg5 cKO mice exhibited a lower body temperature than control hyperthyroid or euthyroid mice (Figure 6(b)), suggesting that BAT autophagy was important in T3-mediated thermogenesis. Additionally, hyperthyroid Atg5 cKO mice had accumulation of protein carbonyls (Figure 6(c)) and deformed mitochondria (Figure 6(d)) suggesting that autophagy was necessary in order to maintain the integrity of BAT mitochondria during thermogenesis.
Figure 6.
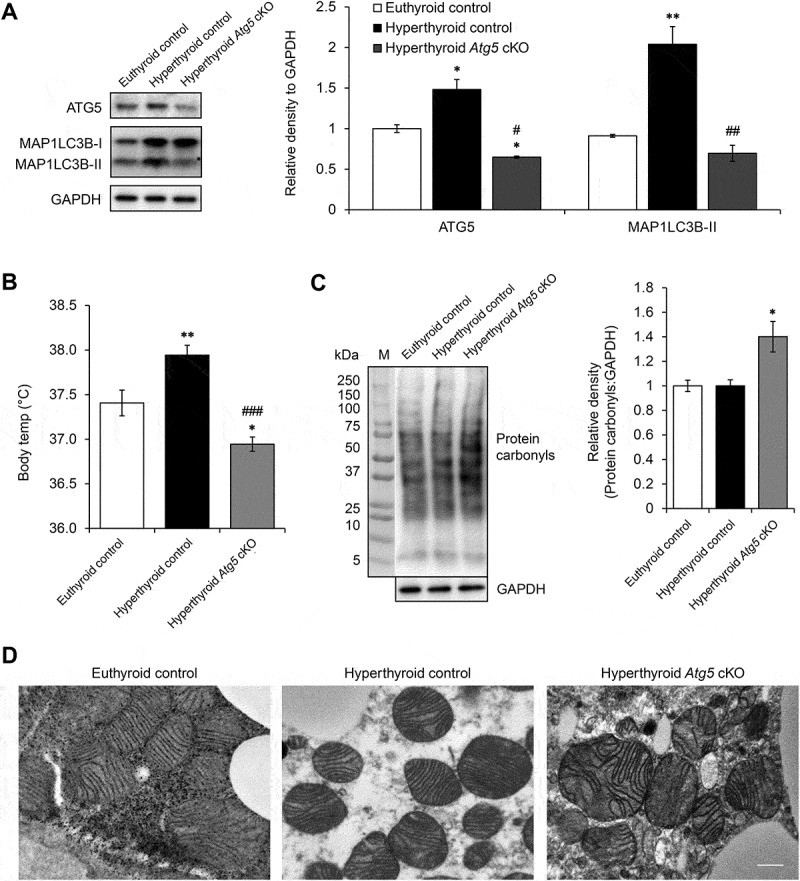
BAT-specific autophagy inhibition abolished T3-mediated thermogenesis. (a) Representative immunoblots and quantification showing decrease in ATG5 and MAP1LC3B-II level in BAT of Atg5 cKO mice. Bar represents mean ± SEM (n = 3). (b) Graph shows body temperature of control and Atg5 cKO and made hyperthyroid by daily T3 injection for 10 d. Result shows mean ± SEM (n = 3). (c) Representative immunoblots and quantification showing increased protein carbonyls in BAT of hyperthyroid Atg5 cKO mice. Bar represents mean ± SEM (n = 3). *: P < 0.05, **: P < 0.01 compared to control. #: P < 0.05, ##: P < 0.01, ###: P < 0.001 compared to T3-treated group. (d) Electron microscopy images showing distorted mitochondria in hyperthyroid Atg5 cKO mice. Scale bar: 0.5 μm.
T3 induces autophagic flux via the MTOR pathway
Autophagy is inhibited by the MTOR (mechanistic target of rapamycin kinase) pathway through the phosphorylation of ULK1 by activated MTOR complex 1 (MTORC1). Since neither AMPK nor ROS played significant roles in the activation of autophagy by T3 in BAT, we examined MTORC1 activity. Interestingly, we observed a decrease in MTOR and EIF4EBP1 phosphorylation in BAT from hyperthyroid mice (Figure 7(a)). Similarly, T3 decreased the level of phosphorylated MTOR and the 2 MTORC1 targets, RPS6KB and EIF4EBP1 in a time-dependent manner in primary brown adipocytes (Figure 7(b)). Inhibition of MTOR was independent of mitochondrial uncoupling since T3 was able to reduce phosphorylation of RPS6KB in brown adipocytes transfected with siRNA targeting Ucp1 (Figure S6(a)). Moreover, inhibition of MTOR led to increased nuclear translocation of TFEB (transcription factor EB) (Figure S6(b)), a master regulator of autophagy and lysosomal target genes. This effect on TFEB in BAT by T3 increased the mRNA expression of the TFEB target genes involved in autophagy such as Atg5 and Atg7 (Figure S6(c)). Since MTORC1 is a nutrient sensor and its activity is regulated by amino acid content, we next performed amino acid profiling in hyperthyroid BAT. Interestingly, we found that T3 reduced the intracellular BAT levels of a broad range of amino acids (Figure 7(c)), particularly leucine and arginine, which previously have been shown to stimulate MTORC1 activity in adipocytes [30–32]. These findings also were consistent with our acylcarnitine metabolomics analysis (Figure 4(a)) in which we observed increased C2 and C3 acylcarnitine levels. Both these species are end products and markers of amino acid oxidation.
Figure 7.
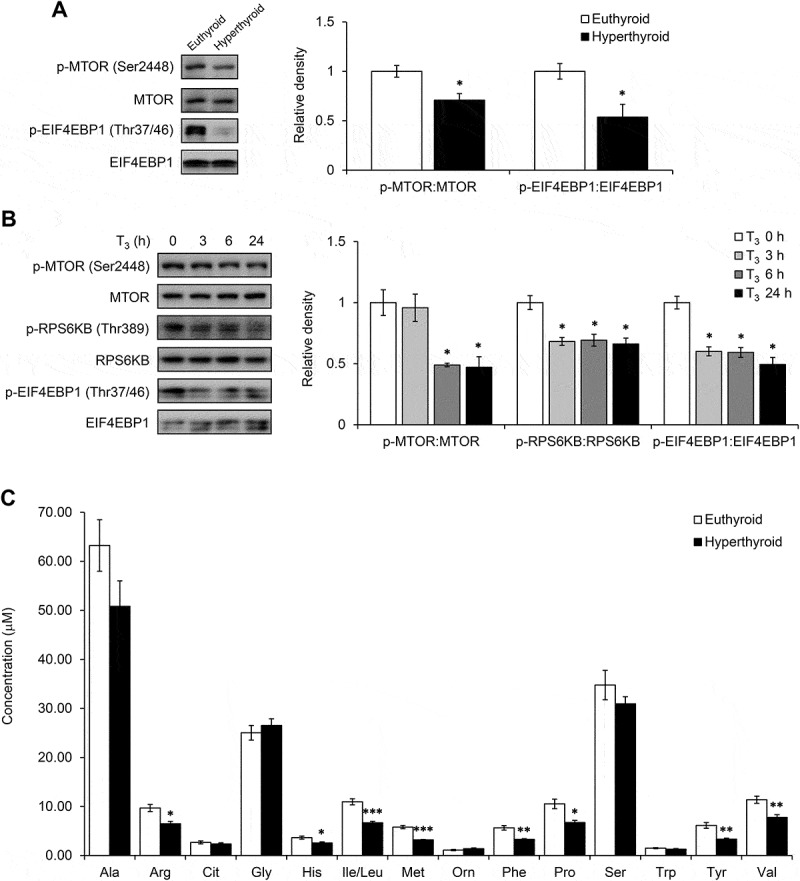
T3 inhibited MTOR in BAT and primary adipocytes. (a) Representative blots and quantification showing levels of phosphorylated MTOR and its downstream target EIF4EBP1 in BATs of hyperthyroid mice. Result represents mean ± SEM (n = 3). (b) Representative blots and densitometry showing levels of phosphorylated MTOR, RPS6KB and EIF4EBP1 in primary brown adipocytes treated with 10 nM T3 for 0, 3, 6 and 24 h. Result represents mean ± SD (n = 3) where n represents number of independent experiments. (c) Graph showing amino acid profile in hyperthyroid BAT. Result represents mean ± SEM (n = 6). *: P < 0.05, **: P < 0.01, ***: P < 0.001 compared to euthyroid BAT.
SIRT1 regulates MTOR activity and T3-mediated autophagy
Because we have previously reported that T3 increases SIRT1 activity in hepatocytes, we also examined SIRT1 activity in brown adipocytes. SIRT1 is an NAD+-dependent deacetylase which has been reported to facilitate browning and BAT activity [33]. One of its downstream targets is FOXO1 (forkhead box O1), which regulates the expression of a number of autophagy related genes including Map1lc3b and Sqstm1. BAT from hyperthyroid mice had decreased acetylation of FOXO1 compared to BAT from euthyroid mice (Figure 8(a)), suggesting that T3 treatment activated SIRT1 and deacetylated FOXO1 in BAT. Accordingly, we observed that FOXO1 target genes (Map1lc3b, Sqstm1 and Pck1) were upregulated in BAT from hyperthyroid mice. We also observed the same trend in vitro as T3 reduced FOXO1 acetylation (Figure 8(c)), increased NAD+:NADH ratio (Figure 8(d)) and upregulated FOXO1 target genes in a time-dependent manner (Figure 8(e)) in primary brown adipocytes. We also examined whether SIRT1 acts upstream of MTORC1 since SIRT1 previously has been reported to negatively regulate MTORC1 activity [34]. Inhibition of SIRT1 activity by EX527 abolished T3-mediated MTOR inhibition and autophagy induction (Figures 8(f) and S7). Moreover, inhibiting SIRT1 activity by EX527 abolished the induction of mitochondrial respiration by T3 in brown adipocytes (Figure 8(g,h)) and confirmed that SIRT1 activity and autophagy induction were important for mitochondrial function.
Figure 8.
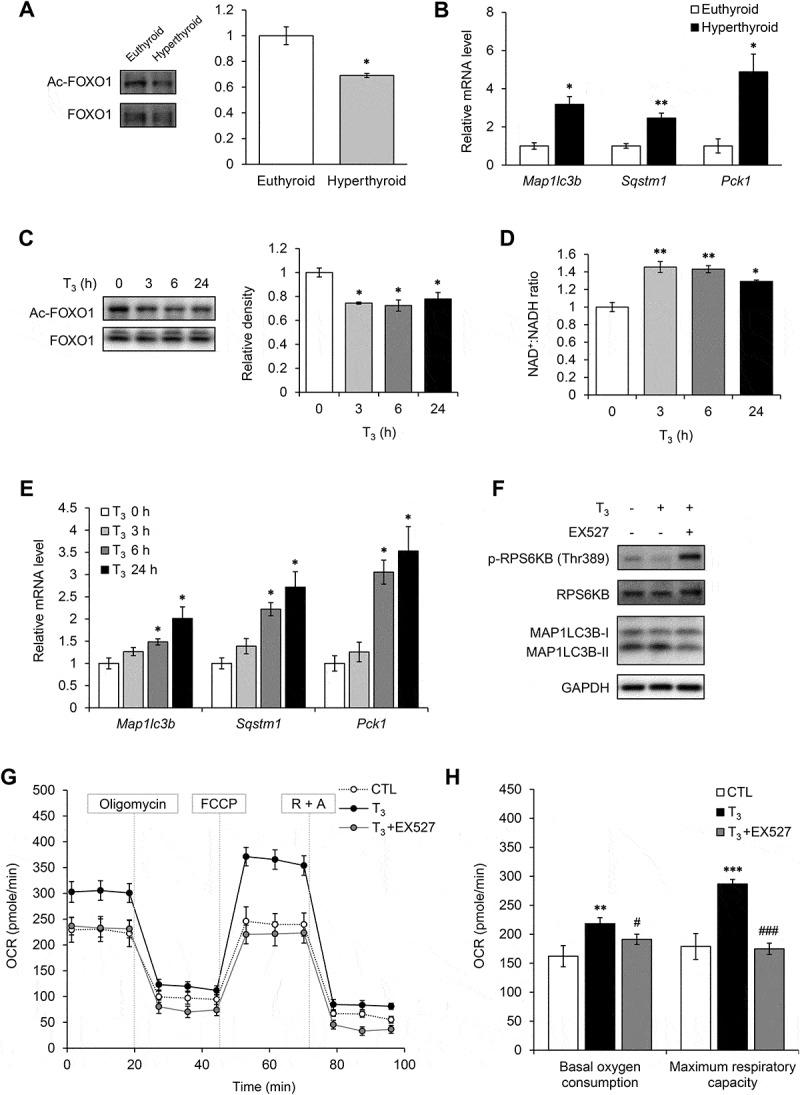
T3 activated SIRT1 in BAT and primary adipocytes. (a) Representative blots and quantification showing levels of acetylated FOXO1 in BAT of hyperthyroid mice. Result represents mean ± SEM (n = 3). (b) Real time PCR analysis of mRNA levels of FOXO1 target genes (Map1lc3b, Sqstm1 and Pck1) in BAT. Result represents mean ± SEM (n = 5). (c) Representative blots and densitometry showing levels of acetylated FOXO1 in primary brown adipocytes treated with 10 nM T3 for 0, 3, 6 and 24 h. Result represents mean ± SD (n = 3) where n represents number of independent experiments. (d) Graph showing NAD+/NADH ratio in primary brown adipocytes treated with 10 nM T3 for 0, 3, 6 and 24 h. Result represents mean ± SD (n = 6) where n represents number of independent experiments. (e) Real time PCR analysis of mRNA levels of FOXO1 target genes (Map1lc3b, Sqstm1 and Pck1) in primary brown adipocytes adipocytes treated with 10 nM T3 for 0, 3, 6 and 24 h. Result represents mean ± SD (n = 6) where n represents number of independent experiments. (f) Effect of SIRT1 inhibitor on T3-induced MTOR inhibition and autophagy. Representative immunoblots showing levels of RPS6KB phosphorylation and MAP1LC3B-II in primary brown adipocytes treated with EX527 and T3 for 6 h. (g) and (h) Seahorse analysis of OCR for primary brown adipocytes transfected with treated with EX527 and T3 for 24 h. Result represents mean ± SEM (n = 5) where n represents number of independent experiments. *: P < 0.05, **: P < 0.01, ***: P < 0.001 compared to euthyroid BAT.
Discussion
Thyroid hormone activates non-shivering thermogenesis by increasing metabolic activity in BAT. Hypothyroid patients have decreased adaptive thermogenesis during cold exposure that is corrected by thyroid hormone replacement [35] whereas hyperthyroid patients can undergo activation of thermogenesis, even at room temperature [36]. During cold exposure, sympathetic stimulation of BAT increases DIO2 expression and raises intracellular T3 concentration [5,37]. Christoffolete et al. have established that T3 is necessary for activation of thermogenesis in BAT since lack of adipose DIO2 causes abnormal lipid metabolism in BAT that eventually leads to cold intolerance despite increased sympathetic induction of UCP1 expression [10]. Previous studies have suggested that thyroid hormone mediates its effects on BAT primarily via hypothalamic stimulation of sympathetic innervation and induction of DIO2 expression [14,15]; however, a cell autonomous role of thyroid hormone on BAT activity has not been clearly established. Accordingly, we examined the metabolic role of T3-mediated autophagy on BAT function in a BAT cell line, primary brown adipocytes, and in vivo at normal temperature to eliminate the confounding effects of cold-induced sympathetic innervation. We refer to this increase in BAT activity at room temperature as ‘activated’ thermogenesis rather than adaptive thermogenesis since the latter occurs during cold exposure. In WAT, autophagy facilitates triglyceride accumulation and adipogenesis [38], and adipose-specific ablation of autophagy during development can lead to a browning phenotype [23]. Since these mice have increased whole body oxygen consumption and energy utilization, it is likely that the extensive browning in inguinal white fat due to inhibition of autophagy plays an important role in altering their metabolism and metabolic rate [23]. Additionally, it recently has been shown that a thyroid hormone analog, GC-1, can transdifferentiate WAT to beige fat [39]; however, little is known about the role of autophagy during this process. Inhibition of autophagy has been reported to facilitate browning of WAT and activation of autophagy has been associated with beige-to-white transition of adipocytes after withdrawal of external stimuli [40,41]; however, the role of autophagy in mature BAT had not been examined previously.
T3 stimulates BAT activity in a cell-autonomous manner
T3 stimulates thermogenesis by increasing transcription of Ucp1 and lipid metabolism in BAT [5,10]. Several recent studies show a central role for T3 in the hypothalamus and suggest that sympathetic stimulation was the main driver to increase BAT activity by inducing lipolysis and mitochondrial uncoupling [14,42]. However, while sympathetic activation significantly induces expression of DIO2 which generates T3 [14,15,43], the role of intracellular T3 on BAT activity has not been clearly established. Here, we showed that instead of merely playing a permissive role, T3 itself was sufficient for BAT and brown adipocyte activation since T3 increased acylcarnitine flux in vivo at room temperature. It also rapidly induced mitochondrial respiration in primary brown adipocytes in cell culture (30 min) suggesting that a non-transcriptional mechanism may be involved in stimulating mitochondrial activity initially (Figure 4(e,f)). Of note, we found that T3 increased PRKA activity and phosphorylation of PNPLA2 in vivo (Figure S8), suggesting that the sympathetic system also was activated by T3. Thus, it is likely that both local and central effects contribute to the BAT activation by T3.
T3 induces mitophagy, mitochondrial biogenesis and mitochondrial turnover in BAT
It has been speculated that autophagy may have an important functional role in BAT based upon studies in Fabp4- or Myf5-associated, tissue-specific Atg7 knockout mouse models [23,44]. Mice with Fabp4-associated (adipose tissue specific) deletion of the Atg7 gene had more mitochondria in both white and brown adipose tissues [23], suggesting that autophagy was essential for mitochondrial clearance. Moreover, BAT from mice with Myf5-associated (BAT and skeletal muscle specific) Atg7 conditional gene deletion exhibited deformed mitochondria with distorted cristae, further suggesting the importance of autophagy in BAT function [44].
In our studies, we showed that T3 stimulated autophagy in a cell-autonomous manner. T3 also induced autophagy and autophagic flux in primary brown adipocytes and BAT from hyperthyroid mice. Additionally, we showed that T3 stimulated mitophagy in BAT, using multiple methods including assessment of mitochondrial protein accumulation when autophagy was blocked, electron microscopy and mito-RFP/GFP fluorescence studies. Our mitochondria fractionation studies showed that T3 increased localization of SQSTM1 and MAP1LC3B-II in mitochondria (Figure S2(b,c)), suggesting that there was active recruitment of autophagy proteins to the mitochondria.
T3 induces mitochondrial biogenesis and respiration in liver and skeletal muscle [26,27], and lack of T3 impairs mitochondrial biogenesis during BAT development [9]. In our study, we showed that T3 stimulated the expression of PPARGC1A as well as several mitochondrial proteins in a cell autonomous manner (Figure 3). It also increased β-oxidation of fatty acids and mitochondrial respiration in BAT and primary brown adipocytes (Figure 4). These findings strongly suggested that efficient mitophagy coupled with increased mitochondrial biogenesis played a major role in increasing mitochondrial activity and thermogenesis. In this connection, we also observed high mitochondrial turnover rate by T3 by MitoTimer analysis (Figure 3(f)). Since T3 increased net mitochondrial number and activity in BAT and primary brown adipocytes, it suggested that T3 induced mitochondrial biogenesis at a higher rate than degradation. Additionally, unlike BAT in Atg5 (Figure 6) or Atg7 [44] conditional knockout mice, we did not observe gross deformities in mitochondrial architecture in BAT from the hyperthyroid mice, which again highlights the efficiency of mitochondrial turnover induced by T3.
T3 induces autophagy by inhibiting MTOR
We have previously shown that there is a tight coupling between autophagy and mitochondrial biogenesis in skeletal muscle [27]. This coupling was mediated by ROS generated from active mitochondria and involved AMPK stimulation of autophagy and mitochondrial biogenesis via ULK1 and PPARGC1A phosphorylation, respectively. Since T3 increases mitochondrial uncoupling and activity in brown adipocytes, we hypothesized that it may lead to ROS generation followed by AMPK activation. However, in contrast to our findings in liver and skeletal muscle [26,27], ROS and AMPK did not play a significant role in T3-induced autophagy in BAT since T3 did not increase amount of carbonyl proteins or significantly change AMPK phosphorylation (Figure S3). Instead, we observed that T3 inhibited MTOR activity, which is known to stimulate autophagy (Figure 6(a,b)). Knockdown of Ucp1 also did not prevent MTOR inhibition or autophagy induction by T3 (Figures S3(f) and S6(a)). Moreover, quenching ROS production with L-NAC did not suppress T3-mediated autophagy in BAT (data not shown), further suggesting that ROS was not responsible for the induction of autophagy in BAT. The ROS-independent activation of autophagy in BAT by T3 contrasted with our previous findings in liver and muscle from hyperthyroid mice, in which induction of mitophagy by T3 is activated by ROS, which then leads to increased intracellular calcium to stimulate CAMKK (calcium/calmodulin-dependent protein kinase kinase), followed by activation of AMPK, and AMPK phosphorylation of ULK1 to initiate phagophore formation [26,27]. In contrast, induction of autophagy in BAT by T3 was not initiated by ROS or AMPK activation, but instead, it was more likely caused by a decrease in MTOR activity.
T3 inhibits MTOR activity by amino acid catabolism and SIRT1 activation
BAT exhibits high amino acid handling capacity [45] and can employ amino acids as alternative sources of metabolic substrates during acute cold exposure [46]. Using metabolomic analyses, we showed that T3 decreased BAT amino acid levels due to stimulation of amino acid catabolism (Figures 4(a) and 7(c)). This, in turn, inhibited MTOR activity in BAT. We showed that T3 induced expression of PPARGC1A (Figure 3(a,d)), which is responsible for catabolism of branched chained amino acids (leucine, isoleucine and valine) in skeletal muscle [47]. Additionally, we also saw an increase in C3 acylcarnitine levels arising from oxidation of these amino acids. These data strongly suggest that T3 caused BAT to utilize amino acids as an additional fuel source in addition to fatty acids. It currently is not clear whether decreases in specific amino acids or total amino acids directly stimulated MTOR. Interestingly, leucine, glutamine and arginine previously were implicated in MTOR activation [31,32] and since the levels of leucine and arginine were significantly reduced in BAT from hyperthyroid mice, the decrease in these amino acids may have contributed to the decreased MTOR activity in this tissue. Although MTOR inhibition may be the main contributor to autophagy in BAT from hyperthyroid mice, it is possible that other upstream signalling pathways also contributed to MTOR inhibition. In particular, it is possible that UCP1-independent mitochondrial uncoupling also could have contributed to MTOR inhibition and/or autophagy, since mild mitochondrial uncoupling by FCCP induced autophagy in adipocytes [48]. In support for a similar effect by T3, mitochondrial uncoupling was able to increase OCR within 30 min in brown adipocytes (Figure 4(e)). Moreover, the associated decrease in MTOR activity did require UCP1, and thus was UCP-1 independent (Figure S6(a)). Of note, rapid and non-transcriptional effects by T3 on mitochondria have been reported to involve its direct binding to mitochondria [49]. This uncoupling effect also was not restricted to brown adipocytes since we previously observed acute OCR induction (1 h) by T3 in hepatocytes [26]. Acute mitochondrial uncoupling appears to be an early phase of autophagy induction that precedes transcriptional activation of autophagy genes by FOXO1 or TFEB. Although increased mitochondrial uncoupling by T3 in BAT did not induce ROS and AMPK activity, it can increase NAD+/NADH ratio and activate SIRT1. We have previously shown that T3 activates SIRT1 [50], a NAD+-dependent histone deacetylase that is a negative regulator of MTOR [34], in hepatocytes. Consistent with its ability to increase mitochondrial respiration and uncoupling, T3 also increased intracellular NAD+/NADH and activated SIRT1 within 3 to 6 h in BAT and primary brown adipocytes as well as liver [50] (Figure 7(d)). Interestingly, T3 was unable to decrease MTOR activity, induce autophagy, or increase oxidative phosphorylation when SIRT1 was inhibited (Figure 8(f,g,h)), suggesting that T3-mediated MTOR inhibition and autophagy in BAT required SIRT1. Since SIRT1 also can be activated by the cAMP-AMPK pathway [51], it may play a role in early autophagy induction when there is sympathetic stimulation of BAT. Although the relative contributions of decreased amino acids, SIRT1 activation, or other upstream signalling mechanism(s) on MTOR inhibition by T3 are not known; nevertheless, our data strongly imply that early T3-mediated stimulation of autophagy required MTOR inhibition whereas longer term autophagy may also require increased expression of autophagy genes.
Lipase may provide fatty acids to mitochondria during BAT activation by T3
The physiological significance of autophagy on BAT activation by thyroid hormone has not been characterized previously. Recently, Martinez-Lopez et al. report that cold exposure or sympathetic stimulation acutely induces lipophagy in BAT to undergo lipolysis of stored triglycerides to generate fuel for fatty acid β-oxidation [25]. While it certainly is possible that T3 also induced lipophagy, we did not find either increased lipid-laden autophagosomes in EM or colocalization of BODIPY and MAP1LC3B in BAT, in contrast to our previous observations in liver and muscle [26,27]. During classical lipolysis, free fatty acids are generated from endogenous triglycerides by protein kinase A-activated lipases such as PNPLA2/ATGL. In this connection, T3 stimulated mRNA expression (Figure 3(a)) and protein kinase A-mediated phosphorylation (Figure S8) of PNPLA2 in BAT to stimulate lipase activity. Taken together, it appears that classical lipolysis may play a more significant role than lipophagy in generating fatty acids as fuel for β-oxidation in BAT.
Both cold exposure and thyroid hormone increase autophagy and BAT activity
Cold exposure is the primary stimulus for adaptive thermogenesis, but the involvement of autophagy during BAT activation remains unclear. A recent study shows that one day of cold exposure leads to inhibition of autophagy in BAT accompanied by accumulation of mitochondria and UCP1 proteins [52]. However, Martinez-Lopez et al. show that activation of lipophagy in BAT after 1 h of acute cold exposure [25]. Thus, regulation of autophagy in BAT may be governed by the duration of cold exposure and the temporal response to different hormones. Accordingly, we examined autophagy and temporal expression of autophagy genes in mice during cold exposure and found that autophagy was blocked after one day; however, both transcription and expression of autophagy proteins are induced and autophagy is increased after 3 d of cold exposure (Yau and Yen, unpublished data). In this connection, it is reported that mitochondrial function during cold exposure is decreased in mice with adipose tissue-specific impairment of autophagy (adenovirus with BAT-specific Cre into Atg7Flox/Flox mice) [44]. Similarly, our study in Atg5 cKO mouse model showed decreased body temperature in hyperthyroid Atg5 cKO mice, further confirming the importance of autophagy during BAT activation. Since cold exposure increases expression of DIO2 in BAT [53,54], it is likely that stimulation of BAT autophagy and mitochondrial clearance in cold-acclimated mice may be facilitated by increased generation of intracellular T3 by DIO2 [1,5,15]. Our study also showed that T3-stimulated autophagy prevented oxidative stress in BAT. Blocking autophagy increased oxidative stress and decreased brown adipocyte mitochondrial respiration. Significantly, ROS and ROS-induced cellular damage previously have been observed in BAT mitochondria during cold exposure [55–57], so it is possible that mitochondrial respiration and consequent ROS generation may be higher for cold exposure than for T3 treatment. Taken together, we showed that autophagy in BAT is important for regulating mitochondrial function during thermogenesis and T3 likely facilitates the induction of autophagy and mitochondrial turnover during BAT activation.
Conclusion
Recent reports have suggested that BAT activation may have potential beneficial effects in reducing obesity and improving glycemic control in diabetes [7]. In a recent human study, Cypess et al. show that a β3-adrenergic receptor agonist can activate BAT [58]. Broaeders et al. report that levothyroxine treatment improves human BAT activation in response to cold [35]. Thyromimetics that specifically target BAT may be useful for pharmacological activation of BAT [39] while potentially have less side effects than TH. These analogs have therapeutic promise for the treatment of obesity and other metabolic diseases since they are able to stimulate BAT activity at normal temperatures.
Our results demonstrated that T3 has a cell autonomous role in BAT thermogenesis by stimulating autophagy-dependent fatty acid oxidation and mitochondrial respiration. These effects were coupled to increased mitochondrial biogenesis, mitophagy, and mitochondrial turnover by T3. Surprisingly unlike adrenergic stimulation or thyroid hormone effects in the liver and muscle, activation of mitochondrial oxygen consumption by T3 did not generate high levels of ROS or induce expression of antioxidant enzymes. Instead, BAT relied primarily on increased mitophagy and mitochondrial biogenesis to maintain mitochondrial quality control. Our findings suggest that T3 and its analogs as well as other autophagy-inducing drugs that promote high mitochondrial turnover in BAT may potentially be useful therapies that increase thermogenesis in BAT to treat obesity and other associated metabolic conditions.
Materials and methods
Reagents
Unless otherwise specified, all chemicals were obtained from Sigma-Aldrich and all culture media were from Gibco (Thermo Fisher Scientific). Transfection reagents and siRNA (Ambion, 4390771) were purchased from Thermo Fisher Scientific. The eGFP-MAP1LC3B (Addgene, 21073) and mito-RFP-EGFP plasmids were kind gifts from Prof. T. Yoshimori (Osaka University, Osaka, Japan) and Dr Andreas Till (Institute of Clinical Molecular Biology Christian-Albrechts-University of Kiel; Kiel, Germany), respectively. pMitoTimer was a gift from Zhen Yan (Addgene, 52659). The CoralHue® Mitochondria-targeted mKeima-Red expression plasmid (pMT-mKeima-Red, AM-V0251) was purchased from MBL International Corporation. Norepinephrine was purchased from Sigma-Aldrich (A0937).
Animals
Animals were treated in accordance with the Guide for the Care and Use of Laboratory Animals and experiments were approved by the Institutional Animal Care and Use Committee (IACUC) and Duke-NUS Graduate Medical School. Male C57BL/6 mice (8 to 10 wk old) were housed in hanging polycarbonate cages and kept on a 12 h light-dark cycle in a temperature-controlled room at 24°C. They were allowed ad libitum access to water and a standard laboratory chow. Mice were made hyperthyroid by daily intraperitoneal injection of 10 μg T3 (Sigma-Aldrich, T6397) per 100 g body weight for 10 d. Autophagy inhibition in vivo was achieved by intraperitoneal injection of 6 mg chloroquine (CQ) (Sigma-Aldrich, C6628) per 100 g body weight for 3 d. For cold exposure, mice were housed at 4°C for 3 d.
Adenoviral infection
For tissue-specific knockout study, male homozygous Atg5Flox/Flox mice (C57BL/6/129) were obtained from the Riken BioResource Center, Japan, courtesy of Dr. Noboru Mizushima [59,60]. A total of 5 × 10¹¹ genome copies of control adenovirus or Ucp1-Cre-expressing adeno-associated virus (Vector BioLabs, AAV8-UCP1-eGFP and AAV8-UCP1-iCre) was injected into tail vein of 10-week-old male Atg5Flox/Flox mice. After 2 wk of injection, the mice were made hyperthyroid by daily T3 injection for 10 d. Core body temperature was measured using a rectal temperature probe on the last day of T3 injection.
Primary culture of brown preadipocytes
Primary brown adipocytes were derived from the interscapular BAT of 2 to 3 wk old C57BL/6 mice. The precursor cells were isolated according to the protocols described by Rehnmark et al. and Klein et al. [61,62]. Briefly, BAT from 6 to 8 mice was cut into small pieces and digested with 0.2% (w:v) collagenase (Sigma-Aldrich, C6885) for 30 min in a shaking water bath. After filtering through a 150-μm nylon screen (Fisher Scientific, 22363549), the pellet containing preadipocytes were collected by centrifugation at 200 g for 5 min. Preadipocytes were maintained in DMEM (Gibco, 11995–065) supplemented with 15% heat inactivated FBS (Gibco, 10500–064), non-essential amino acids (Gibco, 11140–076), 5 ng/ml human basic FGF (Thermo Fisher Scientific, PHG0021), 100 U/ml penicillin and 50 μg/ml streptomycin (Sigma-Aldrich, F7524). Differentiation was initiated with DMEM containing 10% fetal bovine serum (FBS; Gibco, 15140122), dexamethasone (Sigma-Aldrich, D1756), 3-isobutyl-1-methylxanthine (IBMX) (Sigma-Aldrich, I5879) and insulin (Sigma-Aldrich, I9278). Cells were allowed to differentiate for 6 d before treatment. For T3 treatment, cells were treated with 10 nM T3 for 24 h unless stated otherwise. For autophagic flux assay, cells were treated with 50 nM bafilomycin A1/Baf (Sigma-Aldrich, B1793) 6 h before harvest. For RNA interference studies, Lipofectamine® RNAiMAX Reagent (Invitrogen, 13778075) was used to transfect the cells 2 d before T3 treatment.
Cell line transfection
Plasmid transfection were performed in the brown adipocyte cell line mBAP-9 [63]. Cells were seeded on cell culture slide (SPL Life Sciences, 30104) and maintained in DMEM containing 10% FBS and differentiated by DMEM containing 10% FBS, insulin, T3, dexamethasone and IBMX for 6 d before treatment. Transfection was carried out 2 d before treatment in medium without T3 using Lipofectamine® 3000 Reagent (Invitrogen, L3000008) in accordance to the manufacturer’s protocols. After transfection, cells were treated with 10 nM of T3 for 24 h before fixation with 4% paraformaldehyde (Sigma-Aldrich, P6148). Cell imaging was performed using a Zeiss LSM 710 Confocal Microscope.
Western blotting
Cells and tissues were dissociated in RIPA buffer (50 mM Tris-HCl, pH 8.0, 150 mM sodium chloride, 1% Triton X-100 (Bio-Rad, 1610407), 0.5% sodium deoxycholate (Sigma-Aldrich, D6750), 0.1% sodium dodecyl sulfate, 2 mM EGTA, 2 mM EDTA, protease inhibitors (Sigma-Aldrich, P8340) and phosphatase inhibitors (Sigma-Aldrich, P5726, P0044). Proteins were denatured by boiling in Laemmli sample buffer (250 mM Tris-HCl, pH 7.4, 2% w:v sodium dodecyl sulfate, 25% v:v glycerol, 50 mM DTT, 0.01% w:v bromophenol blue). Equal amount of proteins was resolved on sodium dodecyl sulfate-polyacrylamide gels using the Mini-PROTEAN 3 Electrophoresis unit and transferred to polyvinylidene difluoride membranes (Bio-Rad) using the TransBlot® Turbo™ Transfer System (Bio-Rad). The following antibodies were used to detect the target proteins. Cell Signaling Technology: MAP1LC3B (2775), SQSTM1/p62 (5114), COX4I1 (4850), ATG5 (2630), PRKAA1/2 (protein kinase AMP-activated catalytic subunit alpha 1) (5831), phospho-PRKAA1/2 (Thr172) (2535), MTOR (2983), phospho-MTOR (Ser2448) (5536), RPS6KB (9202), phospho-RPS6KB (Thr389) (9205), EIF4EBP1 (9452), phospho-EIF4EBP1 (Thr37/46) (2855), VDAC1 (4661), FOXO1 (2880), PRKA/protein kinase A substrates (9621) and GAPDH (2118). Santa Cruz Biotechnology: ACTB (sc-47778), TOMM20 (sc-11415) and acetylated FOXO1 (sc-49437), Abcam: UCP1 (ab10983), PNPLA2 (ab99532) and phospho-PNPLA2 (Ser406) (ab135093).
Protein carbonylation
The amount of protein carbonyls was measured with an OxyBlot™ Oxidized Protein Detection Kit (EMD Millipore, S7150) according to the manufacturer’s protocol.
Quantitative real-time PCR
Total RNA was isolated using the InviTrap Spin Universal RNA Mini Kit (Stratec Molecular, 1060100300) followed by cDNA synthesis using iScript Select cDNA Synthesis Kit (Bio-Rad, 1708897) according to the manufacturer’s protocol. Quantitative polymerase chain reaction was performed on a Rotor-Gene Q cycler (QIAGEN, USA) using QuantiTect SYBR Green PCR Kit (QIAGEN, 204145) in accordance with the manufacturer’s instructions using Polr2a as the internal control. Sequence of the primers are listed in Table S1.
Seahorse XF analyzer measurement for mitochondrial oxygen consumption rate (OCR)
Preadipocytes were seeded on XF-24-well culture microplates and allowed to differentiate for 7 d. After treatment, oxygen consumption was measured using a microplate (type XF24) extracellular analyzer (Seahorse Bioscience, Billerica, MA, USA). Reagents were optimized using the Mito stress kit from Seahorse Bioscience (Agilent, 100850–001) using the protocol and algorithm program in the analyzer. After measuring initial oxygen consumption rate (OCR), 1 μM oligomycin was added to inhibit ATP synthesis from oxidative phosphorylation. Then 1 μM carbonyl cyanide-4-(trifluoromethoxy)phenylhydrazone (FCCP) was added to uncouple the mitochondrial membrane that stimulates respiration. Lastly, 1 μM rotenone and 1 μM antimycin A (R + A) was added to inhibit complex I and III that terminates mitochondrial oxidative phosphorylation. Basal OCR was calculated as [OCRinitial – OCRR+A]. Maximum respiration rate was computed as [OCRFCCP – OCRR+A].
Metabolic profiling of acylcarnitines and amino acids
Acylcarnitines and amino acids in BAT were measure in the Duke-NUS Metabolomics Facility according to previously established mass spectrometry (MS)-based methods [64–66]. Briefly, brown adipose tissue was homogenized in 50% acetonitrile and 0.3% formic acid. For acylcarnitine and amino acid extraction, 100 μl of tissue homogenate was extracted using methanol. The acylcarnitine extracts were derivatized with 3 M hydrochloric acid in methanol, dried, and reconstituted in methanol for analysis in liquid chromatography/mass spectrometry (LC/MS). Acylcarnitine measurements were made using flow injection–tandem mass spectrometry on the Agilent 6430 Triple Quadrupole LC/MS system (Agilent Technologies, CA, USA). The sample analysis was carried out at 0.4 ml/min of 80:20 methanol:water as mobile phase and injection of 2 μl of sample. Data acquisition and analysis were performed on Agilent MassHunter Workstation B.06.00 software. Amino acids were separated using a C8 column (Rapid Resolution HT, 4.5 x 50 mm, 1.8 μm, Zorbax SB-C8) on a Agilent 1290 Infinity LC system (Agilent Technologies, CA, USA) coupled with quadrupole-ion trap mass spectrometer (QTRAP 5500, AB Sciex, DC, USA). Mobile phase A (10:90 water:acetonitrile) and Mobile phase B (90:10 water:acetonitrile) both containing 10 mM of ammonium formate were used for chromatography separation. The LC run was performed at a flow rate of 0.6 mL min−1 with initial gradient of 20% B for 0.5 min, then ramped to 100% B in 2.5 min, maintained for 0.5 min, followed by re-equilibrating the column to the initial run condition (20% B) for 2 min. All compounds were ionized in positive mode using electrospray ionization. The chromatograms were integrated using MultiQuant™ 3.0 software (AB Sciex, DC, USA).
Electron microscopy
Cells were seeded in a 4-chambered coverglass (Thermo Scientific Nunc, NNU 155383-PK) and allowed to differentiate for 7 d before addition of T3 or bafilomycin A1 (Baf; Sigma-Aldrich, B1793). After treatment, cells were fixed with 2.5% glutaraldehyde (nacalai tesque, 17025–25) in sodium phosphate buffer (0.1 M, pH 7.4) and washed 3 times with phosphate buffered saline (PBS; Axil Scientific, BUF-2040-1X1L). The samples were then post-fixed with 1% osmium tetroxide and dehydrated with a series of alcohol with increasing concentration. After embedding samples in Araldite (Pelco, 18060), ultra-thin sections were cut and double-stained with uranyl acetate and lead citrate. Images were taken using the Olympus EM208S transmission electron microscope (Japan).
Statistical analysis
Cell culture experiments were performed in triplicate and independently repeated 3 times. Data were pooled and represented as either mean ± SD for cell culture experiments or mean ± SEM for animal experiments. The statistical significance between sample groups was assessed by the Student t test (2-tailed). One-way ANOVA and the Tukey post-hoc test were performed when comparing different groups.
Funding Statement
The research was funded by NMRC/CIRG/1457/2016 (PMY), NMRC/CSA/0054/2013 (PMY), NMRC/CIRG/1340/2012 (PMY), NMRC/OFYIRG/0002/2016 (BKS) and A*STAR R-913-301-197-304 (SS). This work was supported by the MOH | National Medical Research Council (NMRC) and the Agency for Science, Technology and Research (A*STAR).
Acknowledgments
The author would like to thank Dr. Kenji Ohba, Mr. Sherwin Xie, Ms. Andrea Lim, Ms. Sook Yoong Chia, Mr. Ufuk Degirmenci and Dr. Kristmundur Sigmundsson for their helpful advice and technical support. We are thankful to Prof. Jean-Paul Kovalik, Prof. Jianhong Ching, Dr. Cheng Shang See, Kevin Timothy Fridianto, Edison and Kim Huey Ee for performing metabolic profiling (Metabolomics@ Duke-NUS). We would also like to thank Prof. T. Yoshimori (Osaka University, Osaka, Japan) and Dr Andreas Till (Institute of Clinical Molecular Biology Christian-Albrechts-University of Kiel; Kiel, Germany) for gifting plasmids.
Disclosure statement
No potential conflict of interest was reported by the authors.
Supplementary material
Supplementary data for this article can be accessed here.
References
- [1].Bianco AC, Kim BW.. Deiodinases: implications of the local control of thyroid hormone action. J Clin Invest. 2006. October;116(10):2571–2579. PubMed PMID: 17016550; PubMed Central PMCID: PMCPMC1578599. [DOI] [PMC free article] [PubMed] [Google Scholar]
- [2].Silva JE. The thermogenic effect of thyroid hormone and its clinical implications. Ann Intern Med. 2003. August 5;139(3):205–213. PubMed PMID: 12899588. [PubMed] [Google Scholar]
- [3].Bianco AC, Maia AL, da Silva WS, et al. Adaptive activation of thyroid hormone and energy expenditure. Biosci Rep. 2005. Jun-Aug;25(3–4):191–208. PubMed PMID: 16283553. [DOI] [PubMed] [Google Scholar]
- [4].Obregon MJ. Adipose tissues and thyroid hormones. Front Physiol. 2014;5:479 PubMed PMID: 25566082; PubMed Central PMCID: PMCPMC4263094. [DOI] [PMC free article] [PubMed] [Google Scholar]
- [5].de Jesus LA, Carvalho SD, Ribeiro MO, et al. The type 2 iodothyronine deiodinase is essential for adaptive thermogenesis in brown adipose tissue. J Clin Invest. 2001. November;108(9):1379–1385. PubMed PMID: 11696583; PubMed Central PMCID: PMCPMC209445. [DOI] [PMC free article] [PubMed] [Google Scholar]
- [6].Lowell BB, Spiegelman BM. Towards a molecular understanding of adaptive thermogenesis. Nature. 2000. April 6;404(6778):652–660. PubMed PMID: 10766252. [DOI] [PubMed] [Google Scholar]
- [7].Cypess AM, Kahn CR. Brown fat as a therapy for obesity and diabetes. Curr Opin Endocrinol Diabetes Obes. 2010. April;17(2):143–149. PubMed PMID: 20160646; PubMed Central PMCID: PMCPMC3593105. [DOI] [PMC free article] [PubMed] [Google Scholar]
- [8].Obregon MJ, Ruiz De Ona C, Hernandez A, et al. Thyroid hormones and 5ʹ-deiodinase in rat brown adipose tissue during fetal life. Am J Physiol. 1989. November;257(5 Pt 1):E625–31. PubMed PMID: 2688435. [DOI] [PubMed] [Google Scholar]
- [9].Hall JA, Ribich S, Christoffolete MA, et al. Absence of thyroid hormone activation during development underlies a permanent defect in adaptive thermogenesis. Endocrinology. 2010. September;151(9):4573–4582. PubMed PMID: 20660060; PubMed Central PMCID: PMCPMC2940501. [DOI] [PMC free article] [PubMed] [Google Scholar]
- [10].Christoffolete MA, Linardi CC, de Jesus L, et al. Mice with targeted disruption of the Dio2 gene have cold-induced overexpression of the uncoupling protein 1 gene but fail to increase brown adipose tissue lipogenesis and adaptive thermogenesis. Diabetes. 2004. March;53(3):577–584. PubMed PMID: 14988240. [DOI] [PubMed] [Google Scholar]
- [11].Weiner J, Kranz M, Kloting N, et al. Thyroid hormone status defines brown adipose tissue activity and browning of white adipose tissues in mice. Sci Rep. 2016. December;12(6):38124 PubMed PMID: 27941950; PubMed Central PMCID: PMCPMC5150531. [DOI] [PMC free article] [PubMed] [Google Scholar]
- [12].Carvalho SD, Kimura ET, Bianco AC, et al. Central role of brown adipose tissue thyroxine 5ʹ-deiodinase on thyroid hormone-dependent thermogenic response to cold. Endocrinology. 1991. April;128(4):2149–2159. PubMed PMID: 2004619. [DOI] [PubMed] [Google Scholar]
- [13].Bianco AC, McAninch EA. The role of thyroid hormone and brown adipose tissue in energy homoeostasis. Lancet Diabetes Endocrinol. 2013. November;1(3):250–258. PubMed PMID: 24622373; PubMed Central PMCID: PMCPMC4976626. [DOI] [PMC free article] [PubMed] [Google Scholar]
- [14].Lopez M, Varela L, Vazquez MJ, et al. Hypothalamic AMPK and fatty acid metabolism mediate thyroid regulation of energy balance. Nat Med. 2010. September;16(9):1001–1008. PubMed PMID: 20802499; PubMed Central PMCID: PMCPMC2935934. [DOI] [PMC free article] [PubMed] [Google Scholar]
- [15].Reiter RJ, Klaus S, Ebbinghaus C, et al. Inhibition of 5ʹ-deiodination of thyroxine suppresses the cold-induced increase in brown adipose tissue messenger ribonucleic acid for mitochondrial uncoupling protein without influencing lipoprotein lipase activity. Endocrinology. 1990. May;126(5):2550–2554. PubMed PMID: 2328697. [DOI] [PubMed] [Google Scholar]
- [16].Cannon B, Nedergaard J. Brown adipose tissue: function and physiological significance. Physiol Rev. 2004. January;84(1):277–359. PubMed PMID: 14715917. [DOI] [PubMed] [Google Scholar]
- [17].Obregon MJ, Pitamber R, Jacobsson A, et al. Euthyroid status is essential for the perinatal increase in thermogenin mRNA in brown adipose tissue of rat pups. Biochem Biophys Res Commun. 1987. October 14;148(1):9–14. PubMed PMID: 3118877. [DOI] [PubMed] [Google Scholar]
- [18].Bianco AC, Sheng XY, Silva JE. Triiodothyronine amplifies norepinephrine stimulation of uncoupling protein gene transcription by a mechanism not requiring protein synthesis. J Biol Chem. 1988. December 5;263(34):18168–18175. PubMed PMID: 3192531. [PubMed] [Google Scholar]
- [19].Bianco AC, Kieffer JD, Silva JE. Adenosine 3ʹ,5ʹ-monophosphate and thyroid hormone control of uncoupling protein messenger ribonucleic acid in freshly dispersed brown adipocytes. Endocrinology. 1992. May;130(5):2625–2633. PubMed PMID: 1374009. [DOI] [PubMed] [Google Scholar]
- [20].Giralt M, Martin I, Iglesias R, et al. Ontogeny and perinatal modulation of gene expression in rat brown adipose tissue. Unaltered iodothyronine 5ʹ-deiodinase activity is necessary for the response to environmental temperature at birth. Eur J Biochem. 1990. October 5;193(1):297–302. PubMed PMID: 2171932. [DOI] [PubMed] [Google Scholar]
- [21].Hernandez A, Obregon MJ. T3 potentiates the adrenergic stimulation of type II 5ʹ-deiodinase activity in cultured rat brown adipocytes. Am J Physiol. 1996. July;271(1 Pt 1):E15–23. PubMed PMID: 8760076. [DOI] [PubMed] [Google Scholar]
- [22].Guerra C, Roncero C, Porras A, et al. Triiodothyronine induces the transcription of the uncoupling protein gene and stabilizes its mRNA in fetal rat brown adipocyte primary cultures. J Biol Chem. 1996. January 26;271(4):2076–2081. PubMed PMID: 8567662. [DOI] [PubMed] [Google Scholar]
- [23].Zhang Y, Goldman S, Baerga R, et al. Adipose-specific deletion of autophagy-related gene 7 (atg7) in mice reveals a role in adipogenesis. Proc Natl Acad Sci USA. 2009. November 24;106(47):19860–19865. PubMed PMID: 19910529; PubMed Central PMCID: PMCPMC2785257. [DOI] [PMC free article] [PubMed] [Google Scholar]
- [24].Mottillo EP, Desjardins EM, Crane JD, et al. Lack of adipocyte AMPK exacerbates insulin resistance and hepatic steatosis through brown and beige adipose tissue function. Cell Metab. 2016. July 12;24(1):118–129. PubMed PMID: 27411013. [DOI] [PMC free article] [PubMed] [Google Scholar]
- [25].Martinez-Lopez N, Garcia-Macia M, Sahu S, et al. Autophagy in the CNS and periphery coordinate lipophagy and lipolysis in the brown adipose tissue and liver. Cell Metab. 2016. January 12;23(1):113–127. PubMed PMID: 26698918; PubMed Central PMCID: PMCPMC4715637. [DOI] [PMC free article] [PubMed] [Google Scholar]
- [26].Sinha RA, Singh BK, Zhou J, et al. Thyroid hormone induction of mitochondrial activity is coupled to mitophagy via ROS-AMPK-ULK1 signaling. Autophagy. 2015;11(8):1341–1357. PubMed PMID: 26103054; PubMed Central PMCID: PMCPMC4590606. [DOI] [PMC free article] [PubMed] [Google Scholar]
- [27].Lesmana R, Sinha RA, Singh BK, et al. Thyroid hormone stimulation of autophagy is essential for mitochondrial biogenesis and activity in skeletal muscle. Endocrinology. 2016. January;157(1):23–38. PubMed PMID: 26562261. [DOI] [PubMed] [Google Scholar]
- [28].Laker RC, Xu P, Ryall KA, et al. A novel MitoTimer reporter gene for mitochondrial content, structure, stress, and damage in vivo. J Biol Chem. 2014. April 25;289(17):12005–12015. PubMed PMID: 24644293; PubMed Central PMCID: PMCPMC4002107. [DOI] [PMC free article] [PubMed] [Google Scholar]
- [29].Hernandez G, Thornton C, Stotland A, et al. MitoTimer: a novel tool for monitoring mitochondrial turnover. Autophagy. 2013. November 1;9(11):1852–1861. PubMed PMID: 24128932; PubMed Central PMCID: PMCPMC4028337. [DOI] [PMC free article] [PubMed] [Google Scholar]
- [30].Lynch CJ. Role of leucine in the regulation of mTOR by amino acids: revelations from structure-activity studies. J Nutr. 2001. March;131(3):861S–865S. PubMed PMID: 11238775. [DOI] [PubMed] [Google Scholar]
- [31].Jewell JL, Russell RC, Guan KL. Amino acid signalling upstream of mTOR. Nat Rev Mol Cell Biol. 2013. March;14(3):133–139. PubMed PMID: 23361334; PubMed Central PMCID: PMCPMC3988467. [DOI] [PMC free article] [PubMed] [Google Scholar]
- [32].Bar-Peled L, Sabatini DM. Regulation of mTORC1 by amino acids. Trends Cell Biol. 2014. July;24(7):400–406. PubMed PMID: 24698685; PubMed Central PMCID: PMCPMC4074565. [DOI] [PMC free article] [PubMed] [Google Scholar]
- [33].Boutant M, Joffraud M, Kulkarni SS, et al. SIRT1 enhances glucose tolerance by potentiating brown adipose tissue function. Mol Metab. 2015. February;4(2):118–131. PubMed PMID: 25685699; PubMed Central PMCID: PMCPMC4314542. [DOI] [PMC free article] [PubMed] [Google Scholar]
- [34].Ghosh HS, McBurney M, Robbins PD. SIRT1 negatively regulates the mammalian target of rapamycin. PLoS One. 2010. February 15;5(2):e9199 PubMed PMID: 20169165; PubMed Central PMCID: PMCPMC2821410. [DOI] [PMC free article] [PubMed] [Google Scholar]
- [35].Broeders EP, Vijgen GH, Havekes B, et al. Thyroid hormone activates brown adipose tissue and increases non-shivering thermogenesis–a cohort study in a group of thyroid carcinoma patients. PLoS One. 2016;11(1):e0145049 PubMed PMID: 26784028; PubMed Central PMCID: PMCPMC4718641. [DOI] [PMC free article] [PubMed] [Google Scholar]
- [36].Lahesmaa M, Orava J, Schalin-Jantti C, et al. Hyperthyroidism increases brown fat metabolism in humans. J Clin Endocrinol Metab. 2014. January;99(1):E28–35. PubMed PMID: 24152690. [DOI] [PubMed] [Google Scholar]
- [37].Silva JE, Larsen PR. Hormonal regulation of iodothyronine 5ʹ-deiodinase in rat brown adipose tissue. Am J Physiol. 1986. December;251(6 Pt 1):E639–43. PubMed PMID: 3538896. [DOI] [PubMed] [Google Scholar]
- [38].Zhang Y, Zeng X, Jin S. Autophagy in adipose tissue biology. Pharmacol Res. 2012. December;66(6):505–512. PubMed PMID: 23017672. [DOI] [PubMed] [Google Scholar]
- [39].Lin JZ, Martagon AJ, Cimini SL, et al. Pharmacological activation of thyroid hormone receptors elicits a functional conversion of white to brown fat. Cell Rep. 2015. November 24;13(8):1528–1537. PubMed PMID: 26586443; PubMed Central PMCID: PMCPMC4662916. [DOI] [PMC free article] [PubMed] [Google Scholar]
- [40].Altshuler-Keylin S, Shinoda K, Hasegawa Y, et al. Beige adipocyte maintenance is regulated by autophagy-induced mitochondrial clearance. Cell Metab. 2016. September 13;24(3):402–419. PubMed PMID: 27568548; PubMed Central PMCID: PMCPMC5023491. [DOI] [PMC free article] [PubMed] [Google Scholar]
- [41].Armani A, Cinti F, Marzolla V, et al. Mineralocorticoid receptor antagonism induces browning of white adipose tissue through impairment of autophagy and prevents adipocyte dysfunction in high-fat-diet-fed mice. FASEB J. 2014. August;28(8):3745–3757. PubMed PMID: 24806198. [DOI] [PubMed] [Google Scholar]
- [42].Cannon B, Nedergaard J. Thyroid hormones: igniting brown fat via the brain. Nat Med. 2010. September;16(9):965–967. PubMed PMID: 20823876. [DOI] [PubMed] [Google Scholar]
- [43].Harms M, Seale P. Brown and beige fat: development, function and therapeutic potential. Nat Med. 2013. October;19(10):1252–1263. PubMed PMID: 24100998. [DOI] [PubMed] [Google Scholar]
- [44].Martinez-Lopez N, Athonvarangkul D, Sahu S, et al. Autophagy in Myf5+ progenitors regulates energy and glucose homeostasis through control of brown fat and skeletal muscle development. EMBO Rep. 2013. September;14(9):795–803. PubMed PMID: 23907538; PubMed Central PMCID: PMCPMC3790054. [DOI] [PMC free article] [PubMed] [Google Scholar]
- [45].Lopez-Soriano FJ, Alemany M. Activities of enzymes of amino acid metabolism in rat brown adipose tissue. Biochem Int. 1986. March;12(3):471–478. PubMed PMID: 2871838. [PubMed] [Google Scholar]
- [46].Lopez-Soriano FJ, Fernandez-Lopez JA, Mampel T, et al. Amino acid and glucose uptake by rat brown adipose tissue. Effect of cold-exposure and acclimation. Biochem J. 1988. June 15;252(3):843–849. PubMed PMID: 3421924; PubMed Central PMCID: PMCPMC1149224. [DOI] [PMC free article] [PubMed] [Google Scholar]
- [47].Hatazawa Y, Tadaishi M, Nagaike Y, et al. PGC-1alpha-mediated branched-chain amino acid metabolism in the skeletal muscle. PLoS One. 2014;9(3):e91006 PubMed PMID: 24638054; PubMed Central PMCID: PMCPMC3956461. [DOI] [PMC free article] [PubMed] [Google Scholar]
- [48].Demine S, Tejerina S, Bihin B, et al. Mild mitochondrial uncoupling induces HSL/ATGL-independent lipolysis relying on a form of autophagy in 3T3-L1 adipocytes. J Cell Physiol. 2018. February;233(2):1247–1265. PubMed PMID: 28488768. [DOI] [PubMed] [Google Scholar]
- [49].Goglia F, Moreno M, Lanni A. Action of thyroid hormones at the cellular level: the mitochondrial target. FEBS Lett. 1999. June 11;452(3):115–120. PubMed PMID: 10386574. [DOI] [PubMed] [Google Scholar]
- [50].Singh BK, Sinha RA, Zhou J, et al. Hepatic FOXO1 target genes are co-regulated by thyroid hormone via RICTOR protein deacetylation and MTORC2-AKT protein inhibition. J Biol Chem. 2016. January 1;291(1):198–214. PubMed PMID: 26453307; PubMed Central PMCID: PMCPMC4697156. [DOI] [PMC free article] [PubMed] [Google Scholar]
- [51].Gerhart-Hines Z, Dominy JE Jr., Blattler SM, et al. The cAMP/PKA pathway rapidly activates SIRT1 to promote fatty acid oxidation independently of changes in NAD(+). Mol Cell. 2011. December 23;44(6):851–863. PubMed PMID: 22195961; PubMed Central PMCID: PMCPMC3331675. [DOI] [PMC free article] [PubMed] [Google Scholar]
- [52].Cairo M, Villarroya J, Cereijo R, et al. Thermogenic activation represses autophagy in brown adipose tissue. Int J Obes (Lond). 2016. June 24;40:1591–1599. PubMed PMID: 27339605. [DOI] [PubMed] [Google Scholar]
- [53].Gao M, Zhang C, Ma Y, et al. Cold exposure improves the anti-diabetic effect of T0901317 in streptozotocin-induced diabetic mice. AAPS J. 2015. May;17(3):700–710. PubMed PMID: 25739819; PubMed Central PMCID: PMCPMC4406970. [DOI] [PMC free article] [PubMed] [Google Scholar]
- [54].Watanabe M, Yamamoto T, Kakuhata R, et al. Synchronized changes in transcript levels of genes activating cold exposure-induced thermogenesis in brown adipose tissue of experimental animals. Biochim Biophys Acta. 2008. January;1777(1):104–112. PubMed PMID: 18036333. [DOI] [PubMed] [Google Scholar]
- [55].Sanchez-Alavez M, Conti B, Wood MR, et al. ROS and sympathetically mediated mitochondria activation in brown adipose tissue contribute to methamphetamine-induced hyperthermia. Front Endocrinol (Lausanne). 2013;4:44 PubMed PMID: 23630518; PubMed Central PMCID: PMCPMC3632801. [DOI] [PMC free article] [PubMed] [Google Scholar]
- [56].Barja de Quiroga G, Lopez-Torres M, Perez-Campo R, et al. Effect of cold acclimation on GSH, antioxidant enzymes and lipid peroxidation in brown adipose tissue. Biochem J. 1991. July 1;277(Pt 1):289–292. PubMed PMID: 1854342; PubMed Central PMCID: PMCPMC1151223. [DOI] [PMC free article] [PubMed] [Google Scholar]
- [57].Petrovic V, Buzadzic B, Korac A, et al. Antioxidative defense and mitochondrial thermogenic response in brown adipose tissue. Genes Nutr. 2010. September;5(3):225–235. PubMed PMID: 20012899; PubMed Central PMCID: PMCPMC2935534. [DOI] [PMC free article] [PubMed] [Google Scholar]
- [58].Cypess AM, Weiner LS, Roberts-Toler C, et al. Activation of human brown adipose tissue by a beta3-adrenergic receptor agonist. Cell Metab. 2015. January 6;21(1):33–38. PubMed PMID: 25565203; PubMed Central PMCID: PMCPMC4298351. [DOI] [PMC free article] [PubMed] [Google Scholar]
- [59].Mizushima N, Yamamoto A, Matsui M, et al. In vivo analysis of autophagy in response to nutrient starvation using transgenic mice expressing a fluorescent autophagosome marker. Mol Biol Cell. 2004. March;15(3):1101–1111. PubMed PMID: 14699058; PubMed Central PMCID: PMCPMC363084. [DOI] [PMC free article] [PubMed] [Google Scholar]
- [60].Hara T, Nakamura K, Matsui M, et al. Suppression of basal autophagy in neural cells causes neurodegenerative disease in mice. Nature. 2006. June 15;441(7095):885–889. PubMed PMID: 16625204. [DOI] [PubMed] [Google Scholar]
- [61].Rehnmark S, Kopecky J, Jacobsson A, et al. Brown adipocytes differentiated in vitro can express the gene for the uncoupling protein thermogenin: effects of hypothyroidism and norepinephrine. Exp Cell Res. 1989. May;182(1):75–83. PubMed PMID: 2497023. [DOI] [PubMed] [Google Scholar]
- [62].Klein J, Fasshauer M, Ito M, et al. beta(3)-adrenergic stimulation differentially inhibits insulin signaling and decreases insulin-induced glucose uptake in brown adipocytes. J Biol Chem. 1999. December 3;274(49):34795–34802. PubMed PMID: 10574950. [DOI] [PubMed] [Google Scholar]
- [63].Wu Y, Smas CM. Expression and regulation of transcript for the novel transmembrane protein Tmem182 in the adipocyte and muscle lineage. BMC Res Notes. 2008. September 19;1:85 PubMed PMID: 18803820; PubMed Central PMCID: PMCPMC2564950. [DOI] [PMC free article] [PubMed] [Google Scholar]
- [64].Muoio DM, Noland RC, Kovalik JP, et al. Muscle-specific deletion of carnitine acetyltransferase compromises glucose tolerance and metabolic flexibility. Cell Metab. 2012. May 2;15(5):764–777. PubMed PMID: 22560225; PubMed Central PMCID: PMCPMC3348515. [DOI] [PMC free article] [PubMed] [Google Scholar]
- [65].Newgard CB, An J, Bain JR, et al. A branched-chain amino acid-related metabolic signature that differentiates obese and lean humans and contributes to insulin resistance. Cell Metab. 2009. April;9(4):311–326. PubMed PMID: 19356713; PubMed Central PMCID: PMCPMC3640280. [DOI] [PMC free article] [PubMed] [Google Scholar]
- [66].Sinha RA, Farah BL, Singh BK, et al. Caffeine stimulates hepatic lipid metabolism by the autophagy-lysosomal pathway in mice. Hepatology. 2014. April;59(4):1366–1380. PubMed PMID: 23929677. [DOI] [PubMed] [Google Scholar]
Associated Data
This section collects any data citations, data availability statements, or supplementary materials included in this article.