Abstract
Study Objectives:
Adenotonsillar hypertrophy is the major cause of obstructive sleep apnea (OSA) in prepubertal children, but children without enlarged lymphoid tissues may still suffer from OSA. This study aimed to identify other potential anatomic features associated with childhood OSA.
Methods:
This prospective study took place between January 2010 and April 2014. Prepubertal children suspected to have OSA, aged 6 to 11 years, were recruited. They underwent anthropometric measurements, nocturnal polysomnography, tonsil size evaluation, x-ray cephalometry, and sonographic measurement of lateral parapharyngeal wall (LPW) thickness. Linear regression analyses were used to test for the association between anatomic measurements and OSA severity. Logistic regression analyses were used to identify potential anatomic markers for different cutoffs (obstructive apneahypopnea index (OAHI) ≥ 1 and ≥ 5 events/h) for OSA.
Results:
Forty-seven children with OSA (20 with moderate to severe disease) and 43 children for the control group were recruited. Sonographic measurement of LPW thickness and position of hyoid bone taken from x-ray cephalometry were risk factors associated with OSA. Linear regression analyses found that these two phenotypes were associated with OAHI. Multivariate models adjusted for age, sex, body mass index, z score, and tonsil size revealed that lower position of hyoid bone was independently associated with higher risk for OSA, whereas both lower position of hyoid bone and greater LPW thickness were associated with higher OAHI and also a higher risk for moderate to severe OSA.
Conclusions:
Position of hyoid bone and LPW thickness are anatomical markers of childhood OSA independent of obesity and tonsil size. Screening tools may include cephalometry and sonographic measurement of LPW to allow better delineation of OSA risk.
Citation:
Au CT, Chan KC, Liu KH, Chu WC, Wing YK, Li AM. Potential anatomic markers of obstructive sleep apnea in prepubertal children. J Clin Sleep Med. 2018;14(12):1979–1986.
Keywords: cephalometry, obstructive sleep apnea, pediatrics, pharynx, ultrasonography
BRIEF SUMMARY
Current Knowledge/Study Rationale: The current gold standard diagnostic test of childhood obstructive sleep apnea (OSA) remains overnight polysomnography, which is labor intensive and may not be available in all pediatric units. Tools are being developed to provide reliable screening for children at risk of OSA. This study aimed to examine anatomic factors other than enlarged lymphoid tissues as predictors for OSA.
Study Impact: Position of the hyoid bone and lateral parapharyngeal wall thickness are associated with risk and severity of OSA in prepubertal children. Future screening tools should include these two readily obtainable markers.
INTRODUCTION
Structural narrowing of the upper airway during sleep that cannot be completely compensated by action of the pharyngeal dilator muscles results in obstructive sleep apnea (OSA).1 Adenotonsillar hypertrophy is one of the major causes of childhood OSA.2 Data from community-based epidemiologic study demonstrated that adenotonsillar hypertrophy, together with male sex and obesity, are independent risk factors for childhood OSA in a multivariate model.3 Adenotonsillectomy is considered as the first-line treatment for childhood OSA. Studies suggested that OSA severity reduces significantly after adenotonsillectomy,4–6 even in children with obesity.7–9 However, these studies also demonstrated that the surgical procedure alone could not offer complete cure of OSA in children. A substantial proportion of children were found to have residual OSA after the surgical intervention. A recent meta-analysis revealed that the success rate (defined as a postoperative apnea-hypopnea index < 1 event/h) of adenotonsillectomy for children with and without obesity are 49% and 34%, respectively.4 Therefore, it is very likely that there are other factors substantially contributing to the severity of childhood OSA, even in children without obesity.
Upper airway structures, including bony and soft-tissue components apparently play a very important role in the pathogenesis of OSA. A detailed upper airway imaging should provide more accurate information on where the obstruction sites are; this is important for selecting the most suitable treatment for individual patient. For an epidemiologic point of view, upper airway imaging can also be a tool for identification of anatomic risk factors in a study population, which in turn can help screen for children with significant OSA for earlier treatment, and in addition exclude those who are disease free.
Lateral parapharyngeal wall (LPW) thickness reflects the size of soft-tissue structures, namely muscles, lymphoid tissue, and fat in the LPW. It can be accurately measured by magnetic resonance imaging (MRI) of the upper airway. Sonographic measurement may be less accurate, but the procedure is technically less demanding and more cost effective. Furthermore, ultrasound-measured LPW thickness is shown to highly correlate (r = .78, P = .001) with measurements obtained from MRI.10 The measurement has also been shown to be significantly associated with OSA severity in adults.10 However, such association has not been investigated in the pediatric population.
This study aimed to identify potential anatomic factors associated with severity of OSA. X-ray cephalometry and sonographic measurement of LPW, together with tonsil size evaluation and anthropometric measurements, were used to explore the anatomic risk factors in a group of prepubertal children suspected to have OSA, while controlling for the effects of tonsil and body size.
METHODS
Participants
This was a prospective study that took place between January 2010 and April 2014. Prepubertal children aged between 6 and 11 years who attended our pediatric chest and sleep disorder clinic with symptoms suggestive of OSA were invited to participate. The exclusion criteria included previous surgical treatment for OSA, presence of genetic syndrome, congenital or acquired neuromuscular disease, obesity secondary to an underlying cause, and craniofacial abnormalities. Written consent and verbal ascent were obtained from the parents and children/ adolescents, respectively. This study was approved by the Joint Chinese University of Hong Kong – New Territories East Cluster Clinical Research Ethics Committee (CREC-2008.438).
Study Design
All participants underwent evaluation of clinical profile including completion of demographic and OSA symptoms questionnaire, anthropometric measurements, nocturnal attended polysomnography (PSG), tonsil size evaluation, x-ray cephalometry, and sonographic measurement of LPW thickness. On the day of PSG, the body build of the participant was measured using standard procedures. Waist and hip circumferences (in centimeters) were obtained.11 Neck circumference was measured at the level of the most prominent portion of the thyroid cartilage with the head held erect and the eyes facing forward. Body mass index (BMI) and waist circumference were converted into z score using local reference.11,12
Polysomnography
A model Siesta ProFusion III PSG monitor (Compumedics Telemed, Abbotsford, Victoria, Australia) was used to record the following parameters: electroencephalogram (F4/A1, C4/ A1, O2/A1), bilateral electrooculogram, electromyogram of mentalis activity, and bilateral anterior tibialis. Respiratory movements of the chest and abdomen were measured by inductance plethysmography. Electrocardiogram and heart rate were continuously recorded from two anterior chest leads. Arterial oxyhemoglobin saturation (SaO2) was measured by an oximeter (Ohmeda Biox 3900 Pulse Oximeter, Datex, Clearwater, Florida, United States) with finger probe. Respiratory airflow pressure signal was measured via a nasal catheter placed at the anterior nares and connected to a pressure transducer. An oro-nasal thermal sensor was used to detect the presence of airflow. Snoring was measured by a microphone placed near the throat. Body position was monitored via a body position sensor. An adequate overnight PSG was defined as recorded total sleep time of more than 6 hours.
Respiratory events including obstructive apneas, mixed apneas, and central apneas and hypopneas were scored based on the recommendation from The AASM Manual for the Scoring of Sleep and Associated Events: Rules, Terminology and Technical Specifications, Version 2.0.13 Arousal was defined as an abrupt shift in electroencephalogram frequency during sleep, which may include theta, alpha, and/or frequencies greater than 16 Hz but not spindles, with 3 to 15 seconds in duration. In rapid eye movement sleep, arousals were scored only when accompanied by concurrent increase in submental electromyogram amplitude.
Obstructive apnea-hypopnea index (OAHI) was defined as the total number of obstructive and mixed apneas and hypopneas per hour of sleep. Oxygen desaturation index was defined as the total number of dips in arterial oxygen saturation ≥ 3% per hour of sleep. Arousal index (ArI) was the total number of arousals per hour of sleep.
Participants with an OAHI of < 1 event/h were defined as having no OSA, whereas those with an OAHI between 1 and 5 events/h and > 5 events/h were defined as having mild and moderate to severe OSA, respectively.
Tonsil Size Evaluation
Tonsil sizes were examined using the Brodsky grading scale, which has been demonstrated to be reproducible in our pediatric population.14 The Brodsky grading scale comprised the following 5 grades: grade 0 (tonsils within the tonsillar fossa), grade 1 (tonsils just outside of the tonsillar fossa and occupy ≤ 25% of the oropharyngeal width), grade 2 (tonsils occupy 26% to 50% of the oropharyngeal width), grade 3 (tonsils occupy 51% to 75% of the oropharyngeal width), and grade 4 (tonsils occupy > 75% of the oropharyngeal width).
X-Ray Cephalometry
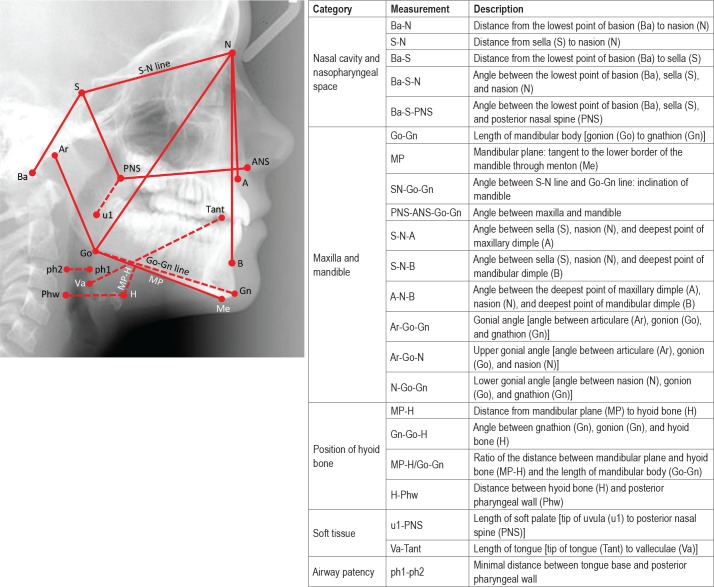
The craniofacial bone characteristics of each individual were determined by cephalometry. A lateral maxillofacial radio-graph was taken during wakefulness. All radiographic examination was performed with computed radiography equipment (Mobilett Plus, Siemens, Erlangen, Germany) using standardized protocol (82–84 kvp, 10–20 mAs, 150-cm film-focus distance). The cephalometric measurements15 (Figure 1) were performed using a picture archiving and communication system viewer with a 2048 × 2048 pixel monitor (Magicview version VA22E, Siemens). All the measurements were performed by the same research personnel.
Figure 1. Definitions of various cephalometric measurements.
Sonographic Measurement of LPW Thickness
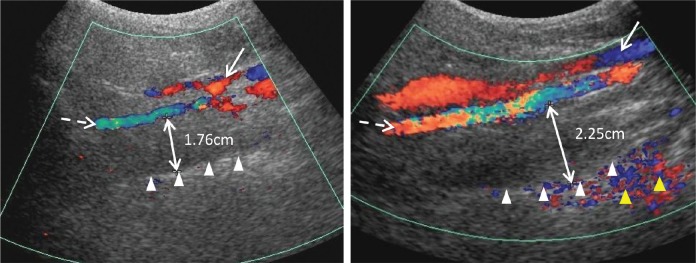
All participants underwent ultrasonographic measurement of the LPW thickness during wakefulness on the day of PSG. An ATL HDL5000 (Bothell, California, United States) with C5-2 or C7-5 MHz curvilinear transducer was used. All measurements were made by the same operator (LKH), who was blinded to other assessment data of the participants. The participants were positioned supine on the examination couch, and their neck slightly extended supported by a 35° soft pad with the infraorbital meatal baseline (the line joining infra-orbital margin and ear tragus) perpendicular to the scanning table. The oblique coronal plane of the parapharyngeal space was scanned with the transducer longitudinally placed on the lateral side of the neck, just underneath the lateral border of the occipital bone. The long axis of the ipsilateral internal carotid artery was identified with color application. The lateral wall of the pharynx appeared as an echogenic line on real-time ultrasonography, whereas the lumen of the pharynx was completely obscured by gas shadowing. Vibration artifacts occasionally occurred when the participants swallowed, which also helped to confirm location of the pharynx. The distance between the internal carotid artery and the echogenic surface of the pharynx represented the LPW thickness in an oblique coronal plane. The airway distension was viewed dynamically with grayscale real-time ultrasonography. All measurements were recorded on frozen images when the lateral wall of the pharynx moved farthest away from the transducer (ie, presumably the airway decreased to its smallest caliber) (Figure 2). The maximum thickness of LPW on both sides was measured three times on three separate images, and the mean value was obtained for analysis. Values on both sides of the neck were summed to determine the total LPW thickness measured by ultrasonography. This measurement reflects the size of soft-tissue structures in the LPW, which consists of various muscles and lymphatic tissues. Increase in LPW might exert compressive force to the airway leading to airway narrowing.16
Figure 2. Sonographic measurement of lateral parapharyngeal wall thickness.
The solid line and dashed line arrows indicate the internal jugular vein and the internal carotid artery visualized by Doppler imaging, respectively. The lateral wall of pharynx is represented by the echogenic interface (white triangles). The double-headed arrow indicates the distance between the internal carotid artery and the echogenic surface of pharynx, representing the thickness of lateral parapharyngeal wall. The yellow triangles indicate the color vibration artefacts caused by the motion of the lateral wall of pharynx.
Statistical Analysis
Comparisons between groups were tested by one-way analysis of variance or t tests for parametric data, or chi-square tests for categorical data. Logistic regression analyses examined the associations between cephalometric and sonographic parameters and the presence of OSA or moderate to severe OSA, while controlling for age, sex, BMI z score/neck circumference and tonsil size. Linear regression analyses were used to assess the associations between cephalometric and sonographic parameters and OAHI, while adjusting for age, sex, BMI z score/neck circumference and tonsil size. Since BMI z score and neck circumference were highly correlated (r = .77), they were not included in the same regression model to avoid the violation of the multicollinearity assumption. All continuous variables were standardized by subtracting the sample mean value and dividing by the standard deviation (SD) before regression analyses. OAHI was natural log-transformed (ln [OAHI + 1]) for normality. All the analyses were performed using the statistical software packages SPSS (version 20.0 for Windows; SPSS Inc., Chicago, Illinois, United States).
RESULTS
Participant Characteristics
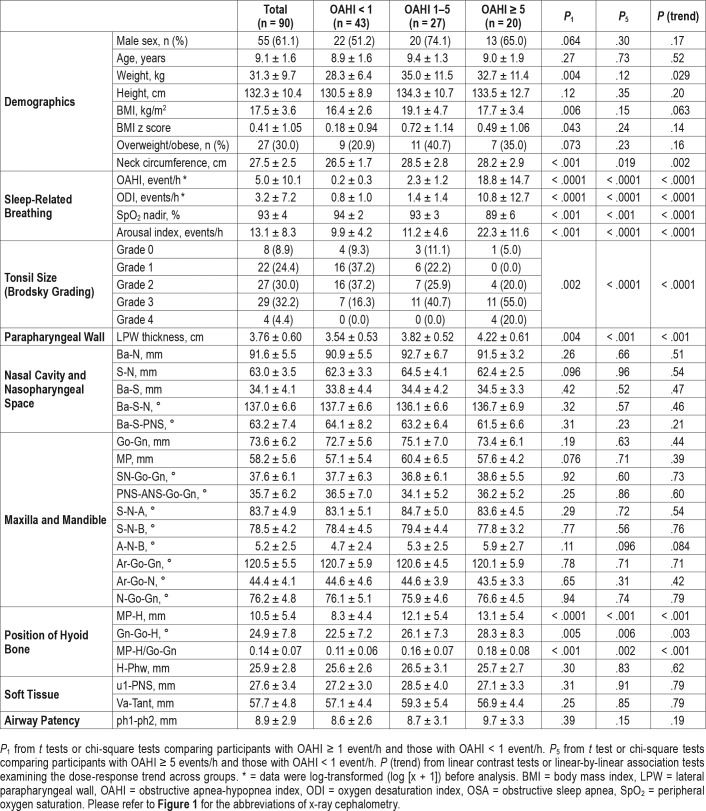
A total of 90 prepuberal children (55 boys) with a mean ± SD age of 9.1 ± 1.6 years were recruited. Forty-seven participants were confirmed to have OSA (OAHI ≥ 1 event/h), of which 27 and 20 had mild (OAHI 1–5 events/h) and moderate to severe OSA (OAHI ≥ 5 events/h), respectively. The participants with OSA had a slightly greater proportion of males than the non-OSA group, but the difference was not statistically signifi-cant. They also had significantly higher BMI z score, greater neck circumference, and larger tonsils than the non-OSA group (Table 1).
Table 1.
Comparisons between groups of different OSA severities.
X-Ray Cephalometry
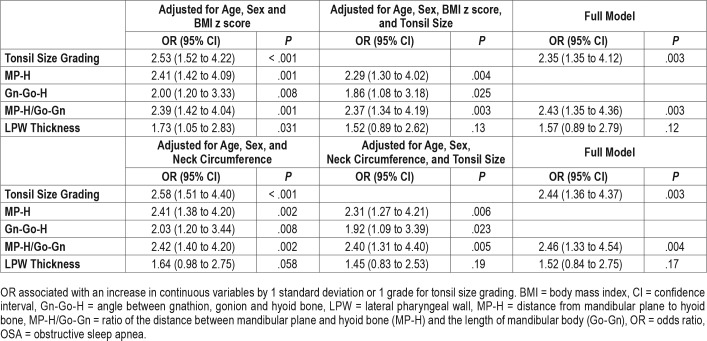
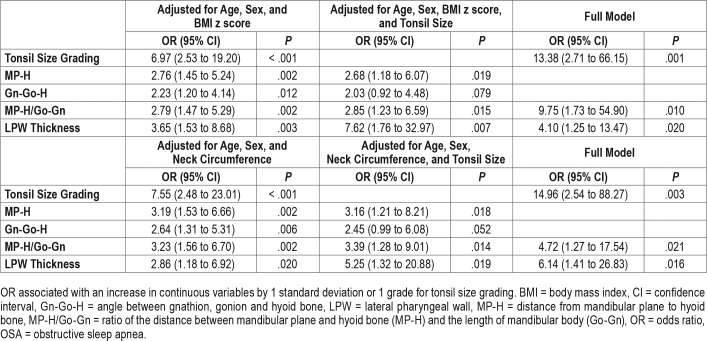
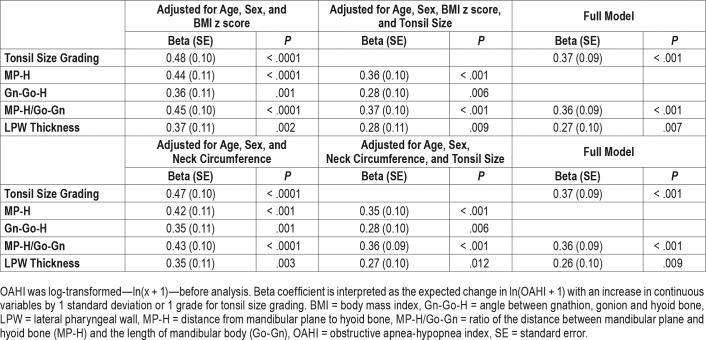
Dose-response relationships were observed between OSA severity and measurements of hyoid bone position including distance from mandibular plane to hyoid bone (MP-H) (8.3 mm ± 4.4, 12.1 mm ± 5.4 and 13.1 mm ± 5.4 for non-OSA, mild OSA and moderate-to-severe OSA groups, respectively, P for trend < .001), Gn-Go-H angle (angle between intersection of inferior margin of mandible and posterior margin of mandibular ramus [Go], the most anterior and inferior point on the mandibular symphysis [Gn], and the most anterior and superior point of hyoid bone [H]) (22.5° ± 7.2, 26.1° ± 7.3 and 28.3° ± 8.3, respectively, P for trend = .003) and MP-H/Go-Gn ratio (0.11 ± 0.06, 0.16 ± 0.07 and 0.18 ± 0.08, respectively, P for trend < .001) (Table 1). Logistic regression analysis found that the presence of OSA was associated with greater MP-H, Gn-Go-H, and MP-H/Go-Gn ratio, translating to a lower hyoid bone position, even after adjusting for age, sex, BMI z score / neck circumference, and tonsil size (Table 2). The marker of lower hyoid bone position was also associated with the presence of moderate to severe OSA in the fully adjusted models (Table 3). Linear regression analysis also revealed that log-transformed OAHI was positively associated with MP-H/Go-Gn ratio in the fully adjusted model (Table 4). Similar results were obtained from BMI z score-adjusted and neck circumference-adjusted models (Table 2, Table 3, and Table 4).
Table 2.
Correlates with presence of OSA (n = 90).
Table 3.
Correlates with presence of moderate to severe OSA (n = 63).
Table 4.
Correlates with OAHI (n = 90).
Sonographic Measurements of LPW Thickness
Dose-response relationships between OSA severity and LPW thickness were clearly demonstrated (3.54 cm ± 0.53, 3.82 cm ± 0.52 and 4.22 cm ± 0.61 for non-OSA, mild OSA, and moderate to severe OSA groups, respectively, P for trend < .001) (Table 1). Logistic regression analysis showed that LPW thickness was associated with the presence of OSA when adjusted for age, sex, and BMI z score. But when the model was adjusted for neck circumference or when it was further adjusted for tonsil size and marker of hyoid bone position, the association became insignificant (Table 2). However, LPW thickness was significantly associated with the presence of moderate to severe OSA in the fully adjusted model (Table 3). Linear regression analysis also revealed that LPW thickness was positively associated with log-transformed OAHI in fully adjusted models (Table 4).
DISCUSSION
The main finding of this study was that greater LPW thickness measured by ultrasonography and lower position of hyoid bone obtained from x-ray cephalometry were significantly associated with presence and severity of OSA independent of BMI z score, neck circumference, and tonsil size in prepubertal children suspected to have the condition.
Significant association between LPW thickness and severity of OSA in children is a novel finding in this study. A similar positive association has been demonstrated in adults with OSA.10 LPW thickness reflects the total size of soft-tissue structures within the region which include muscles, lymphoid tissue, and fat. Although ultrasonography does not provide sufficient resolution to dissect the composition within LPW, sonographic measurement of LPW thickness is technically less demanding and more cost effective than MRI. The procedure can be completed within 15 minutes, and more importantly the measurements are highly correlated with those obtained from MRI.10 It is believed that increase in LPW thickness generates a compressive force to the upper airway predominantly in the lateral dimensions, resulting in airway narrowing and thus increases the risk for OSA. This is supported by a MRI study in adults with OSA demonstrating airway narrowing was predominantly in the lateral dimensions, and not in the anterior-posterior position. The study further revealed that the narrowing in the lateral dimensions was attributed mainly to the thicker LPW in participants with OSA, instead of the enlargement of the parapharyngeal fat pads.16 Similar evidence in children is rather limited. A previous study investigated a group of children and adolescents with obesity who were age 8 to 17 years and showed that the size of parapharyngeal fat pads was significantly increased in the OSA group, but it was not significantly correlated with the severity of OSA.17 A more recent study on obese adolescents age 13 to 16 years found that OSA severity was significantly correlated with lateral wall volume but not fat deposition within the tongue or the parapharyngeal wall soft tissues,18 supporting LPW thickness as a better predictor of childhood OSA.
A lower hyoid bone position was found to be another independent marker of OSA in this study. The same finding has been reported by other research groups.15,19–23 A MRI study found that the association between hyoid bone position and childhood OSA became insignificant when controlling for the effect of tongue volume, which was highly correlated with both OAHI and the position of the hyoid bone. The authors proposed that tongue enlargement was the cause of the lower hyoid position in children with OSA.24 Previous studies also reported other cephalometric features that were associated with childhood OSA including small mandible,19,24 mandible repositioning,25 increased anterior facial height,21,25 and small nasopharyngeal space resulting from enlarged adenoids.19,24 However, none of these studies were carried out in the Asian population. A recent study on Chinese children also demonstrated that only the hyoid bone position and none of the other cephalometric characteristics was associated with OSA severity,22 suggesting that there are likely ethnic differences in cephalometric parameters predisposing to OSA.
One limitation of this study was that participants with and without OSA were not matched for body size. Participants with OSA had a greater BMI z score than those without OSA. However, correlation analyses revealed that BMI z score was not significantly associated with LPW thickness and measurement of hyoid bone position. Moreover, the possible confounding effect of BMI z score has been adjusted for in all multivariate models. Another observation was that BMI z score was not linearly associated with OSA severity. The mild OSA group, but not the moderate to severe group, had the highest BMI z score, whereas there were dose-response relationships between OSA severity and LPW thickness and measurements of hyoid bone position. This supported that these anatomic measurements were truly associated with OSA severity but not degree of obesity. Another limitation was that capnography was not performed during overnight PSG. Therefore, we were not able to examine the association between the anatomic measurements and CO2 level during sleep. It should also be noted that all the tested participants were referred cases with symptoms suggestive of OSA. The findings may not be applicable to the general population.
The results of this study have implications for future research. The potential anatomic markers of OSA identified in this study may be combined with other risk factors and/or symptoms of OSA to develop algorithms to estimate the probability of having OSA or even the severity of disease without conducting overnight PSG. In addition, the markers may help predict treatment response to OSA intervention, or select patients who will benefit most from the currently recommended first-line treatment, namely adenotonsillectomy. It will also be interesting to investigate how these anatomic factors contribute to OSA severity and possibly interact with other anatomic deficits seen in high-risk populations, such as children with Down syndrome or craniofacial abnormalities.
CONCLUSIONS
Based on the findings from simple upper airway imaging tools including x-ray cephalometry and ultrasonography, LPW thickness and hyoid bone position were identified to be significantly associated with OSA in prepubertal children, independent of tonsil size and obesity. This suggested that these upper airway imaging tools may provide extra useful information about the risk for OSA and potentially be used as a screening tool to identify children with higher risk for OSA and allow earlier treatment for those who are at highest risk for more severe disease.
DISCLOSURE STATEMENT
Work for this study was performed at The Chinese University of Hong Kong. This work was supported by the Research Grants Council of the Hong Kong Special Administrative Region, China [CUHK471210]. The authors report no conflicts of interest.
ABBREVIATIONS
- ArI
arousal index
- BMI
body mass index
- Gn-Go-H
angle between intersection of inferior margin of mandible and posterior margin of mandibular ramus (Go), the most anterior and inferior point on the mandibular symphysis (Gn), and the most anterior and superior point of hyoid bone (H)
- Go-Gn
length of mandibular body
- LPW
lateral parapharyngeal wall
- MP-H
distance from mandibular plane to hyoid bone
- MP-H/Go-Gn
position of hyoid bone: ratio of the distance between mandibular plane and hyoid bone and the length of mandibular body
- MRI
magnetic resonance imaging
- OAHI
obstructive apnea-hypopnea index
- OSA
obstructive sleep apnea
- PSG
polysomnography
REFERENCES
- 1.Eckert DJ. Phenotypic approaches to obstructive sleep apnoea - new pathways for targeted therapy. Sleep Med Rev. 2018;37:45–59. doi: 10.1016/j.smrv.2016.12.003. [DOI] [PubMed] [Google Scholar]
- 2.Marcus CL, Brooks LJ, Ward SD, et al. Diagnosis and management of childhood obstructive sleep apnea syndrome. Pediatrics. 2012;130(3):e714–e755. doi: 10.1542/peds.2012-1672. [DOI] [PubMed] [Google Scholar]
- 3.Li AM, So HK, Au CT, et al. Epidemiology of obstructive sleep apnoea syndrome in Chinese children: a two-phase community study. Thorax. 2010;65(11):991–997. doi: 10.1136/thx.2010.134858. [DOI] [PubMed] [Google Scholar]
- 4.Lee CH, Hsu WC, Chang WH, Lin MT, Kang KT. Polysomnographic findings after adenotonsillectomy for obstructive sleep apnoea in obese and non-obese children: a systematic review and meta-analysis. Clin Otolaryngol. 2016;41(5):498–510. doi: 10.1111/coa.12549. [DOI] [PubMed] [Google Scholar]
- 5.Huang YS, Guilleminault C, Lee LA, Lin CH, Hwang FM. Treatment outcomes of adenotonsillectomy for children with obstructive sleep apnea: a prospective longitudinal study. Sleep. 2014;37(1):71–76. doi: 10.5665/sleep.3310. [DOI] [PMC free article] [PubMed] [Google Scholar]
- 6.Bhattacharjee R, Kheirandish-Gozal L, Spruyt K, et al. Adenotonsillectomy outcomes in treatment of obstructive sleep apnea in children. Am J Respir Crit Care Med. 2010;182(5):676–683. doi: 10.1164/rccm.200912-1930OC. [DOI] [PubMed] [Google Scholar]
- 7.Alonso-Álvarez ML, Terán-Santos J, Navazo-Egüia AI, et al. Treatment outcomes of obstructive sleep apnoea in obese community-dwelling children: the NANOS study. Eur Respir J. 2015;46(3):717–727. doi: 10.1183/09031936.00013815. [DOI] [PubMed] [Google Scholar]
- 8.Koren D, Gozal D, Bhattacharjee R, Philby MF, Kheirandish-Gozal L. Impact of adenotonsillectomy on insulin resistance and lipoprotein profile in nonobese and obese children. Chest. 2016;149(4):999–1010. doi: 10.1378/chest.15-1543. [DOI] [PMC free article] [PubMed] [Google Scholar]
- 9.Nandalike K, Shifteh K, Sin S, et al. Adenotonsillectomy in obese children with obstructive sleep apnea syndrome: magnetic resonance imaging findings and considerations. Sleep. 2013;36(6):841–847. doi: 10.5665/sleep.2708. [DOI] [PMC free article] [PubMed] [Google Scholar]
- 10.Liu KH, Chu WC, To KW, et al. Sonographic measurement of lateral parapharyngeal wall thickness in patients with obstructive sleep apnea. Sleep. 2007;30(11):1503–1508. doi: 10.1093/sleep/30.11.1503. [DOI] [PMC free article] [PubMed] [Google Scholar]
- 11.Sung RY, So HK, Choi KC, et al. Waist circumference and waist-to-height ratio of Hong Kong Chinese children. BMC Public Health. 2008;8:324. doi: 10.1186/1471-2458-8-324. [DOI] [PMC free article] [PubMed] [Google Scholar]
- 12.Leung SS, Cole TJ, Tse LY, Lau JT. Body mass index reference curves for Chinese children. Ann Hum Biol. 1998;25(2):169–174. doi: 10.1080/03014469800005542. [DOI] [PubMed] [Google Scholar]
- 13.Berry RB, Brooks R, Gamaldo CE, et al. for the American Academy of Sleep Medicine. The AASM Manual for the Scoring of Sleep and Associated Events: Rules, Terminology and Technical Specifications. Darien, IL: American Academy of Sleep Medicine; 2012. Version 2.0. [Google Scholar]
- 14.Ng SK, Lee DL, Li AM, Wing YK, Tong MC. Reproducibility of clinical grading of tonsillar size. Arch Otolaryngol Neck Surg. 2010;136(2):159–162. doi: 10.1001/archoto.2009.170. [DOI] [PubMed] [Google Scholar]
- 15.Ozdemir H, Altin R, Söğüt A, et al. Craniofacial differences according to AHI scores of children with obstructive sleep apnoea syndrome: cephalometric study in 39 patients. Pediatr Radiol. 2004;34(5):393–399. doi: 10.1007/s00247-004-1168-x. [DOI] [PubMed] [Google Scholar]
- 16.Schwab RJ, Gupta KB, Gefter WB, Metzger LJ, Hoffman EA, Pack AI. Upper airway and soft tissue anatomy in normal subjects and patients with sleep-disordered breathing. Significance of the lateral pharyngeal walls. Am J Respir Crit Care Med. 1995;152(5 Pt 1):1673–1689. doi: 10.1164/ajrccm.152.5.7582313. [DOI] [PubMed] [Google Scholar]
- 17.Arens R, Sin S, Nandalike K, et al. Upper airway structure and body fat composition in obese children with obstructive sleep apnea syndrome. Am J Respir Crit Care Med. 2011;183(6):782–787. doi: 10.1164/rccm.201008-1249OC. [DOI] [PMC free article] [PubMed] [Google Scholar]
- 18.Schwab RJ, Kim C, Bagchi S, et al. Understanding the anatomic basis for obstructive sleep apnea syndrome in adolescents. Am J Respir Crit Care Med. 2015;191(11):1295–1309. doi: 10.1164/rccm.201501-0169OC. [DOI] [PMC free article] [PubMed] [Google Scholar]
- 19.Kulnis R, Nelson S, Strohl K, Hans M. Cephalometric assessment of snoring and nonsnoring children. Chest. 2000;118(3):596–603. doi: 10.1378/chest.118.3.596. [DOI] [PubMed] [Google Scholar]
- 20.Pirilä-Parkkinen K, Löppönen H, Nieminen P, Tolonen U, Pirttiniemi P. Cephalometric evaluation of children with nocturnal sleep-disordered breathing. Eur J Orthod. 2010;32(6):662–671. doi: 10.1093/ejo/cjp162. [DOI] [PubMed] [Google Scholar]
- 21.Vieira BB, Itikawa CE, de Almeida LA, et al. Cephalometric evaluation of facial pattern and hyoid bone position in children with obstructive sleep apnea syndrome. Int J Pediatr Otorhinolaryngol. 2011;75(3):383–386. doi: 10.1016/j.ijporl.2010.12.010. [DOI] [PubMed] [Google Scholar]
- 22.Ping-Ying Chiang R, Lin CM, Powell N, Chiang YC, Tsai YJ. Systematic analysis of cephalometry in obstructive sleep apnea in Asian children. Laryngoscope. 2012;122(8):1867–1872. doi: 10.1002/lary.23297. [DOI] [PubMed] [Google Scholar]
- 23.Vieira BB, Itikawa CE, de Almeida LA, et al. Facial features and hyoid bone position in preschool children with obstructive sleep apnea syndrome. Eur Arch Otorhinolaryngol. 2014;271(5):1305–1309. doi: 10.1007/s00405-013-2770-z. [DOI] [PubMed] [Google Scholar]
- 24.Chi L, Comyn FL, Mitra N, et al. Identification of craniofacial risk factors for obstructive sleep apnoea using three-dimensional MRI. Eur Respir J. 2011;38(2):348–358. doi: 10.1183/09031936.00119210. [DOI] [PMC free article] [PubMed] [Google Scholar]
- 25.Zucconi M, Caprioglio A, Calori G, et al. Craniofacial modifications in children with habitual snoring and obstructive sleep apnoea: a case-control study. Eur Respir J. 1999;13(2):411–417. doi: 10.1183/09031936.99.13241199. [DOI] [PubMed] [Google Scholar]


