

Abstract
Neuromodulatory systems exert profound influences on brain function. Understanding how these systems modify the operating mode of target circuits requires measuring spatiotemporally precise neuromodulator release. We developed dLight1, an intensity-based genetically encoded dopamine indicator, to enable optical recording of dopamine dynamics with high spatiotemporal resolution in behaving mice. We demonstrated the utility of dLight1 by imaging dopamine dynamics simultaneously with pharmacological manipulation, electrophysiological or optogenetic stimulation, and calcium imaging of local neuronal activity. dLight1 enabled chronic tracking of learning-induced changes in millisecond dopamine transients in striatum. Further, we used dLight1 to image spatially distinct, functionally heterogeneous dopamine transients relevant to learning and motor control in cortex. We also validated our sensor design platform for developing norepinephrine, serotonin, melatonin, and opioid neuropeptide indicators.
Animal behavior is influenced by the release of neuromodulators, such as dopamine (DA), which signal behavioral variables that are relevant to the functioning of circuits brainwide. Projections from dopaminergic nuclei to the striatum and cortex, for example, play important roles in reinforcement learning, decision-making and motor control. Loss of DA or dysfunction of its target circuits has been linked to disorders such as Parkinson’s disease, schizophrenia, and addiction (1–3).
Much work has been devoted to determining how neural representations of behavioral states are encoded in the firing patterns of neuromodulatory neurons (4–9), but very little is known about how the precise release of neuromodulators alters the function of their target circuits (10, 11). To address this problem, one essential step is to monitor the spatiotemporal dynamics of neuromodulatory signals in target circuits, while also measuring and manipulating the elements of the circuit during behavior.
Analytical techniques such as microdialysis and electrochemical micro-sensors, have provided useful insights about neuromodulator presence (12, 13), but suffer from poor spatial and/or temporal resolution, and cannot be targeted to cells of interest. Optical approaches, such as injected cell-based systems (CNiFERs) (14) and reporter gene-based iTango (15) can reveal dopamine release with high molecular specificity. However, these systems are limited by poor temporal resolution (seconds to hours), preventing direct detection of DA release events that occur on a sub-second time scale (16, 17).
High-quality single fluorescence protein (FP)-based sensors that report calcium or glutamate transients with subsecond temporal resolution have recently been developed and are widely used (18, 19). Here we report the development of a set of single-FP-based dopamine sensors, named dLight1, that enables imaging of DA transients with high spatiotemporal resolution in behaving animals.
Sensor engineering
Sensitive optical readout of changes in DA concentration was achieved by directly coupling the DA-binding-induced conformational changes in human DA receptors to changes in the fluorescence intensity of circularly permuted (cp) GFP. We did this by replacing the third intracellular loop (IL3) of the human Dopamine D1 (DRD1), D2 (DRD2) and D4 receptors (DRD4) with a cpGFP module from GCaMP6 (Fig. 1A).
Fig. 1. Development of dLight1 and versatile applications to other neuromodulators.
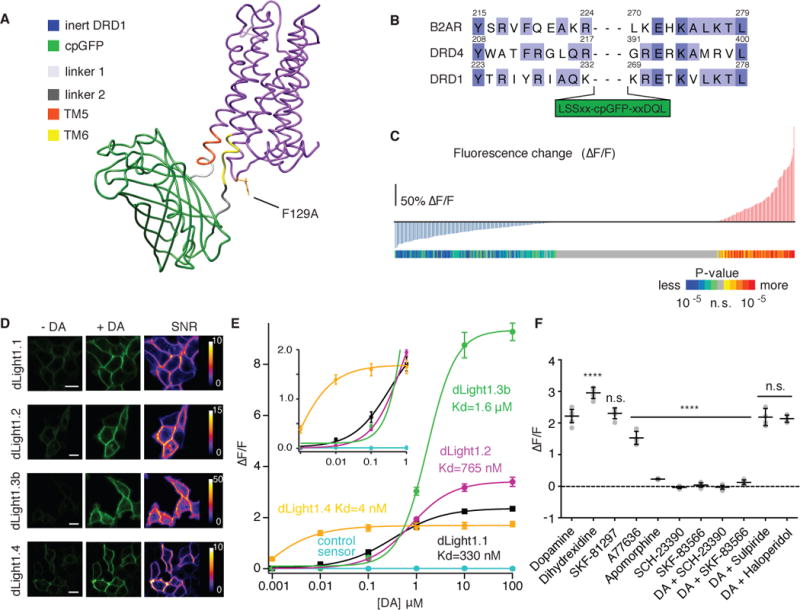
(A) Simulated structure of dLight1 consisting DRD1 and cpGFP module. (B) Sequence alignment of transmembrane (TM) domain 5 and 6 in β2AR, DRD1 and DRD4. Library design is shown. (C) Screening result of 585 linker variants. Fluorescence changes (ΔF/F) to 10 μM DA in vertical bar and significance values of ΔF/F in colored bar (n=3 trials, two-tailed t test). (D) Expression of dLight variants in HEK cells. Fluorescence intensity and signal-to-noise ratio of apo and sat state were shown. Scale bars: 10 μm. (E) In situ titration of DA on HEK cells. Data were fitted with the Hill Equation (n=5). (F) Pharmacological specificity of dLight1.1. DRD1 full agonist (Dihydrexidine, 295 ± 8% ΔF/F, n=5); DRD1 partial agonists (SKF81297, 230 ± 7.7%, n=5; A77636, 153 % 7.8%, n=7; Apomorphine, 22 ± 0.8%, n=6); DRD1 antagonists (SCH-23390 - 0.04 ± 0.01%; SKF-83566, 0.04 ± 0.03%); DRD2 antagonists (Sulpiride, 213 ± 5.1%, n=5; Haloperidol, 219 ± 11%, n=6). All data shown as mean ± SEM. ****p<0.0001, One-way ANOVA, Dunnett’s post-test.
To determine the insertion site of cpGFP in IL3 that produces maximal coupling of ligand-induced conformational changes to cpGFP fluorescence, we aligned the sequences of DRD1 and DRD4 with that of β2 adrenergic receptor (B2AR) (Fig. 1B), for which both active and inactive structure are available (20). The initial variant, obtained by inserting a cpGFP module (LSSLE-cpGFP-LPDQL) between K232 and K269 of DRD1, was well-expressed at the plasma membrane of human embryonic kidney (HEK293) cells and showed a fluorescence decrease (ΔF/Fmax= - 19.4 ± 0.02 %) in response to puffed DA (fig. S1A). To obtain a positive-response sensor, we screened a library of 585 variants in HEK cells (Fig. 1C and fig. S1B). The variant with the largest positive fluorescence response (max ΔF/Fmax= 230 ± 9 %) and excellent membrane localization was named dLight1.1 (Fig. 1D). In situ DA titration on HEK cells revealed sub-micromolar apparent affinity of dLight1.1 (330 ± 30 nM, Fig 1E).
We next sought to further tune the dynamic range and affinity of the sensor. Mutation of Phe129, a highly conserved residue among many GPCRs (21), into alanine (dLight1.2) slightly increased dynamic range (max ΔF/Fmax= 340 ± 20%, apparent affinity: 770 ± 10 nM, Fig. 1D and E). Optimizing the cpGFP insertion site in dLight1.1 and dLight1.2 (fig. S1C to G) greatly increased the dynamic range, but also reduced the affinity to micromolar range (dLight1.3a: ΔF/Fmax= 660 ± 30 %, apparent affinity: 2300 ± 20 nM, fig S2A and B; dLight1.3b: ΔF/Fmax= 930 ± 30 %, apparent affinity: 1680± 10 nM, Fig. 1D and E). Insertion of the cpGFP module into DRD4 and DRD2 respectively produced dLight1.4 and dLight1.5 respectively, which exhibited nanomolar affinity with a relatively small dynamic range (dLight 1.4: ΔF/Fmax= 170 ± 10 %, apparent affinity: 4.1 ± 0.2 nM, Fig. 1B, D and E; dLight1.5: ΔF/Fmax to DA= 180 ± 10 %, apparent affinity to DA: 110 ± 10 nM, and ΔF/Fmax to Quinpirole= 124 ± 19%, fig S2A to C). In addition, we engineered a control sensor by incorporating a D103A mutation in dLight1.1 to abolish DA binding (ΔF/F= 0.4 ± 4 %, Fig. 1E) (22). Because dLight1.1 and dLight1.2 produced large responses at low DA concentration (e.g.100 nM) without approaching response saturation (Fig. 1E inset) and had submicromolar affinity, we further characterized these two sensors.
Sensor characterization
These two sensors showed peak emissions at 516 nm and 920 nm for one- and two-photon illumination in HEK cells, respectively (fig. S3). In situ titration on dissociated hippocampal neurons showed similar apparent affinities to DA as on HEK293 cells (fig. S4A to C, Fig 1E). Single pulses (5ms) of uncaged dopamine were robustly detected on the dendrites of cultured neurons, and the fluorescence response tracked uncaging pulse duration (fig. S4D to F). In cultured hippocampal slices, dLight1 could reliably detect sub-micromolar DA concentration changes at dendrites and single dendritic spines (fig. S4G to I).
We then investigated the endogenous and pharmacological molecular specificity of the sensor. dLight1 was ~70 and ~40 times less sensitive to norepinephrine and epinephrine than to DA; negligible responses were observed to all other neuromodulators tested (fig. S5). The amplitude of the response to each pharmacological compound reflected the efficacy of drugs on the wild-type receptors, with the largest response to the full-agonist, dihydrexidine (ΔF/F= 300 ± 10%), followed by partial agonists (Fig. 1F). The response to DA was abolished in the presence of the DRD1 antagonists SKF-83566 and SCH-233990, but was unaffected by the DRD2 antagonists haloperidol and sulpiride (Fig. 1F).
To investigate the possible interference of sensor expression with G-protein signaling, we first measured the effect of sensor expression on the ligand-induced cyclic AMP (cAMP) response (fig. S6)(23). Transiently transfected dLight1.1 and dLight1.2 triggered no significant cAMP response in HEK cells, similar to the negative control (EGFP); whereas wild-type DRD1 did (**p<0.01; ***p<0.001, fig. S6A). The conversion of DRD1 to a fluorescent sensor thus apparently blocked the scaffold’s ability to bind G-protein and trigger the signaling cascade. When introduced into a cell line that endogenously expressed DRD1 (U2OS), dLight1 did not significantly alter the dose-response curve to DA (p=0.96, fig. S6B). dLight1 was also defective in agonist-induced internalization, a readout of DRD1 engagement of β-arrestin (24), when compared to wild type DRD1(**p<0.01, fig. S6C). Total internal reflectance fluorescence (TIRF) imaging verified that dLight1 remained diffusely distributed in the plasma membrane, without any detectable internalization, during a complete cycle of ligand-dependent fluorescence change (fig. S6 D–F). Taken together, these results indicate that the dLight sensors are suitable for use on the cell membrane without affecting endogenous signaling through G-proteins or engagement of β-arrestins.
Versatile application to other neuromodulators
We next applied the design strategy of dLight1 to modularly develop a class of intensity-based sensors for various neuromodulators and neuropeptides. We selected a subset of GPCRs, including Gs-coupled β1 and β2 adrenergic receptors (B1AR and B2AR); Gi-coupled k and μ-type opioid receptors (KOR, MOR), and α2 adrenergic receptor (A2AR); and Gq-coupled 5-hydroxytryptamine (serotonin) receptor-2A (5HT2A) and melatonin type-2 receptor (MT2). As with dLight1, we replaced IL3 with cpGFP, with insertion sites chosen to preserve the conserved positive charges (fig. S7A). All sensors localized to the membrane and showed positive fluorescence responses to their respective agonists (fig. S7B).
Two-photon imaging of dopamine release in dorsal striatum ex vivo and in vivo
We next used dLight1 to measure the time course and concentration of endogenous dopamine release triggered by electrical stimulation and drug modification in acute striatal slices with 2P imaging (Fig. 2A). Two to four weeks after injection of an adeno-associated virus encoding dLight1 (AAV9.hSynapsin1.dLight1.2) into the dorsal striatum, we observed both broadly distributed and localized fluorescence transients across the field of view (Fig. 2B and C, fig. S8A to C) in response to a single electrical stimulus. Fast line scan at these hotspots (Fig 2C) revealed a rapid onset of fluorescence increase (rise τ 1/2= 9.5 ± 1.1 ms) followed by a plateaued peak (averaged ΔF/F= 220 ± 50%) for about 150 ms, which decayed to baseline in about 400 ms (decay τ 1/2 = 90 ± 11ms, Fig. 2D). We observed robust and reproducible fluorescent transients to low-frequency stimuli over a prolonged imaging period, whereas subsequent higher frequency stimuli elicited much smaller responses (p<0.0001, Fig. 2E and F), indicating strong depression from an initially high probability of release. Blockade of dopamine reuptake with cocaine significantly prolonged the decay of fluorescence from peak to baseline (p<0.05, Fig. 2G and H), but with equivocal effect on response amplitude (P=0.056, Fig. 2G and H). Application of the competitive antagonist SKF83566 eliminated the responses (fig. S8F), confirming that fluorescent signals are indeed due to DA binding.
Fig. 2. Imaging electrically evoked and pharmacologically modulated dopamine release in acute dorsal striatum slices.
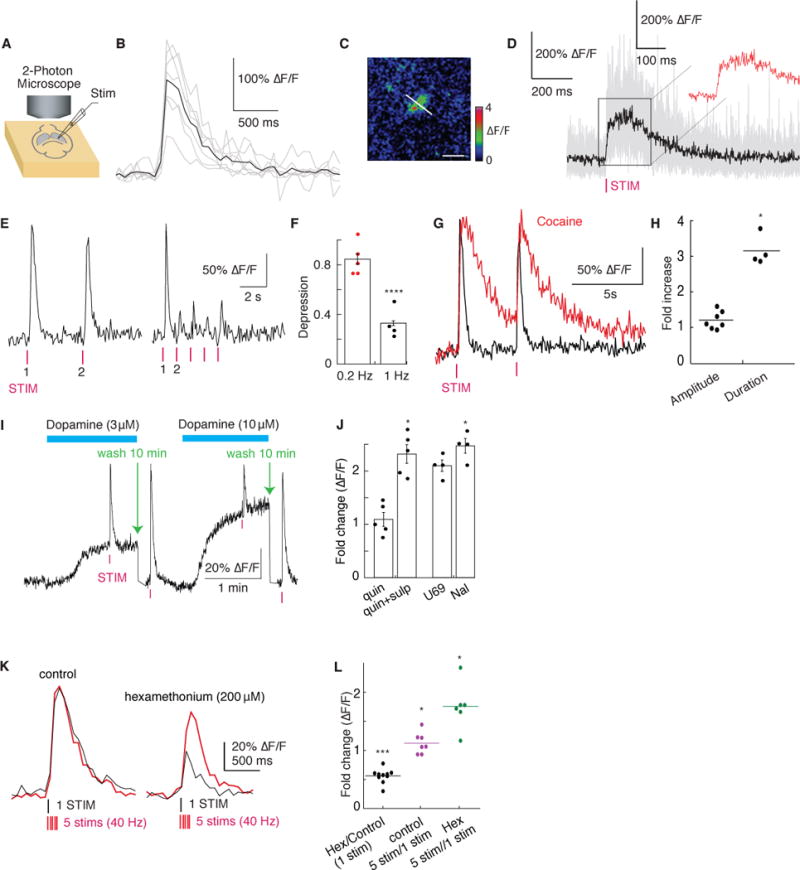
(A) Schematics of experimental setup. (B) Single-trial fluorescence response (average in black) in response to a single stimulus (0.5 ms). Images acquired at 15Hz using 2-photon light at 920nm. Averaged ΔF/F= 182 ± 21% across 7 trials, mean ± SEM. Scale bar: 20 μm. (C) Representative hotspot (ΔF/F) for line-scan. Scale bar: 20 μm. (D) Individual fluorescence traces during line-scan (500Hz) in response to a single stimulus (average in black across 13 trials). Inset shows zoomed-in view of the fluorescence plateau. (E) Fluorescence responses to low and high frequency stimuli (left 0.2Hz, right 1Hz) quantified in (F) (Fold change in ΔF/F = 0.506 ± 0.061 at 1Hz across 5 trials,). (G) Single trial fluorescence response in the presence of cocaine (10 μM) triggered by a single stimulus overlayed with trace without cocaine. (H) Quantification of fold change in peak fluorescence amplitude (1.056±0.095, n=7, P=0.056) and duration (3.15±0.213, n=4,). (I) Estimation of released DA concentration (single trial trace shown). (J) Quantification of fold change in peak fluorescence in the presence of bath applied sulpiride (400nM) (0.437 ± 0.052, n=5), quinpirole (1 μM) (0.926 ± 0.070, P<0.01, n=5), U69,593 (1 μM) (0.838 ± 0.042, n=4,) and Naloxone (1 μM) (1.022 ± 0.053, n=4). (K) Single-trial fluorescence response to either a single pulse (black) or a train of 5 pulses at 40Hz (red) in the absence (left) and presence (right) of the nicotinic acetylcholine receptor blocker hexamethonium (200 μM). (L) Quantification of fold change in peak fluorescence response in K (Hex/Control: 0.561 ± 0.038, n=10,; control 5stim/1stim: 1.13 ± 0.069, n=7; Hex 5stim/1stim: 1.76±0.16, n=6). *p<0.05, **p<0.01, ***p<0.001, ****p<0.0001, paired t test.
We next used dLight1 to estimate released DA concentration induced by a brief electrical stimulus. By comparison with a concentration-response curve (fig. S8D, E and G), the fluorescence response suggested a 10–30 μM DA release (Fig. 2I), which is 1–2 orders of magnitude higher than previously reported in ventral striatum using fast-scan cyclic voltammetry (FSCV) (25) and is similar to that reported by measuring DRD2 activation (26). Addition of saturating amphetamine (10 μM, in the presence of 400 μM sulpiride) increased tonic dopamine to 3.3 μM (fig. S8F and G).
We then examined the action of known modulators of dopamine release using dLight1 (Fig. 2J to L). Activation of D2-autoreceptors with quinpirole decreased the electrically evoked fluorescence transients, which was reversed by the application of sulpiride (p<0.01, Fig. 2J). Perfusion with a k-opioid receptor agonist (U69,593) caused a small decrease in the amplitude (P<0.05, Fig. 2J), which was completely blocked by naloxone (Fig. 2J). We then imaged the effects of nicotinic receptors activation in mediating the probability of dopamine release. Blockade of nicotinic receptors with hexamethonium profoundly reduced the fluorescence transient, which depended on the number of stimuli (*P<0.05, ***P<0.001, Fig. 2K, L). In the absence of hexamethonium, the amplitude of the fluorescence remained consistent regardless of the stimulation protocol (P=0.06, Fig. 2K, L) (27).
Next we asked whether dLight1 could reliably report dopamine signals associated with mouse locomotion in dorsal striatum, which was labeled with AAV1.hSynapsin1.dLight1.1/1.2 and AAV1.hSynapsin1.flex.tdTomato. We measured dopamine transients with 2P imaging during rest and self-initiated locomotion (fig. S9). Consistent with in-vivo 2P calcium imaging of substantia nigra pars compacta (SNc) axon terminals in dorsal striatum (10), dLight1 reliably showed widespread and synchronous sub-second transients associated with spontaneous locomotion, which was clearly distinguishable from motion artifacts (fig. S9A to E). The dopamine transients were rapidly and bi-directionally modulated with respect to locomotion. Accelerations were associated with an increase and decelerations with a decrease (peak mean cross-correlation 240 ms, P<0.001, fig. S9F to L).
In summary, dLight1 faithfully and directly reports the time course and concentration of local dopamine release and drug-dependent modulatory effects on dopamine release in acute striatum slice. In addition, dLight1 enables direct visualization of locomotion-triggered dopamine release in behaving mice.
Deep-brain recording of DA dynamics simultaneously with optogenetics or calcium imaging
The nucleus accumbens (NAc) receives projections from dopaminergic neurons in the ventral tegmental area (VTA). To directly probe DA release in freely moving mice, we delivered AAV9.CAG.dLight1.1 or AAV9.CAG.control_sensor in the NAc, followed by fiber photometry imaging (Fig. 3, fig. S10A and B). dLight1 revealed visible spontaneous dopamine transients, which were absent in the imaging sessions using the control sensor (fig. S10C).
Fig. 3. Deep brain imaging of DA release triggered by optogenetic stimulation and combined with calcium imaging in freely behaving mice.
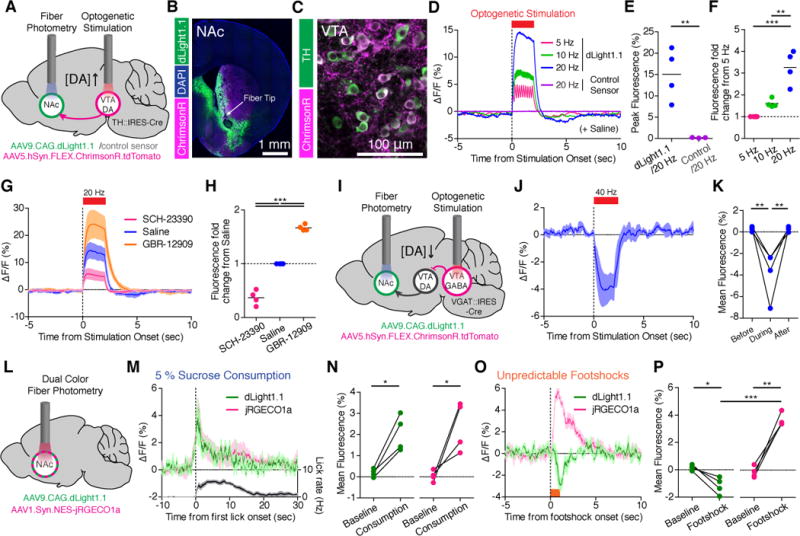
(A) Schematics showing fiber photometry recording of dLight1.1 or control sensor in the NAc while stimulating VTA DA neurons by optogenetics. (B) Expression of dLight1.1 in the NAc around fiber tip location and ChrimsonR expressing axons from midbrain. (C) ChrimsonR-expressing TH+DA neurons in the VTA. (D) Averaged fluorescence increase in response to optogenetic stimuli (n = 5 mice) (E) Quantification of peak fluorescence at 20Hz. (F) Fluorescence fold changes relative to 5Hz. (G–H) Optogenetically induced fluorescence increase of dLight1.1 after systemic administration of saline, D1 antagonist (SCH-23390, 0.25 mg/kg) and DA reuptake inhibitor (GBR-12909, 10 mg/kg) (n = 5 mice). (I) Schematics showing fiber photometry recording of dLight1.1 in the NAc and optogenetic stimulation of VTA GABA neurons that inhibits VTA DA neurons. (J–K) Averaged fluorescence decrease in response to optogenetic stimulation at 40 Hz (n = 4 mice) and mean fluorescence quantified in K. (L–P) Dual-color fiber photometry recording of DA release with dLight1.1 and local neuronal activity with jRGECO1a. (M–N) Increase of dLight1.1 (green) and jRGECO1a (magenta) fluorescence during 5% sucrose consumption with lick rate (black, n = 5 mice). Mean fluorescence was quantified in (N). (O–P) Fluorescence decrease in dLight1.1 (green) and increase in jRGECO1a (red) during unpredictable footshock delivery (0.6 mA for 1 sec, n = 5 mice). Mean fluorescence was quantified in (P). Data shown are means ± SEM. Significance was calculated by means of paired or unpaired t tests for two-group comparisons and one-way ANOVA by post hoc Tukey’s test for multiple-group comparisons. * p < 0.05, ** p < 0.01, *** p < 0.001.
To optically activate VTA DAergic neurons, we infected VTA of TH::IRES-Cre mice with AAV5.hSynapsin1.flex.ChrimsonR.tdTomato (28) (Fig. 3A to C, fig. S11A and B, fig. S12A and D). The high temporal resolution of dLight1 enabled detection of individual peaks of dopamine transients in response to 5, 10 and 20 Hz photostimulation (Fig. 3D, fig. S13A to C). The amplitude of fluorescence increase was correlated with the frequency of photostimulation (Fig. 3D and F). In contrast, no fluorescence changes were observed with the control sensor using 20Hz stimuli (Fig. 3D and E). Compared to saline-injected controls, systemic administration of SCH-23390 significantly reduced optogenetically-induced dLight1 responses, whereas the reuptake inhibitor GBR-12909 enhanced them (Fig. 3G to H).
Next, we examined whether dLight1 can report inhibition of DA transients. To induce transient inhibition of VTA DAergic neurons, we optogenetically stimulated VTA GABAergic neurons in VGAT::IRES-Cre mice (29) (Fig. 3I). Histology confirmed ChrimsonR expression in VTA GABAergic neurons (fig. S12B, C and E). We observed rapid and reversible reductions in dLight1 fluorescence in response to VTA GABAergic neuron photoactivation at 40 Hz (Fig. 3J and K, fig. S13D), indicating that dLight1 can report bidirectional changes in local DA release.
Motivationally salient stimuli modify dopamine neuron firing and downstream NAc activity (9, 29, 30). To link the DA release to local neuronal activity, we performed dual-color measurements with dLight1 and the red-shifted calcium indicator jRGECO1a (31) in lateral core/shell regions (Fig. 3L, fig. S10B, S11A and S12F). When mice voluntarily consumed reward (50 μL of 5% sucrose), we observed a concordant increase of DA concentration and local population activity (Fig. 3M, N, and S13E), similar to a class of NAc single units showing excitation upon reward (32). In contrast, footshocks suppressed DA release while enhancing local neuronal activity, indicating dissociation between DA dynamics and local circuit activity (Fig. 3O, P and S13F).
Chronic imaging of dopamine dynamics throughout cue-reward learning
We next examined the utility of dLight1 in reporting modulation of DA signaling in response to conditioned (CS) and unconditioned (US) stimuli throughout Pavlovian conditioning (Fig. 4A)(8, 33, 34). Mice successfully learned to associate the predictive cues to the reward as shown by increasing numbers of licks during CS over the course of training, and decreasing licks during extinction learning (Fig. 4B).
Fig. 4. Dynamic changes of NAc DA signaling during appetitive Pavlovian conditioning and reward prediction error.
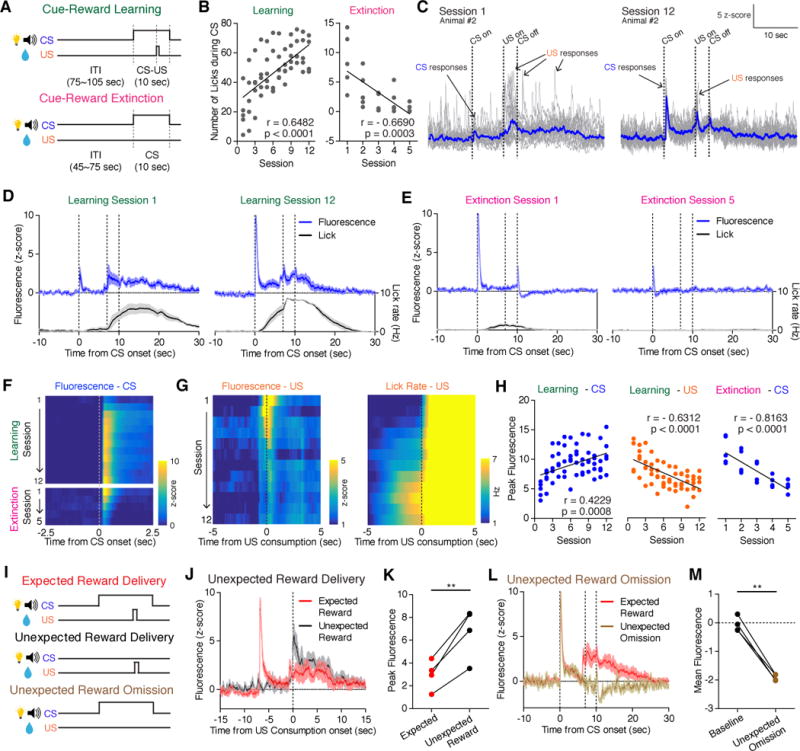
(A) Pavlovian conditioning procedures involved learning to associate neutral cues (CS; house light and 5 kHz tone) with a sucrose reward (US; 50μL of 5% sucrose), and subsequent extinction. (B) Change of CS-evoked licks across cue-reward learning (left) and extinction (right). (C–D) dLight1.1 dynamics in response to CS and US in first and last sessions of cue-reward learning, shown in single (gray) and averaged (blue) trials (n=20 trials) from a single animal (C) or averaged across all trials and animals (n=5 mice) (D). Lick rate shown in black. (E) Same as (D), of cue-reward extinction (n = 5 mice). In D and E, the dotted lines indicate CS onset, US onset and CS offset respectively. (F–H) Evolution of CS- (F) and US- evoked (G left panel) average fluorescence and US triggered licks (G right panel) across learning and extinction sessions. Quantification of peak fluorescence across learning and extinction shown in (H). (I) Reward prediction error procedure. (J) Fluorescence response during expected (red) versus unexpected (black) reward consumption (n = 4 mice). (K) Peak fluorescence evoked by expected (red) and unexpected (black) reward consumption. (L) Fluorescence response during expected (red) versus unexpected reward omission (brown) (n = 4 mice). Second and third dotted line indicates US onset and CS offset. (M) Mean fluorescence during baseline and after unexpected reward omission. Data shown are means ± SEM. Significance was calculated from Pearson’s correlation coefficient and with paired t-test. * p < 0.05, ** p < 0.01.
Repeated fiber photometry recordings in the NAc revealed two types of DA transients modulated during associative learning: increased DA response to the predictive cues and decreased response to reward consumption across sessions. In the first session, a small and time-locked phasic DA signal was present at the CS onset, while after US the DA signal was larger and also more temporally spread (Fig. 4C and D), consistent with US consumption onsets being highly variable at early stages (Fig. S14A and B). Aligning to consumption onset revealed large DA signal to the US at the first session (Fig. 4C and S14A). Upon repeated cue-reward pairings, the amplitude of CS response significantly increased (Fig 4C, D, F, H and S14C). On the other hand, US response, when aligned to the consumption onset, showed linear decrease across learning sessions. (Fig. 4G and H). This suggests that DA response gradually shifted from US to CS as animals acquired cue-reward association (Fig. 4H, and S14D) (9, 33). During extinction, we observed an attenuated phasic CS response (Fig. 4E, F and H). The amplitude of the phasic CS response was correlated with CS-triggered licking behavior during both learning and extinction sessions (Fig. S14E), suggesting that the CS response predicted the animal’s vigor to obtain reward.
We further investigated whether dLight1 can report signals correlated with “reward prediction error” (RPE)(4). After the animals had fully learned CS-US association, mice underwent “unexpected reward availability” sessions (in which the US was occasionally made available without the CS) in between normal paired trials (Fig. 4I). Unexpected reward consumption elicited significantly higher fluorescence compared to expected consumption (Fig. 4J and K). In the “unexpected reward omission” session, where the US was occasionally omitted after the predictive CS, fluorescence decreased below the pre-CS baseline after the time at which the US would have normally become available CS presentation (Fig. 4L and M).
Cellular-level imaging of functionally-heterogeneous dopamine transients in mouse cortex
Finally, we tested whether 2P imaging with dLight1 can reveal the spatiotemporal release of DA associated with reward in the cortex. The cortex receives projection axons from both SNc and VTA. Inputs from these nuclei carry distinct dopaminergic signals, influencing motor control and reward learning, respectively (10, 35). To demonstrate the utility of dLight1 in detecting behavior-related DA signals, we broadly labeled frontal/motor cortex with AAV9.hSynapsin1.dLight1.2, followed by 2P imaging of dLight1-expressing layer 2/3 neurons in head-fixed mice. The animals had fully learned a visuomotor association task that required them to run in response to a visual “Go” cue in order to receive a water reward (Fig. 5A and B). We observed task-related DA transients, distinguishable from motion artifacts (fig. S15), across cell-sized regions of interest (ROIs) across the field of view (Fig. 5C, fig. S16).
Fig. 5. Spatially resolved imaging of cortical dopamine release during a visuomotor association task.
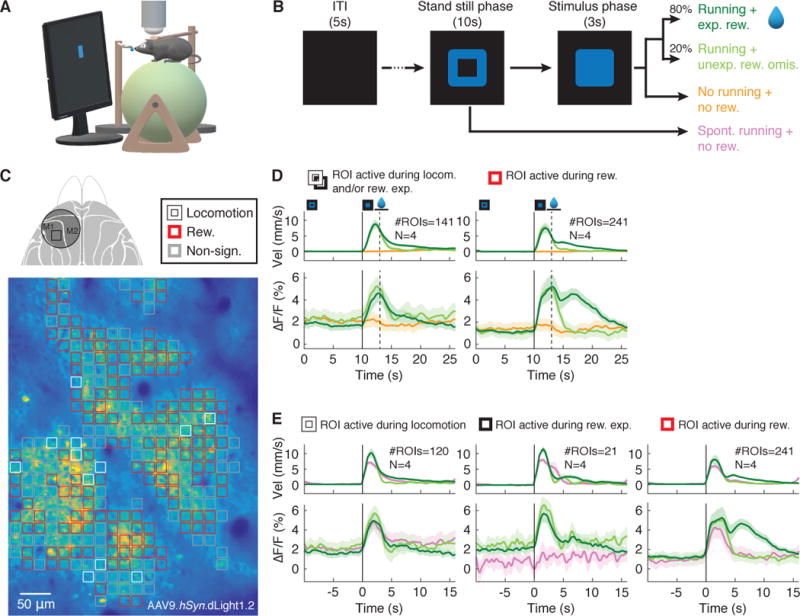
(A) Schematics of experimental setup. (B) To initiate a trial, mice were required to stand still for 10s following a visual cue (blue square). If mice started to run during the stimulus phase (“Hit trials”), a water reward was given. In 20% of randomly selected “Hit trials” the reward was withheld. If no run was triggered by stimulus presentation, the trials were counted as “Miss trials”. Erroneous/spontaneous runs during the stand-still phase ended the trial (no “Go” cue or reward). (C) Top, dorsal view of mouse cortex with the chronic cranial window (circle) and imaging location indicated (square). Bottom, heatmap of dLight1.2 expression pattern in layer 2/3 of M1 cortex. The image is overlaid with computationally defined regions of interest (ROIs, ~17×17μm). Colored ROIs indicate the type of fluorescence responses observed during the task. (D) Population data (N = 4 mice, n = 19 recording sessions) showing average task-related dLight1.2 transients (bottom) and mouse running velocity (top) aligned to trial/stand-still cue onset (0s). The solid vertical line indicates “Go” cue onset. The dotted line marks the end of the reward expectation phase during unrewarded Hit and Miss trials. The period during which running velocity-dependent reward consumption occurred is indicated by the horizontal line. Left, ROIs showing significantly increased responses during reward expectation/locomotion. Right, ROIs showing significant fluorescence increases to reward (dark green) but not unexpected reward omission (light green). Shaded areas of ΔF/F traces indicate s.d. (E) Population data realigned to running onset (vertical black line). ROIs with “Go” cue responses (panel D, left) can be subdivided into ROIs responsive to locomotion in all trials (left), and responsive to reward expectation only (center) with no fluorescence increases during spontaneous runs (pink). p<0.05, Wilcoxon test, Bonferroni corrected for multiple comparisons.
Aligning the DA transients to trial/stand still phase onset, we found two types of task relevant DA responses during the reward expectation and reward delivery intervals. An average of 63% of responsive ROIs showed significantly increased DA transients that correlated with reward, which were abolished by unexpected reward omission (20% of randomly selected trials) (Fig. 5D right panel). A subset of ROIs (~37%) showed significantly increased DA transients that lasted during the short phase of “Go” stimulus presentation for both rewarded and non-rewarded trials (Fig. 5D, left panel). These transient increases during the stimulus presentation phase were not caused by the stimulus appearance itself, because no significant increase in DA levels was observed during miss trials during which the animal saw the stimulus, but did not respond (Fig. 5D; yellow traces).
To investigate whether these early responses shown in 37% of ROIs reflect increased DA levels during reward expectation or correlate with locomotion, we aligned the trials at running onset (Fig. 5E, group averages; fig. S16G, single ROIs) and compared the DA transients of runs triggered by the “Go” stimulus (when the animals expected a reward) with spontaneous runs that erroneously occurred during the stand-still phase (with no reward expectation).
A small subset of responsive ROIs (5%) showed significant increases in DA transients during reward expectation but not spontaneous running (Fig. 5E, middle panel), whereas the other 32% of ROIs correlated with locomotion (Fig. 5E, left panel). The 63% of ROIs responsive to reward only (Fig. 5D, right panel) also showed increased DA transients during the early stimulus presentation phase consisting of both locomotion or reward expectation related responses (Fig. 5E, right panel). All three types of responses were consistently seen across animals. Comparing the heterogeneity of response transients between layer 1 and layers 2/3 of cortical area M1 (fig. S16E and F) we found that layer 2/3 showed more ROIs active during reward. A similar number of ROIs responded to locomotion and reward expectation in both layers (fig. S16H). Mesocortical dopaminergic projections are thus spatially intermingled and activation of these inputs leads to spatiotemporally heterogeneous DA signals in the cortex whose dynamics depends on motor behavior, reward expectation, and consumption.
Conclusion
We developed and applied a new class of genetically encoded indicators that overcome major barriers of current methods to permit high-resolution imaging of dopamine dynamics in acute brain slices and in behaving mice. The sub-micromolar affinity and fast kinetics of dLight1 offer fast temporal resolution (10 ms on and 100 ms off) to detect the physiologically or behaviorally relevant DA transients with higher molecular specificity compared to existing electrochemical or cell-based probes (14). For example, in the NAc of freely behaving mice, longitudinal measurements revealed different changes in time-resolved dopamine signals encoding either predictive cue or reward consumption across learning.
The disparate contributions of synaptic, extra-synaptic, and spillover dopamine events to circuit function are not addressable without fast, robust and genetically encoded sensors. In dorsal striatal slice, dLight1 reliably detected the concentration and time-course of dopamine transients and their modifications by pharmacological compounds. The rapid rise of fluorescence (10ms) and the peak concentration (10–30 μM) of dopamine following electrical stimulation indicates that the initial measures of dopamine are closely associated with the site of release (26). The decline of fluorescence, particularly in the presence of cocaine, results primarily from reuptake and diffusion of dopamine away from release sites.
dLight1 also permits high spatial resolution measurement of functionally-heterogeneous dopamine transients at the cellular level. In the cortex, 2P imaging with dLight1 revealed a dopamine transient map with spatially distributed, functionally heterogeneous dopamine signals during a visuomotor learning task. Simultaneous calcium imaging can further determine how spatiotemporal differences in DA levels relate to ongoing neural activity and influence associative learning or goal-directed behavior. dLight1.1 and dLight1.2 represent optimized sensor variants to be immediately applied to ex vivo or in vivo studies, as they offer a good balance between dynamic range and affinity. Other dLight variants may be suitable for measuring synaptic release (dLight 1.3) or tonic DA transients (dLight 1.4). Given the broadly tunable affinity and dynamic range of dLight1, protein engineering and high-throughput screening efforts can further optimize SNR and molecular specificity (36), as well as performance of other neuromodulator indicators.
In combination with calcium imaging and optogenetics, our sensors are well poised to permit direct functional analysis of how the spatiotemporal coding of neuromodulatory signaling mediates the plasticity and function of target circuits.
Supplementary Material
One sentence summary.
We developed and applied genetically-encoded dopamine sensors for high spatiotemporal optical measurement of dopamine release in vivo.
Acknowledgments
We thank Brian Paul McGrew for assistance during in vitro sensor library screening and Huaiyang Cheng for producing AAV virus. Luke Lavis (Janelia Research Campus) kindly provide us NV-caged DA. Erin Carey performed cortical viral vector injections. Dr. Brett Mensh provided critical advice for writing and revising the manuscript. This project was made possible with generous help from Dr. Loren Looger (HHMI Janelia Research Campus).
Funding: This work was supported by funding to L.T. (BRAIN Inititiave U01NS090604 and U01NS013522, DP2MH107056 from National Institute of Health), to A.N. (DP2NS083038, R01NS085938, P30CA014195), J.W., and M.V.Z (BRAIN Initiative U01NS013522 from National Institute of Health), to H.Z. (BRAIN Initiative U01NS094247 and R01NS104944), to D.D. (1R01MH110556 from National Institute of Health), and to V.G. (NIH DP2NS087949, NIH/NIA R01AG047664). K.M. is a DFG research fellow and recipient of a Catharina Foundation postdoctoral scholar award. V.G. is a Heritage Principal Investigator supported by the Heritage Medical Research Institute.
Footnotes
Author contributions: L.T. and T.P conceived the project. T.P. and L.T. designed, screened and optimized sensors and characterized them in mammalian cells and cultured neurons. R.L. simulated structure of the sensor. A.M. and M.V.Z. characterized signaling properties of the sensor. W-H. X. and H.Z. characterized the sensor in organotypic brain slices. J.W. performed characterization in acute brain slices. M.H. and D.D. characterized the sensor in vivo in the dorsal striatum. J.R.C. and V.G. performed fiber photometry recordings coupled with optogenetic manipulations, calcium imaging and behavioral experiments in NAc, analyzed the data and prepared the related figures and text. M.J.J. performed hybridization chain reaction experiments and prepared relevant figures and text with input from J.R.C and V.G. K.M., R.F. and A. N. performed the two-photon imaging experiments in the cortex of behaving mice, analyzed the data and prepared the related figures and text. All authors analyzed the data. L.T. led the project. L.T., T.P. wrote the paper with contributions from all authors.
Competing interests: L.T., R.L. and T.P. submitted a provisional patent application on sensor engineering.
Data and materials availability: All DNA and viruses have been deposited in NCBI (accession number MH244549-MH244561), ADDGENE and The University of Pennsylvania Vector Core. Computer codes are deposited in github (https://github.com/GradinaruLab/dLight1/). All other data needed to evaluate the conclusion in the paper are present in the paper or the supplementary materials.
List of Supplementary Materials: Materials and Methods Figures S1–S16 Data S1–S3 References (37–67)
References and Notes
- 1.Tritsch NX, Sabatini BL. Dopaminergic modulation of synaptic transmission in cortex and striatum. Neuron. 2012;76:33–50. doi: 10.1016/j.neuron.2012.09.023. [DOI] [PMC free article] [PubMed] [Google Scholar]
- 2.Wise RA. Dopamine, learning and motivation. Nat Rev Neurosci. 2004;5:483–494. doi: 10.1038/nrn1406. [DOI] [PubMed] [Google Scholar]
- 3.Dudman JT, Krakauer JW. The basal ganglia: from motor commands to the control of vigor. Curr Opin Neurobiol. 2016;37:158–166. doi: 10.1016/j.conb.2016.02.005. [DOI] [PubMed] [Google Scholar]
- 4.Schultz W, Dayan P, Montague PR. A neural substrate of prediction and reward. Science. 1997;275:1593–1599. doi: 10.1126/science.275.5306.1593. [DOI] [PubMed] [Google Scholar]
- 5.Lee SH, Dan Y. Neuromodulation of brain states. Neuron. 2012;76:209–222. doi: 10.1016/j.neuron.2012.09.012. [DOI] [PMC free article] [PubMed] [Google Scholar]
- 6.Marder E. Neuromodulation of neuronal circuits: back to the future. Neuron. 2012;76:1–11. doi: 10.1016/j.neuron.2012.09.010. [DOI] [PMC free article] [PubMed] [Google Scholar]
- 7.Schultz W. Dopamine reward prediction-error signalling: a two-component response. Nat Rev Neurosci. 2016;17:183–195. doi: 10.1038/nrn.2015.26. [DOI] [PMC free article] [PubMed] [Google Scholar]
- 8.Pan WX, Schmidt R, Wickens JR, Hyland BI. Dopamine cells respond to predicted events during classical conditioning: evidence for eligibility traces in the reward-learning network. J Neurosci. 2005;25:6235–6242. doi: 10.1523/JNEUROSCI.1478-05.2005. [DOI] [PMC free article] [PubMed] [Google Scholar]
- 9.Cohen JY, Haesler S, Vong L, Lowell BB, Uchida N. Neuron-type-specific signals for reward and punishment in the ventral tegmental area. Nature. 2012;482:85–88. doi: 10.1038/nature10754. [DOI] [PMC free article] [PubMed] [Google Scholar]
- 10.Howe MW, Dombeck DA. Rapid signalling in distinct dopaminergic axons during locomotion and reward. Nature. 2016;535:505–510. doi: 10.1038/nature18942. [DOI] [PMC free article] [PubMed] [Google Scholar]
- 11.Cui G, et al. Concurrent activation of striatal direct and indirect pathways during action initiation. Nature. 2013;494:238–242. doi: 10.1038/nature11846. [DOI] [PMC free article] [PubMed] [Google Scholar]
- 12.Jaquins-Gerstl A, Michael AC. A review of the effects of FSCV and microdialysis measurements on dopamine release in the surrounding tissue. Analyst. 2015;140:36963708. doi: 10.1039/c4an02065k. [DOI] [PMC free article] [PubMed] [Google Scholar]
- 13.Ganesana M, Lee ST, Wang Y, Venton BJ. Analytical Techniques in Neuroscience: Recent Advances in Imaging, Separation, and Electrochemical Methods. Anal Chem. 2017;89:314–341. doi: 10.1021/acs.analchem.6b04278. [DOI] [PMC free article] [PubMed] [Google Scholar]
- 14.Muller A, Joseph V, Slesinger PA, Kleinfeld D. Cell-based reporters reveal in vivo dynamics of dopamine and norepinephrine release in murine cortex. Nat Methods. 2014;11:1245–1252. doi: 10.1038/nmeth.3151. [DOI] [PMC free article] [PubMed] [Google Scholar]
- 15.Lee D, et al. Temporally precise labeling and control of neuromodulatory circuits in the mammalian brain. Nat Methods. 2017;14:495–503. doi: 10.1038/nmeth.4234. [DOI] [PubMed] [Google Scholar]
- 16.Ford CP, Phillips PE, Williams JT. The time course of dopamine transmission in the ventral tegmental area. J Neurosci. 2009;29:13344–13352. doi: 10.1523/JNEUROSCI.3546-09.2009. [DOI] [PMC free article] [PubMed] [Google Scholar]
- 17.Ford CP, Gantz SC, Phillips PE, Williams JT. Control of extracellular dopamine at dendrite and axon terminals. J Neurosci. 2010;30:6975–6983. doi: 10.1523/JNEUROSCI.1020-10.2010. [DOI] [PMC free article] [PubMed] [Google Scholar]
- 18.Chen TW, et al. Ultrasensitive fluorescent proteins for imaging neuronal activity. Nature. 2013;499:295–300. doi: 10.1038/nature12354. [DOI] [PMC free article] [PubMed] [Google Scholar]
- 19.Marvin JS, et al. An optimized fluorescent probe for visualizing glutamate neurotransmission. Nat Methods. 2013;10:162–170. doi: 10.1038/nmeth.2333. [DOI] [PMC free article] [PubMed] [Google Scholar]
- 20.Manglik A, et al. Structural Insights into the Dynamic Process of beta2-Adrenergic Receptor Signaling. Cell. 2015;161:1101–1111. doi: 10.1016/j.cell.2015.04.043. [DOI] [PMC free article] [PubMed] [Google Scholar]
- 21.Rasmussen SG, et al. Crystal structure of the beta2 adrenergic receptor-Gs protein complex. Nature. 2011;477:549–555. doi: 10.1038/nature10361. [DOI] [PMC free article] [PubMed] [Google Scholar]
- 22.Strader CD, et al. Conserved aspartic acid residues 79 and 113 of the beta-adrenergic receptor have different roles in receptor function. J Biol Chem. 1988;263:10267–10271. [PubMed] [Google Scholar]
- 23.Irannejad R, et al. Conformational biosensors reveal GPCR signalling from endosomes. Nature. 2013;495:534–538. doi: 10.1038/nature12000. [DOI] [PMC free article] [PubMed] [Google Scholar]
- 24.Vickery RG, von Zastrow M. Distinct dynamin-dependent and -independent mechanisms target structurally homologous dopamine receptors to different endocytic membranes. J Cell Biol. 1999;144:31–43. doi: 10.1083/jcb.144.1.31. [DOI] [PMC free article] [PubMed] [Google Scholar]
- 25.Yorgason JT, Zeppenfeld DM, Williams JT. Cholinergic Interneurons Underlie Spontaneous Dopamine Release in Nucleus Accumbens. J Neurosci. 2017;37:2086–2096. doi: 10.1523/JNEUROSCI.3064-16.2017. [DOI] [PMC free article] [PubMed] [Google Scholar]
- 26.Courtney NA, Ford CP. The timing of dopamine- and noradrenaline-mediated transmission reflects underlying differences in the extent of spillover and pooling. J Neurosci. 2014;34:7645–7656. doi: 10.1523/JNEUROSCI.0166-14.2014. [DOI] [PMC free article] [PubMed] [Google Scholar]
- 27.Mamaligas AA, Cai Y, Ford CP. Nicotinic and opioid receptor regulation of striatal dopamine D2-receptor mediated transmission. Sci Rep. 2016;6:37834. doi: 10.1038/srep37834. [DOI] [PMC free article] [PubMed] [Google Scholar]
- 28.Gunaydin LA, et al. Natural neural projection dynamics underlying social behavior. Cell. 2014;157:1535–1551. doi: 10.1016/j.cell.2014.05.017. [DOI] [PMC free article] [PubMed] [Google Scholar]
- 29.Tan KR, et al. GABA neurons of the VTA drive conditioned place aversion. Neuron. 2012;73:1173–1183. doi: 10.1016/j.neuron.2012.02.015. [DOI] [PMC free article] [PubMed] [Google Scholar]
- 30.Brischoux F, Chakraborty S, Brierley DI, Ungless MA. Phasic excitation of dopamine neurons in ventral VTA by noxious stimuli. Proc Natl Acad Sci U S A. 2009;106:4894–4899. doi: 10.1073/pnas.0811507106. [DOI] [PMC free article] [PubMed] [Google Scholar]
- 31.Dana H, et al. Sensitive red protein calcium indicators for imaging neural activity. Elife. 2016;5 doi: 10.7554/eLife.12727. [DOI] [PMC free article] [PubMed] [Google Scholar]
- 32.Taha SA, Fields HL. Encoding of palatability and appetitive behaviors by distinct neuronal populations in the nucleus accumbens. J Neurosci. 2005;25:1193–1202. doi: 10.1523/JNEUROSCI.3975-04.2005. [DOI] [PMC free article] [PubMed] [Google Scholar]
- 33.Day JJ, Roitman MF, Wightman RM, Carelli RM. Associative learning mediates dynamic shifts in dopamine signaling in the nucleus accumbens. Nat Neurosci. 2007;10:1020–1028. doi: 10.1038/nn1923. [DOI] [PubMed] [Google Scholar]
- 34.Clark JJ, et al. Chronic microsensors for longitudinal, subsecond dopamine detection in behaving animals. Nat Methods. 2010;7:126–129. doi: 10.1038/nmeth.1412. [DOI] [PMC free article] [PubMed] [Google Scholar]
- 35.da Silva JA, Tecuapetla F, Paixao V, Costa RM. Dopamine neuron activity before action initiation gates and invigorates future movements. Nature. 2018;554:244–248. doi: 10.1038/nature25457. [DOI] [PubMed] [Google Scholar]
- 36.Piatkevich KD, et al. A robotic multidimensional directed evolution approach applied to fluorescent voltage reporters. Nat Chem Biol. 2018 doi: 10.1038/s41589-018-0004-9. [DOI] [PMC free article] [PubMed] [Google Scholar]
- 37.Quan J, Tian J. Circular polymerase extension cloning for high-throughput cloning of complex and combinatorial DNA libraries. Nat Protoc. 2011;6:242–251. doi: 10.1038/nprot.2010.181. [DOI] [PubMed] [Google Scholar]
- 38.Tian L, et al. Imaging neural activity in worms, flies and mice with improved GCaMP calcium indicators. Nat Methods. 2009;6:875–881. doi: 10.1038/nmeth.1398. [DOI] [PMC free article] [PubMed] [Google Scholar]
- 39.Waterhouse AM, Procter JB, Martin DM, Clamp M, Barton GJ. Jalview Version 2–a multiple sequence alignment editor and analysis workbench. Bioinformatics. 2009;25:1189–1191. doi: 10.1093/bioinformatics/btp033. [DOI] [PMC free article] [PubMed] [Google Scholar]
- 40.Song Y, et al. High-resolution comparative modeling with RosettaCM. Structure. 2013;21:1735–1742. doi: 10.1016/j.str.2013.08.005. [DOI] [PMC free article] [PubMed] [Google Scholar]
- 41.Cherezov V, et al. High-resolution crystal structure of an engineered human beta2-adrenergic G protein-coupled receptor. Science. 2007;318:1258–1265. doi: 10.1126/science.1150577. [DOI] [PMC free article] [PubMed] [Google Scholar]
- 42.Chen Y, et al. Structural insight into enhanced calcium indicator GCaMP3 and GCaMPJ to promote further improvement. Protein Cell. 2013;4:299–309. doi: 10.1007/s13238-013-2103-4. [DOI] [PMC free article] [PubMed] [Google Scholar]
- 43.Bender BJ, et al. Protocols for Molecular Modeling with Rosetta3 and RosettaScripts. Biochemistry. 2016;55:4748–4763. doi: 10.1021/acs.biochem.6b00444. [DOI] [PMC free article] [PubMed] [Google Scholar]
- 44.Patriarchi T, et al. Nanodelivery of a functional membrane receptor to manipulate cellular phenotype. Sci Rep. 2018;8:3556. doi: 10.1038/s41598-018-21863-3. [DOI] [PMC free article] [PubMed] [Google Scholar]
- 45.Patriarchi T, et al. Phosphorylation of Cav1.2 on S1928 uncouples the L-type Ca2+ channel from the beta2 adrenergic receptor. EMBO J. 2016;35:1330–1345. doi: 10.15252/embj.201593409. [DOI] [PMC free article] [PubMed] [Google Scholar]
- 46.Robinson BG, et al. Desensitized D2 autoreceptors are resistant to trafficking. Sci Rep. 2017;7:4379. doi: 10.1038/s41598-017-04728-z. [DOI] [PMC free article] [PubMed] [Google Scholar]
- 47.Stoppini L, Buchs PA, Muller D. A simple method for organotypic cultures of nervous tissue. J Neurosci Methods. 1991;37:173–182. doi: 10.1016/0165-0270(91)90128-m. [DOI] [PubMed] [Google Scholar]
- 48.Zhong H, et al. Subcellular dynamics of type II PKA in neurons. Neuron. 2009;62:363–374. doi: 10.1016/j.neuron.2009.03.013. [DOI] [PMC free article] [PubMed] [Google Scholar]
- 49.Otmakhov N, Lisman J. Measuring CaMKII concentration in dendritic spines. J Neurosci Methods. 2012;203:106–114. doi: 10.1016/j.jneumeth.2011.09.022. [DOI] [PMC free article] [PubMed] [Google Scholar]
- 50.Vong L, et al. Leptin action on GABAergic neurons prevents obesity and reduces inhibitory tone to POMC neurons. Neuron. 2011;71:142–154. doi: 10.1016/j.neuron.2011.05.028. [DOI] [PMC free article] [PubMed] [Google Scholar]
- 51.Lindeberg J, et al. Transgenic expression of Cre recombinase from the tyrosine hydroxylase locus. Genesis. 2004;40:67–73. doi: 10.1002/gene.20065. [DOI] [PubMed] [Google Scholar]
- 52.Tufail Y, et al. Phosphatidylserine Exposure Controls Viral Innate Immune Responses by Microglia. Neuron. 2017;93:574–586 e578. doi: 10.1016/j.neuron.2016.12.021. [DOI] [PMC free article] [PubMed] [Google Scholar]
- 53.Matsui A, Jarvie BC, Robinson BG, Hentges ST, Williams JT. Separate GABA afferents to dopamine neurons mediate acute action of opioids, development of tolerance, and expression of withdrawal. Neuron. 2014;82:1346–1356. doi: 10.1016/j.neuron.2014.04.030. [DOI] [PMC free article] [PubMed] [Google Scholar]
- 54.Cardin JA, et al. Targeted optogenetic stimulation and recording of neurons in vivo using cell-type-specific expression of Channelrhodopsin-2. Nat Protoc. 2010;5:247–254. doi: 10.1038/nprot.2009.228. [DOI] [PMC free article] [PubMed] [Google Scholar]
- 55.Goldey GJ, et al. Removable cranial windows for long-term imaging in awake mice. Nat Protoc. 2014;9:2515–2538. doi: 10.1038/nprot.2014.165. [DOI] [PMC free article] [PubMed] [Google Scholar]
- 56.Asaad WF, Eskandar EN. A flexible software tool for temporally-precise behavioral control in Matlab. J Neurosci Methods. 2008;174:245–258. doi: 10.1016/j.jneumeth.2008.07.014. [DOI] [PMC free article] [PubMed] [Google Scholar]
- 57.Asaad WF, Santhanam N, McClellan S, Freedman DJ. High-performance execution of psychophysical tasks with complex visual stimuli in MATLAB. J Neurophysiol. 2013;109:249–260. doi: 10.1152/jn.00527.2012. [DOI] [PMC free article] [PubMed] [Google Scholar]
- 58.Eshel N, et al. Arithmetic and local circuitry underlying dopamine prediction errors. Nature. 2015;525:243–246. doi: 10.1038/nature14855. [DOI] [PMC free article] [PubMed] [Google Scholar]
- 59.Park J, Takmakov P, Wightman RM. In vivo comparison of norepinephrine and dopamine release in rat brain by simultaneous measurements with fast-scan cyclic voltammetry. J Neurochem. 2011;119:932–944. doi: 10.1111/j.1471-4159.2011.07494.x. [DOI] [PMC free article] [PubMed] [Google Scholar]
- 60.Pologruto TA, Sabatini BL, Svoboda K. ScanImage: flexible software for operating laser scanning microscopes. Biomed Eng Online. 2003;2:13. doi: 10.1186/1475-925X-2-13. [DOI] [PMC free article] [PubMed] [Google Scholar]
- 61.Sheffield MEJ, Adoff MD, Dombeck DA. Increased Prevalence of Calcium Transients across the Dendritic Arbor during Place Field Formation. Neuron. 2017;96:490–504 e495. doi: 10.1016/j.neuron.2017.09.029. [DOI] [PMC free article] [PubMed] [Google Scholar]
- 62.Dombeck DA, Harvey CD, Tian L, Looger LL, Tank DW. Functional imaging of hippocampal place cells at cellular resolution during virtual navigation. Nat Neurosci. 2010;13:1433–1440. doi: 10.1038/nn.2648. [DOI] [PMC free article] [PubMed] [Google Scholar]
- 63.Lerner TN, et al. Intact-Brain Analyses Reveal Distinct Information Carried by SNc Dopamine Subcircuits. Cell. 2015;162:635–647. doi: 10.1016/j.cell.2015.07.014. [DOI] [PMC free article] [PubMed] [Google Scholar]
- 64.Cho JR, et al. Dorsal Raphe Dopamine Neurons Modulate Arousal and Promote Wakefulness by Salient Stimuli. Neuron. 2017;94:1205–1219 e1208. doi: 10.1016/j.neuron.2017.05.020. [DOI] [PubMed] [Google Scholar]
- 65.Choi HM, Beck VA, Pierce NA. Next-generation in situ hybridization chain reaction: higher gain, lower cost, greater durability. ACS Nano. 2014;8:4284–4294. doi: 10.1021/nn405717p. [DOI] [PMC free article] [PubMed] [Google Scholar]
- 66.Choi, et al. Third-generation in situ hybridization chain reaction: multiplexed, quantitative, sensitive, versatile, robust. bioRxiv. :285213. doi: 10.1242/dev.165753. https://doi.org/10.1101/285213 [DOI] [PMC free article] [PubMed]
- 67.Shah S, et al. Single-molecule RNA detection at depth by hybridization chain reaction and tissue hydrogel embedding and clearing. Development. 2016;143:2862–2867. doi: 10.1242/dev.138560. [DOI] [PMC free article] [PubMed] [Google Scholar]
Associated Data
This section collects any data citations, data availability statements, or supplementary materials included in this article.