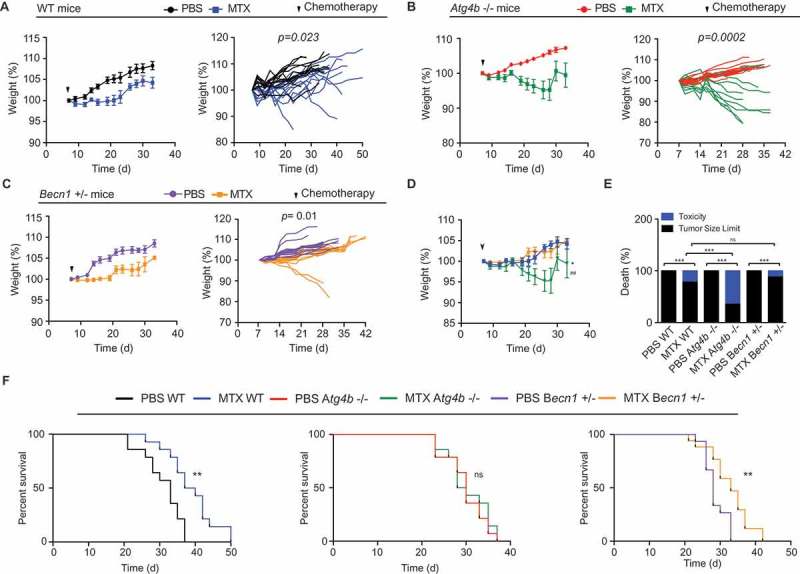
Figure 3.

Autophagy deficient mice show increased toxicity in response to anthracyclines based chemotherapy. (A-C) Wild type (WT) autophagy competent C57BL/6 mice (A) or autophagy deficient Atg4b−/- (B) and Becn1+/- (C) mice bearing MCA205 fibrosarcoma tumors received a single injection (i.p.) of mitoxantrone (MTX) or an equivalent volume of PBS, and bodyweight was monitored over time as an indicator of chemotherapy derived toxicity. Average (± S.E.M) (left panel) and individual (right panel) bodyweight curves are shown. Data represent a pool of three different experiments. Statistical analysis of body weight curves was performed by means of linear mixed-effect modeling (over the whole time course). (D) Comparison of MTX effects on body weight between autophagy competent WT and autophagy deficient mice. * p < 0.05 (for MTX WT vs MTX Atg4b−/- comparison); ## p < 0.01 (for MTX Atg4b−/- vs MTX Becn1+/- comparison). (E) Analysis of death type from autophagy competent versus autophagy deficient mice challenged with MTX chemotherapy. ns, non significant; *** p < 0.001 (binomial test). (F) Survival curves of MCA205 tumor bearing WT, Atg4b−/- and Becn1+/- mice. Statistical significance was assessed by means of log rank test. ** p < 0.01.
