

ABSTRACT
Through whole-transcriptome profiling of HER2+ breast carcinomas (BCs), we previously showed that those sensitive to trastuzumab are addicted to this oncoprotein and are enriched in immune pathways, raising the hypothesis that HER2 itself regulates immune cell recruitment. In the present study we investigated the relationship between HER2 activity and the pro-trastuzumab tumor immune milieu. Gene expression profiling and immunohistochemistry analysis of 53 HER2+ BCs showed that trastuzumab-sensitive tumors expressed significantly higher levels of chemokines involved in immune cell recruitment, with higher infiltration of T cells and monocytes, and higher levels of PD-1 ligands than tumors that do not benefit from trastuzumab. In vitro analysis in HER2+ BC cells revealed that CCL2 production was induced by HER2 stimulation with EGF/HRG via the PI3K-NF-kB axis, and down-modulated by HER2 inhibition with trastuzumab. CCL2 expression was higher in HER2+/ER− than HER2+/ER+ BC cell lines, and degradation of ER by fulvestrant induced an enhancement in NF-κB transcriptional activity and consequent CCL2 expression. Trastuzumab efficacy relied on CCL2 levels and monocytes present in the tumor microenvironment in FVB mice bearing HER2+ mammary carcinoma cells. HER2 signals were also found to sustain the expression of PD-1 ligands in tumor cells via the MEK pathway.
Overall, our results support the concept that the activated HER2 oncogene regulates recruitment and activation of tumor infiltrating immune cells and trastuzumab activity by inducing CCL2 and PD-1 ligands and that ER activity negatively controls the HER2-driven pro-trastuzumab tumor microenvironment.
KEYWORDS: Breast cancer, HER2, trastuzumab, chemokine, CCL2, immune cells
Introduction
The clinical benefit of the monoclonal antibody trastuzumab has been widely demonstrated in HER2+ patients with breast carcinoma (BC); however, a considerable number of women do not benefit from this therapy.1,2 Several studies have investigated the possibility of identifying biomarkers to distinguish patients sensitive to this therapy from those suited for novel targeted approaches.3 Recently, analyses of gene expression profiles of tumor blocks from patients enrolled in clinical trials support a relationship between tumor dependence on HER2 signaling (HER2-E by PAM50) and trastuzumab sensitivity.4,5 Moreover, based on increasing evidence of the role of both innate and adaptive immunity in trastuzumab mechanism of action,6,7 immune-related information such as tumor infiltrating lymphocyte count or immune-related signatures were explored and found to be predictive of trastuzumab benefit in several studies.8 In this context, through transcriptome profiling of archival formalin-fixed paraffin embedded (FFPE) tumor blocks from HER2+ cases treated with adjuvant trastuzumab in our Institute during routine clinical practice,9 we identified BCs exquisitely sensitive to treatment as those with both tumor dependence on HER2 signaling by PAM50 classification, as well as enriched in immune genes,9 supporting the predictive power of both addiction to HER2 signaling and immune infiltration because of their ability to identify the same tumors. Thus, as described for some oncogenes that cause pathogenesis of human cancer (e.g., RAS, BRAF, RET/PTC1, and MYC),10 a direct connection between HER2 activity and tumor immune infiltration may occur.
In the present study, we investigated whether a relationship exists between HER2 activity and immune infiltration and the means by which HER2 signaling contributes to mold the tumor immune microenvironment to further trastuzumab anti-tumor activity. We found that trastuzumab-sensitive tumors express significantly higher levels of chemokines involved in immune cell recruitment than tumors that do not benefit from trastuzumab. In vitro analysis in HER2+ BC cell lines revealed that CCL2, mainly involved in the recruitment of monocytes, was modulated by the PI3K/NF-kB pathway downstream of the HER2 receptor. Trastuzumab efficacy was dependent on CCL2 levels and monocytes present in the tumor microenvironment (TME) in an in vivo model. Moreover, estrogen receptor was found to block the HER2-mediated production of CCL2 in vitro by inhibiting NF-kB activity, suggesting that the recruitment of immune cells relevant for trastuzumab anti tumor activity may be ascribed to intersecting signals between HER2 and the ER.
Results
Association between HER2 dependency and the immune microenvironment in human HER2+ BCs
We recently developed a TRAstuzumab Risk model (TRAR) predictive of trastuzumab benefit both in adjuvant and neoadjuvant settings.9 Through gene expression analysis of 53 HER2+ BCs of the Group Herceptin in Adjuvant Therapy (GHEA) cohort we identified responsive tumors (TRAR-low) as those dependent on HER2 signals (HER2-E by PAM50 classification), enriched in immune genes, and highly infiltrated by CD8+ T cells.9 Confirming the tumor dependence on HER2 signal, TRAR-low tumors exhibited lower levels of the estrogen receptor-related score (ERS), indicative of activity of the ER pathway,11 than TRAR-high tumors (Figure 1A).
Figure 1.
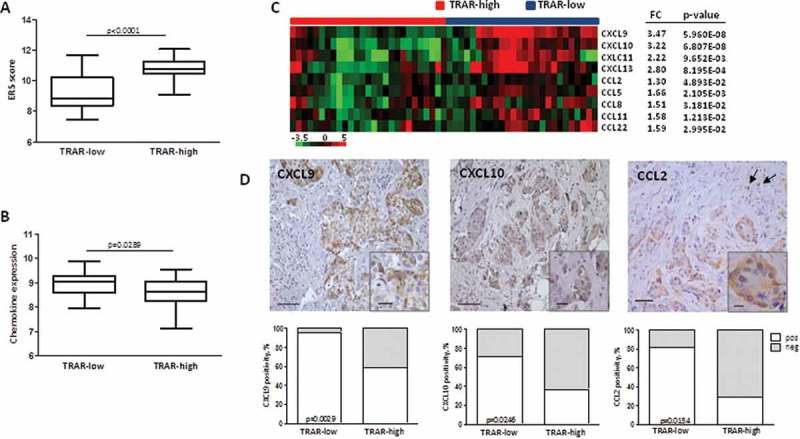
Enhanced expression of chemokines in HER2+ BCs classified as sensitive to trastuzumab. A) ERS score expression in GHEA tumors according to TRAR classification. p-value by unpaired t-test. B) Average expression of chemokine genes in GHEA tumors. p-value by unpaired t-test. C) Chemokine genes significantly and differentially expressed in TRAR-low vs TRAR-high tumors. For each gene, the fold difference (FC) between the two groups and the relative p-value are reported. D) Representative images of CXCL9, CXCL10, and CCL2 positive tumors. Arrows show CCL2-positive macrophages. Scale bars: 50 μm in the main images and 20 μm in the zoomed images. Lower panels show the percentages of positive cases (white boxes) and negative cases (grey boxes) according to TRAR classification. p-values by Fisher’s test (n = 51).
To investigate whether a causal relationship exists between HER2 oncogene activity and tumor immune infiltration, in the present study the expression levels of chemokines involved in the recruitment of immune cells were explored in the GHEA cohort. Mean expression of all chemokine genes belonging to the CXC and CC subfamilies (Supplementary Table S1) was significantly higher in tumors classified as low risk of relapse after trastuzumab treatment (TRAR-low) than in high risk tumors (TRAR-high) (p < 0.05) (Figure 1B). Moreover, TRAR-low tumors showed significantly higher levels of CC subfamily chemokines (CCL2, CCL5, CCL8, CCL11, and CCL22), mainly involved in the recruitment of monocytes to the site of inflammation, and of CXC subfamily chemokines (CXCL9, CXCL 10, CXCL 11, and CXCL 13) that induce the migration mainly of T cells and B cells12 (Figure 1C and Supplementary Table S2). IHC analysis of CXCL9, CXCL10, and CCL2 in FFPE specimens of the same cases from the GHEA cohort showed chemokine expression mainly in tumor cells and significant association with TRAR-low classification (Figure 1D). CCL2 was found to also be expressed in stromal cells with macrophage morphology, as indicated by arrows in Figure 1D, CCL2 panel. As a possible consequence of high expression of these chemokines, TRAR-low tumors exhibited higher infiltration of CD8+ T cells, as previously described,9 and monocytes (CD68+ cells) than TRAR-high tumors (p = 0.0063) (Figure 2A). CD68+ cells were mainly localized in tumor stroma and exhibited similar levels of contact with tumor cells in some areas in both TRAR-low and TRAR-high tumors. Similar staining patterns were observed by using both the anti-CD68 clone KP1 and PGM1, the latter described to be more specific for macrophages than the anti-CD68 KP1. ssGSEA analysis showed an enrichment in M1 gene patterns in TRAR-low vs TRAR-high tumors, whereas no differences in genes related to M2 polarization were found (Supplementary Fig. S1). No differences in the number of regulatory T cells or CD33+ cells as defined according to TRAR classification were detected (Figure 2B).
Figure 2.
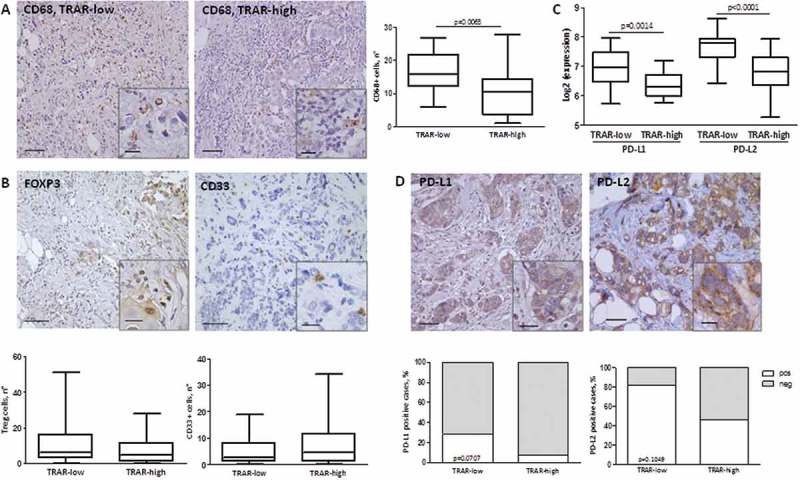
Characterization of immune TME of HER2+ BCs. A-B) IHC evaluation of CD68+ cells (A), FOXP3+ Treg, and CD33+ cells (B) in tissues of the GHEA cohort. The average number of positive cells in three-fields is shown. Scale bars: 50 μm in the main images and 20 μm in the zoomed images. p-value by unpaired t-test (n = 47) C) PDL1 and PDL2 mRNA expression in tumors of the GHEA cohort according to TRAR classification. p-values by unpaired t-test. D) Representative image of PD-L1 and PD-L2 positive tumors. Scale bars: 50 μm and 20 μm in the zoomed image. Lower panel shows the percentages of negative cases (grey boxes) and positive cases (white boxes) according to TRAR classification. p-values by Fisher’s test (PD-L1: n = 51, PD-L2: n = 25).
Based on i) the higher infiltration of effector immune cells in TRAR-low than TRAR-high tumors without concomitant increase of immune suppressive cells, ii) the poor prognosis of TRAR-low patients when not treated with trastuzumab9, and iii) the emerging data showing that PD-L1 expression by tumor cells could block lymphocyte activity,13 we analyzed PD-1 ligand expression according to TRAR classification. PD-L1 and PD-L2 were expressed at significantly higher levels in TRAR-low than TRAR-high tumors at the mRNA level (Figure 2C). Accordingly, higher PD-L1 and PD-L2 protein expression was observed in tumor cells by IHC in TRAR-low compared to TRAR-high tumor samples (Figure 2D), supporting the possibility that these tumors escape the control of the recruited immune cells through the PD-1 receptor-ligand axis.
These data indicate that HER2+ BCs classified as sensitive to trastuzumab (TRAR-low) comprised those enriched in the expression of chemokines along with specifically recruited immune cells, and expressing PD-1 ligands as an immune escape mechanism.
Regulation of chemokine expression by HER2-mediated signaling
To understand whether CXC and CC chemokines enriched in TRAR-low tumors could be regulated by HER2 signals, HER2+ BC cells (BT474, SKBr3, and ZR75.30) were treated with EGF/HRG or trastuzumab, in order to activate signals downstream of HER2/EGFR and HER2/HER3 heterodimers or to block the receptor signaling, respectively (Supplementary Fig. S2) and analyzed by qRT-PCR for chemokine expression. Treatment with EGF or HRG did not induce up-modulation of CXCLs, or CCL5 expression (Figure 3A,B) nor was down-modulation revealed upon inhibition of HER2 signaling by trastuzumab treatment (Figure 3C). CCL22 was increased by EGF or HRG whereas no reduction upon inhibition of HER2 by trastuzumab was observed, suggesting no direct involvement of HER2-mediated signaling in regulating the expression of this chemokine. In contrast, CCL2 always showed significant up- or down-modulation associated with HER2 activity or inhibition, respectively (Figure 3A-C). CCL2 protein quantification by ELISA in culture supernatants of BT474 and SKBr3 cells confirmed an increased release of this chemokine in both cell lines after treatment with EGF/HRG compared to untreated cells (Figure 3D). In support of the role of HER2 signaling in modulating CCL2 production by tumor cells, CCL2 mRNA was found to be significantly reduced by approximately 40% (± 18%) in 70% of tumor biopsies of the 03–311 trial14 after treatment with one cycle of trastuzumab alone (Figure 3E). In addition, immunofluorescence evaluation of HER2 and CCL2 in murine mammary carcinomas derived from human d16HER2 FVB transgenic mice15 showed co-expression of CCL2 with the HER2 oncogene in tumor cells (Figure 3F).
Figure 3.
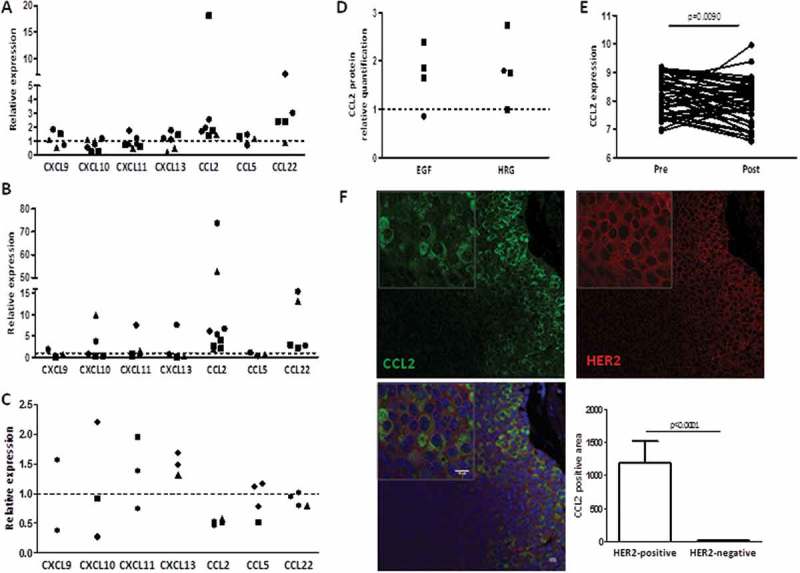
Changes of chemokine expression levels upon stimulation or blockage of HER2 receptor signaling. A-C) Chemokine mRNA expression in cells as evaluated by qRT-PCR after 6-h treatment with EGF (A), HRG (B), and trastuzumab (C). Data are expressed as fold to untreated cells (dotted lines) and refer to independent experiments in BT474 (●), ZR75.30 (▲), and SKBr3 (■). D) CCL2 release upon stimulation with 20 ng/ml EGF and HRG for 24 h in BT474 (●) and SKBr3 (■) as evaluated by ELISA. Data are expressed as fold to untreated cells (dotted line) and refer to independent experiments. E) CCL2 gene expression in 50 HER2+ BC biopsies belonging to the GSE70360 dataset obtained before (pre) and after (post) treatment with one cycle of trastuzumab alone. p-value by paired t-test. F) Representative expression of HER2 and CCL2 in tumors derived from d16HER2 transgenic mice as evaluated by immunofluorescence. Scale bars: 10 μm. Right panel shows quantification of CCL2 positivity in HER2-positive and HER2-negative areas. Data are the means ± SD (n = 12). p-value by unpaired t-test.
In vitro changes of CXCL expression levels observed upon stimulation or blockage of ERBB2 receptor signaling mutually associated with ERBB2 mRNA modulation with a significant positive correlation between CXCL9, CXCL CXCL 11, and CXCL 13 and ERBB2 levels (Supplementary Fig. S3A). Moreover, HER2 mRNA levels directly and significantly correlated with CXCL9, CXCL 10, and CXCL 13 levels in tumors of the GHEA cohort (Supplementary Fig. S3B), suggesting the possible co-expression of these genes in tumor cells rather than the regulation of their expression by HER2.
Involvement of CCL2 expression in trastuzumab activity
To investigate the relevance of CCL2 production and monocyte recruitment by tumor cells in trastuzumab efficacy, FVB mice bearing human HER2+ mammary carcinoma cells (MI6) were treated with trastuzumab with or without a CCL2 blocking monoclonal antibody (aCCL2) that can reportedly raise circulating total CCL2.15,16 CCL2 plasma level was 10-fold higher in animals receiving blocking antibody than in untreated mice (Figure 4A), and in vitro recruitment of splenocytes by plasma of animals treated with aCCL2 compared to untreated was improved (Supplementary Fig. S4E). Based on these data, we analyzed whether the increment in CCL2 mirrored an increment in immune cells in the TME; accordingly, we observed an increase in the percentage of CD45+ cells in tumors treated with aCCL2 compared to untreated cells (Figure 4B) that was reflected in an increase in the number of monocytes/macrophages (CD11b+ F4/80+) (Figure 4C), T (CD3+) (Figure 4D), and NK (CD3− CD49b+) (Figure 4E) cells. Notably, treatment with anti CCL2 antibody resulted in a significantly improved trastuzumab inhibitory activity (Figure 4F). In addition, a significant positive correlation was found between circulating levels of CCL2 and immune cells within the TME (CD45+: r = 0.84, p = 0.0021; F4/80+: r = 0.79, p = 0.0065; CD3+: r = 0.91, p = 0.0002; CD49b+: r = 0.93, p = 0.0001; Supplementary Fig. S4A- B) in mice treated with or without aCCL2. Moreover, a direct correlation between circulating levels of CCL2 and tumor infiltrating CD11b+ F4/80+ cells was observed in animals treated with trastuzumab (r = 0.72, p = 0.0292), as well as a trend toward a positive correlation (r = 0.56, p = 0.0958) between the percentage of tumor growth inhibition induced by trastuzumab and the number of these cells (Supplementary Fig. S4C-D). Even though chemokine(s) other that CCL2 might have been increased upon treatment with aCCL2 and may take part in monocyte recruitment, these results strongly suggested that the efficacy of trastuzumab relies on CCL2 levels and monocytes present in the TME.
Figure 4.
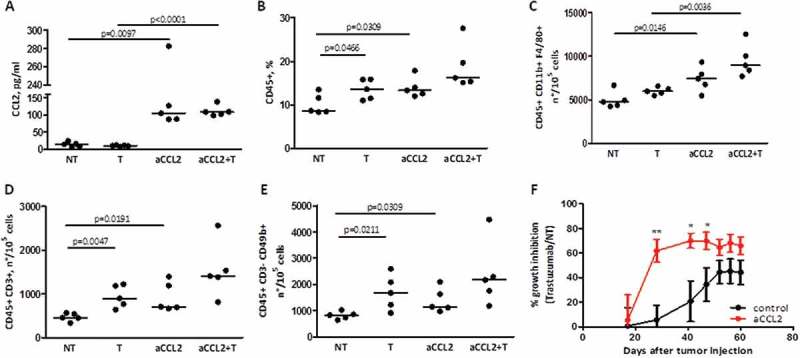
Correlation between CCL2 levels, monocyte infiltration in the TME, and trastuzumab activity. A) CCL2 protein quantification by ELISA in serum derived from FVB mice with MI6 tumors treated with or without a CCL2 blocking antibody (aCCL2) at 200 μg/mouse and/or trastuzumab at 5 mg/kg. p-values by unpaired t-test. B) Frequency of CD45+ cells in tumors derived from mice treated as in A, as evaluated by flow cytometry. p-values by unpaired t-test. C-E) Number of infiltrating macrophages (C), T cells (D), and NK cells (E) in FVB mice treated as in A. Shown are the numbers of each immune population calculated for 105 live cells, as determined by flow cytometry. p-values by unpaired t-test. F) Percentage of tumor growth inhibition by trastuzumab in mice treated with or without aCCL2. *p < 0.05 **p < 0.01, by unpaired t-test.
Regulation of CCL2 expression by HER2-downstream signals
To explore which HER2-mediated signal(s) was responsible for CCL2 expression, we focused on the RAS-MAPK and PI3K-AKT pathways, based on their known activation upon treatment with EGF and HRG, by treating SKBr3 and BT474 cells with MEK (UO126) or PI3K (LY294002) inhibitors (MEKi and PI3Ki). The activation of these pathways by EGF/HRG in our models and the activity of MEKi, PI3Ki, with respect to inhibiting the activation of target molecules were confirmed by western blot (WB) analysis of cell lysates obtained from treated cells (Supplementary Fig. S5). PI3Ki in SKBr3 upon treatment with EGF/HRG induced a reduction in CCL2 expression at both the mRNA and protein level (Figure 5A and 5B, respectively). Conversely, MEKi induced up-modulation of CCL2, likely owing to the described activation of Akt upon continuous blockage of MEK signals,17 as we also observed in our models (data not shown). Downstream of the PI3K-AKT pathway, BAY 11–7082, a NF-kB inhibitor, significantly reduced the CCL2 improvement mediated by EGF/HRG in SKBr3 cells (Figure 5A-B). These data were validated in BT474 cells (Figure 5C and Supplementary Fig. S5), pointing to the role of NF-kB downstream to the HER2 oncogene in the regulation of CCL2.
Figure 5.
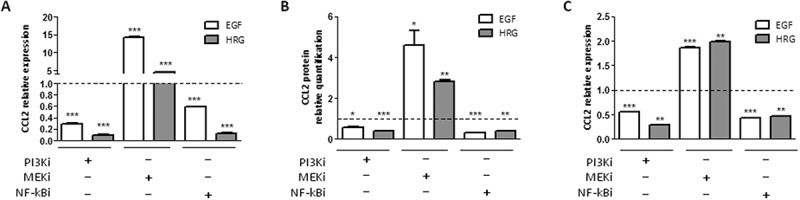
CCL2 expression is regulated by HER2 signaling in SKBr3 and BT474 cells. A-B) CCL2 mRNA (A) and protein (B) quantification by qRT-PCR and ELISA, respectively, in SKBr3 cells treated with EGF or HRG and/or with PI3Ki (LY294002), MEKi (UO126), or NF-kBi (BAY 11–7082) inhibitors for 6 h. C) CCL2 mRNA expression in BT474 cells treated as in A. Data are expressed as fold to EGF/HRG treated cells (dotted lines) and are representative of at least two experiments. *p < 0.05, **p < 0.01, ***p < 0.001 by unpaired t-test.
Based on i) the described inhibitory crosstalk between NF-kB and ER signaling,18 ii) the therapeutic activity of trastuzumab mainly in ER− tumors,3 iii) the low activity of ER in TRAR-low tumors (Figure 1A), and iv) the negative correlation between the activity of ER and CCL2 expression in tumors of the GHEA cohort (r = −0.36 p = 0.0082), we investigated whether ER might affect HER2-dependent production of CCL2 by inhibiting NF-kB activity. CCL2 expression was evaluated in HER2+ BC cell lines according to ER expression. Figure 6A shows the characterization of ER expression by WB (left panel) and activity, mirrored by progesterone receptor (PGR) expression as evaluated by qRT-PCR (right panel). In accordance with the literature,19 a higher transcriptional activity of NF-kB was observed in ER− cell lines (HCC1954, SKBr3, and MDAMB453) than ER+ lines (BT474, MDAMB361, and ZR75.30) (Figure 6B). Hence, CCL2 mRNA and protein levels were higher in ER− than ER+ cell lines (Figure 6C). Notably, treatment of ER+ cells (BT474 and ZR75.30) with fulvestrant, a selective ER down-regulator that induced down-modulation of ER expression and activity (Figure 6D and 6E), promoted an increase in NF-kB transcriptional activity (Figure 6F) and an enhancement of CCL2 expression (Figure 6G and 6H). These results support a role of ER-HER2 crosstalk in the production of CCL2 in HER2+ tumors.
Figure 6.
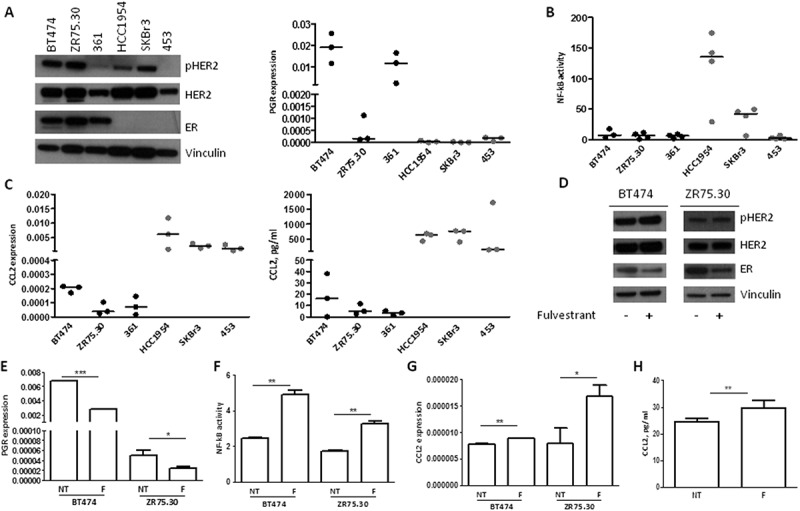
Inhibition of the production of CCL2 in HER2+ tumor cells by ER activity. A) Left panel: WB analysis of pHER2, HER2, and ER; right panel: qRT-PCR quantification of PGR mRNA in HER2 + BC cell lines maintained in standard medium conditions. All performed independent experiments are shown. B) NF-kB activity in HER2+ BC cell lines as determined by luciferase assay. All performed independent experiments are shown. C) CCL2 mRNA (left panel) and protein (right panel) quantification by qRT-PCR and ELISA, respectively, in HER2+ BC cell lines. All performed independent experiments are shown. D) WB analysis of pHER2, HER2, and ER in BT474 and ZR75.30 treated with or without 100 nM fulvestrant for 24 h. E-H) PGR mRNA quantification by qRT-PCR (E), NF-kB activity by luciferase assay (F), CCL2 mRNA quantification by qRT-PCR (G), and CCL2 protein quantification by ELISA (H) in BT474 and ZR75.30 cells treated with or without fulvestrant as in D. Data are representative of two experiments. *p < 0.05, **p < 0.01, ***p < 0.001 by unpaired t-test.
Regulation of PD-1 ligand expression by HER2-mediated signaling
Based on the PD-1 related immune escape mechanism of TRAR-low tumors (Figure 2C), we hypothesized that HER2 itself modulates the expression of PD-1 ligands in tumor cells to evade the immune control. HER2+ BC cells with detectable levels of PD-L1 by qRT-PCR (HCC1954 and SKBr3) were treated with EGF/HRG and analyzed for PD-1 ligand expression. EGF treatment induced an up-modulation of PD-L1 and PD-L2 in both cell lines both at the mRNA (Figure 7A) and protein level (Figure 7C and Supplementary Fig. S6), whereas HRG stimulated expression of these ligands, at a lower extent than EGF, only in SKBr3 cells (Figure 7 and Supplementary Fig. S6), probably because of the very low levels of the HRG receptor HER3 in HCC1954 cells (Supplementary Fig. S2). Reduction of HER2 signaling by trastuzumab or lapatinib was evaluated only in HCC1954 cells owing to their basal positivity for membrane-associated PD-L1 protein (Supplementary Fig. S6). HER2 signal inhibition significantly reduced the expression of PD-L1 and PD-L2 at both the mRNA and protein level (Figure 7B and 7C, respectively). Analysis of HCC1954 and SKBr3 cells with or without MEKi and PI3Ki treatment showed that the up-modulation of PD-1 ligands upon EGF/HRG treatment was mainly abrogated by MEKi (Figure 7D-F). Together, these results support that HER2 signaling, mainly through EGFR-HER2 heterodimerization, sustains expression of PD-1 ligands in tumor cells, which likely contributes to innate immune resistance.
Figure 7.
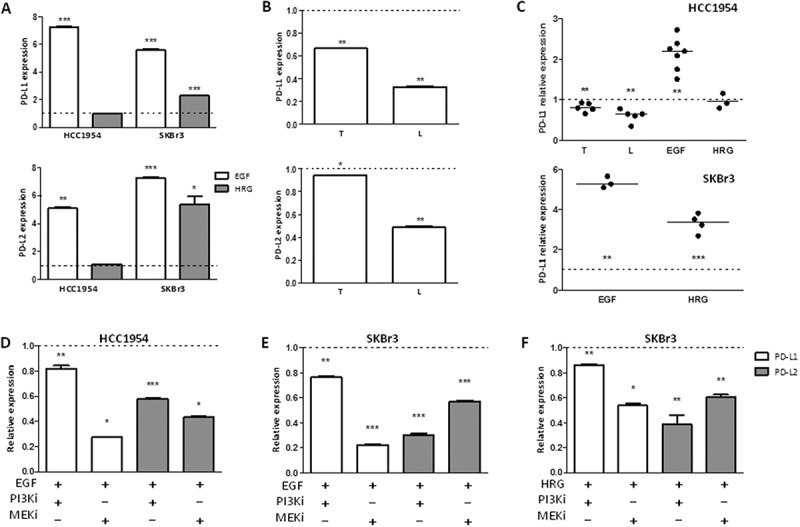
Regulation of the expression of PD-1 ligands by HER2 signaling in HCC1954 and SKBr3 cells. A) PDL1 (upper panel) and PDL2 (lower panel) mRNA expression in HCC1954 and SKBr3 cells treated with EGF or HRG for 6 h. B) PDL1 (upper panel) and PDL2 (lower panel) mRNA expression in HCC1954 cells treated with trastuzumab (T) or lapatinib (L) for 24 h. Data are the means ± SD of fold increase in treated vs untreated cells (dotted lines) and are representative of two experiments. *p < 0.05, **p < 0.01, ***p < 0.001 by unpaired t-test. C) Relative quantification of membrane-associated PD-L1 expression in HCC1954 (upper panel) and SKBr3 (lower panel) cells treated as in A and B. Each dot represents an independent experiment and represents the ratio between the percentages of PD-L1 positive cells in treated vs untreated cells (dotted lines). **p < 0.01, ***p < 0.001 by paired t-test D-F) Relative PD-L1 and PD-L2 expression in HCC1954 (D) and SKBr3 (E-F) cells. mRNA quantification in cells treated with EGF (D-E) or HRG (F) and/or with PI3Ki (LY294002) or MEKi (UO126) for 6 h. Data are expressed as fold to EGF/HRG treated cells and are representative of two experiments. *p < 0.05, **p < 0.01, ***p < 0.001 by unpaired t-test.
Discussion
In the present study, we provide evidence for the first time that activation of the HER2 oncogene induces the tumor cell production of CCL2 and the ability of CCL2 to recruit monocytes/macrophages at the tumor site eventually results in an improved trastuzumab-immune-mediated anti-tumor activity. Accordingly, tumors dependent on HER2 signaling and classified by our TRAR model as responsive to trastuzumab treatment (TRAR-low) were found to express higher levels of CCL2 and to be more infiltrated by CD68+ cells than non-HER2 addicted, trastuzumab resistant (TRAR-high) tumors. This supports the reported concept that trastuzumab, through its constant fragment Fc, mediates anti-tumor cytotoxic effects by rendering tumor cells recognizable by macrophages7,19 other than NK cells. Results obtained in an animal model using an anti-CCL2 monoclonal antibody, which indicated improved monocyte/macrophage (CD11b+ F4/80+) infiltration in the TME associated with higher trastuzumab anti-tumor inhibitory activity, supported the role of these immune cells in trastuzumab efficacy. However, we could not exclude that other CD68+ cells, such as dendritic cells, that are recruited by CCL220 might also infiltrate these tumors. As dendritic cells express the Fcγ receptor, they may also contribute to the responsiveness of TRAR-low tumors to trastuzumab by taking up tumor cell fragments opsonized by the antibody and priming CD4+ or CD8+ T lymphocytes.7
HER2-mediated production of CCL2 was found to be supported by the PI3K/AKT/NF-kB axis downstream of the oncogene, as demonstrated by the significant reduction in CCL2 expression at both the mRNA and protein level observed in BC cell lines upon treatment with PI3Ki and NF-kBi. Thus, an abnormal HER2 activation such as that occurring in tumors with HER2 amplification could generate an inflammatory environment, as has been described for other oncogenes such as RET/PTC1 in thyroid cancer,21 RAF in melanoma, and MYC in pancreatic tumors.22 Considering that the PI3K/AKT pathway is common to different membrane receptors, tumor cell signals other than HER2 may contribute to CCL2 expression albeit to a lesser extent in HER2-addicted BCs. In these tumors, signal derived from HER2 homodimerization and its heterodimerization with EGFR and HER3 would be the main driver of CCL2 production. Moreover, the low NF-kB activity in the presence of high expression of CCL2 as observed in MDAMB453 cells does not exclude that pathways other than PI3K/AKT may also be engaged in CCL2 regulation.
The improvement of CCL2 expression observed upon the degradation of ER by fulvestrant in HER2+/ER+ BC cell lines in addition to the higher NF-kB activation and expression at both the mRNA and protein level of CCL2 in HER2+/ER− compared to HER2+/ER+ BC cell lines support the role of ER in regulating HER2-driven CCL2 expression, in accordance with the inhibitory crosstalk between NF-kB and ER signaling.18 The demonstrated ER involvement in the regulation of CCL2 in HER2+ BC cells is consistent with the therapeutic activity of trastuzumab mainly in ER− tumors. Accordingly, NF-kB activation in BCs was found to be negatively associated with ER positivity.18 Specifically, among HER2+ tumors, only BCs strictly dependent on HER2 (ER−) showed activation of this pathway, whereas ER+ tumors were nearly all NF-kB negative.18 Moreover, HER2-E tumors in the TCGA dataset, which are mainly ER−, exhibit high activation of the HER2 downstream pathways,23 further supporting CCL2 regulation by HER2.
The high production of chemokines commonly associated with T-cell trafficking (CXCL9, CXCL10, and CXCL11) by TRAR-low tumor cells also suggests a role of tumor cells in the recruitment of adaptive immune cells in the TME. These CXCR3-ligands constitute the major chemokine axis enabling tumor infiltrating lymphocyte (TIL) entry into tumors,24 and have been associated with TIL infiltration in several tumor models.25 Moreover, increased CCL2 can also trigger T-cell recruitment through the macrophage ability to engulf and present antigens using MHC molecules, especially in the presence of trastuzumab by boosting antibody-dependent cellular phagocytosis-mediated killing of cancer cells.19 Subsequently, the IFN-γ produced by recruited stimulated lymphocytes, which has been described to be crucial for Th1 immunity and trastuzumab response,26 would in turn induce CXCLs in tumor cells followed by improved T cell-trafficking and maintenance of immune-enriched TME. Although tumor antigenicity derived from a high mutational burden, as demonstrated in patients with melanoma and lung cancer who respond to immune-checkpoint inhibitors,27-29 may also explain the infiltration of HER2+ BCs by adaptive immune cells, the low mutational burden of BCs compared to melanoma30 and the lack of association between the amount of neoantigens and TIL count or trastuzumab activity in tumors from patients enrolled in the FinHer trial31 do not support this possibility. Considering that CXCLs and HER2 mRNA levels are significantly positively correlated in HER2+ BC samples and in our in vitro models, it could be hypothesized that these molecules are co-regulated in trastuzumab responsive HER2-addicted tumors, the subgroup with the highest HER2 transcription.8 Moreover, as tumor cells have been shown to acquire the ability to produce growth-promoting chemokines and to express chemokine receptors,32 it is likely that high proliferating tumors, such as those addicted to HER2 signaling, may maintain their own growth in response to chemokine production. Thus, overall, chemokine expression by tumor cells appears to support the role of HER2 in the maintenance of a “hot immune” TME.
Irrespective of the recruiting mechanism, TRAR-low tumors contain a high number of T-cells likely to be specific for tumor-associated antigens, as indicated by clonal analyses and tetramer staining of CD8+ T cells isolated from human tumors.33 The concomitant high expression of PD-1 ligands in these tumors, as supported by in situ evaluation of their expression in tumor specimens of HER2+ BCs that showed higher PD-L1 and PD-L2 positivity in TRAR-low compared to TRAR-high tumors, may represent one of the mechanisms exploited by tumors cells to evade immune control. Unlike the situation in patients with melanoma, in whom PD-L1 expression was described as being a negative feedback mechanism that followed CD8+ T cell infiltration and depended on their presence34,35 the modulation of PD-1 ligands by HER2 signals that we demonstrated in BC cell lines suggests that in HER2+ BCs this immunosuppressive pathway is also directly orchestrated by cancer cells (i.e., innate immune evasion). Thus, the activity of trastuzumab in therapy-responsive tumors presumably relies on the antibody’s ability to relieve the suppression of recruited antitumor effector immunity. This speculation also implies that the combination of trastuzumab with immune checkpoint inhibitors would not be necessary in TRAR-low tumors, whereas it may represent a valuable strategy for non-responsive tumors. From a biological perspective, the direct shaping of the tumor immune milieu by HER2 that we observed potentially explains the reported ability of tumor addiction to HER2 as well as of immune infiltrating cells to predict disease outcome in trastuzumab-treated patients. The capability of HER2 to fashion an immune TME would also explain why the immune infiltration of the primary tumor is predictive of trastuzumab benefit even in an adjuvant setting, in which the tumor has been surgically removed and therapy is directed against micrometastatic tumor foci.
Together, the obtained results strongly support a connection between HER2 signaling, chemokine production, and immune cell infiltration of the TME, thus potentially explaining that HER2 activity per se is sufficient in realizing benefit from immune-mediated trastuzumab activity. Furthermore, the role of ER in inhibiting HER2-driven recruitment of immune cells mediated by NF-kB activation, in addition to elucidating the lower response to trastuzumab of HER2+/ER+ compared to HER2+/ER− BCs, suggests the relevance of ER in conditioning TME. This in turn may represent a starting point for a more targeted project considering the degradation of ER as a necessary step to increase the activity of immune-mediated trastuzumab in low responsive HER2+/ER+ BC patients.
Materials and methods
Patients
BCs of the GHEA cohort were previously described.9 All procedures were in accordance with the Helsinki Declaration (World Medical Association, 2013). Tumor specimens used for research consisted of leftover material of samples collected during standard surgical and medical approaches at Fondazione IRCCS Istituto Nazionale dei Tumori di Milano (INT). Aliquots were allocated to this study after approval by the Independent Ethical Committee of Fondazione IRCCS-INT.
Cell lines, culture, and treatments
Human breast cancer cell lines SKBr3, BT474, ZR75.30, MDAMB361, HCC1954, and MDAMB453 (American Type Culture Collection, ATCC) were used in this study. All cell lines were grown in a humidified chamber (95% air, 5% CO2) at 37°C and were authenticated using the short tandem repeat profiling method in our institute facility. SKBr3, ZR75.30, and HCC1954 were cultured in RPMI 1640 (Euroclone, ECB9006D); BT474, MDAMB361, and MDAMB453 were cultured in Dulbecco’s modified Eagle’s medium (Life Technologies, 41965–039). Each medium was supplemented with 10% fetal bovine serum (Thermo Fisher, 16000–036) and 1 mM L-glutamine (LONZA, BE17-605E). Cells were starved in serum-free medium (0.1% for SKBr3 and HCC1954) for 48 h and treated with 20 ng/ml EGF or HRG (Peprotech) for different time points. We used 10 μg/ml Trastuzumab, 0.3 μM lapatinib, and 10 μM LY294002 (BioMol, L7751), UO126 (Sigma-Aldrich, #19147), and BAY 11–7082 (Santa Cruz Biotechnology, SC202490) as described.36 ER activity was blocked using 100 nM fulvestrant (ICI 182–780, I4409, Sigma-Aldrich).
RNA extraction and qRT-PCR
Total RNA was extracted from cell lines with QIAzol reagent (Qiagen, 79306) according to the manufacturer’s instructions. cDNAs were reversed transcribed from 1 μg of total RNA in a 20-μl volume using a High Capacity RNA to cDNA kit (Thermo Fisher, P/N 4387406). qRT-PCR was performed using TaqMan probe-based assays (CXCL9: Hs.00171065_m1, CXCL10: Hs.01124251_g1, CXCL11: Hs.04187682_g1, CXCL13: Hs.00757930_m1, CCL2: Hs.00234140_m1, CCL5: Hs.00982282_m1, CCL22: Hs.01574247_m1; PD-L1: Hs.01125301_m1, PD-L2: Hs.01057777_m1, ERBB2: Hs01007077_m1, PGR: Hs00172183_m1, GAPDH: Hs.02758991_g1) and the TaqMan Fast Universal PCR Master Mix (P/N 4352042) with the ABI Prism 7900HT sequence detection system (Thermo Fisher). Relative abundances of transcripts were calculated by the comparative Ct method using GAPDH as a reference gene.
Western blotting
Protein fractions were extracted from BC cell lines with TNTG lysis buffer as described.37 The following primary antibodies were used: rabbit polyclonal antibodies against phospho-HER2 (Tyr1248, SC12352), HER3 (SC285), ERα (SC543) (Santa Cruz Biotechnology), Akt (#9272) and phospho-Akt (Ser473, #4060), NF-kB (#4764) and phospho-NF-kB (Ser536, #3033), EGFR (#1005), p44/42 MAPK (#9102) and phospho-p44/42 (Thr202/Tyr204, #9101) (Cell Signaling Technology); mouse monoclonal antibodies anti-HER2, clone Ab3 (Calbiochem, OP15); anti-vinculin, clone hVIN-1 (Sigma Aldrich, V9131). Polyclonal anti-rabbit (NA9340V) or anti–mouse (NA931V) IgG horseradish peroxidase (HRP) (Amersham GE Healthcare) was used as a secondary antibody. Protein expression was normalized to that of vinculin.
Flow cytometry
Direct immunofluorescence (IF) on cells derived from digestion of murine mammary carcinomas with collagenase (300 U/ml) and hyaluronidase (100 U/ml) (StemCell Technologies, #07912) was performed as described.38 Cells were stained with the following antibodies: CD45APCeFluor780 (30-F11, eBioscience), CD11bPE (MI/70, BD Bioscience), F4/80PerCpCy5.5 (BM8, eBioscience), CD3FITC (17A2, Miltenyi Biotec), and CD49bPE (DX5, Miltenyi Biotec). Purified rat anti-mouse CD16/CD32 monoclonal (93, eBioscience) was used to prevent non-specific binding to mouse Fc receptors. Direct IF on human BC cell lines to evaluate PD-L1 expression was performed by staining cells with PE-anti-PD-L1 mouse monoclonal antibodies (MIH1, eBioscience). Samples were analyzed by gating on live cells after doublet exclusion using the FACSCanto system (BD Bioscience) and FlowJo software (Tree Star Inc.).
ELISA assay
Soluble CCL2 was quantified in BC cell supernatants and in plasma derived from mice using human and mouse DuoSet ELISA kits, respectively (DY279 and DY479, R&D Systems), following the manufacturer’s instructions. ELISA detection was performed using 100 μl of cell culture supernatants and 50 μl of plasma samples.
Migration assay
Total splenocytes from healthy mice were obtained as described38 and subjected to a migration assay for 3 h using a Boyden chamber with a 3-μm filter (Corning, 3415). Plasma obtained at the end of the experiment from mice treated or not with anti-CCL2 antibody were pooled and used as chemoattractant. Cells that had migrated into the lower chamber were counted.
Luciferase assay
NF-kB luciferase assay was performed using the Nano-Glo® Dual-Luciferase Reporter Assay (NanoDLR®, N1610) according to manufacturer’s instructions. In detail, cells were co-transfected using Lipofectamine 3000® (Life Technologies, L3000-008) with pNL3.2 NF-kB-RE reporter and pGL4.54 control vector (Promega, N111A and E849A). At 24 h after transfection, luciferase activities were measured in cell lysates using a GLOMAX 20/20 luminometer (Promega).
Immunohistochemistry (IHC)
IHC was performed on FFPE tissue. Slides were deparaffinized, serially rehydrated, subjected to antigen retrieval at 96°C for 6 min using 10 mM citrate buffer, pH 6.0, and stained with primary antibodies. The following antibodies were used: rabbit polyclonal anti human CXCL9 (1:100, NBPI-31155, Novus Biologicals), rabbit polyclonal anti human CXCL10 (1:100, ab47045, Abcam), mouse anti human CCL2 (1:1000, mab2791, R&D Systems) rabbit polyclonal anti mouse CCL2 (1:1000, ab2512, Abcam), rabbit polyclonal anti HER2 (1:100, AO485, Dako Agilent Technologies), mouse anti human CD68 (1:100, KP1 clone, NB100-683, Novus Biologicals; 1:50, PGM1 clone, M0876, Dako Agilent Technologies), mouse anti human CD33 (1:100, CD33-L-CE, Leica Biosystems), rat anti human FOXP3 (1:20, PCH101 clone, 14–4776-80 eBioscience), rabbit polyclonal anti human PD-L1 (1:100, ab58810, Abcam), and rabbit polyclonal anti human PD-L2 (1:400, AP30656PU-N, Acris antibodies). PD-L2 IHC was performed as described.39 Immunoreactions were visualized using streptavidin-biotin-peroxidase (Dako Agilent Technologies, E0432, E0433, P0397) and the DAB Chromogen System (Dako Agilent Technologies, K3468) followed by counterstaining with Carazzi hematoxylin. Positive tumors contained cell cytoplasmic chemokine staining in at least 10% of tumor or stromal cells, as described.40 Any PD-L1 and PD-L2 staining in tumor cells was considered positive, as described.41 The numbers of CD68+, FOXP3+, and CD33+ cells were counted in three-fields at 40X (CD68) and 20X magnification. Only CD33+ cells in contact with tumor cells were counted. Blind-coded sections were scored by two independent investigators.
Murine tumor tissues were analyzed for HER2 and CCL2 expression by immunofluorescence. Sample imaging was performed using a Leica TCS-SP8-X confocal laser scanning microscope. The fluorochrome in the immunofluorescence analysis was excited by a pulsed super continuum White Light Laser (470–670 nm; 1 nm tuning step size). In particular, CCL2 was visualized using an AlexaFluor-488 conjugated secondary antibody (Thermo Fisher, R37116) excited with a 499 nm-laser line and detected at 504 to 561 nm; HER2 was used after labeling with a Zenon AlexaFluor-546 rabbit IgG labeling kit (Thermo Fisher, Z25304) and excited with a 557 nm laser line and detected at 562 to 642 nm; and nuclei were visualized using DAPI (Thermo Fisher, D3571) excited with a 405-nm diode laser and detected at 422 to 488 nm. The images were acquired in the scan format 1024 × 1024 using an HC PL APO 40X/1.3 CS2 oil immersion objective and a pinhole set to 1 Airy unit. The data were analyzed using Leica LAS-X rel.3.1.1 software (Leica Microsystems GmbH). CCL2 positivity was calculated as the positive area of fixed-size regions (n = 12) manually selected according to HER2-positivity.
In vivo experiments
Female FVB mice (6- to 8-weeks old; body weight: 20–25 g; Charles River) were maintained in laminar-flow rooms at constant temperature and humidity, with food and water provided ad libitum. Experimental protocols used for animal studies were approved by the Ethics Committee for Animal Experimentation of Fondazione IRCCS-INT in accordance with institutional guidelines. FVB mice were injected into the mammary fat pad with 1 × 10⁶ MI6 cells, a murine mammary breast carcinoma cell line derived from transgenic mice overexpressing the human d16HER2 isoform.15 When tumors were palpable, mice were randomized into two groups to receive three weekly i.p. injections of CCL2 blocking antibodies (aCCL2) (200 μg/mouse, BE0185, BioXCell) or control solution. After two doses of aCCL2, mice in each group were randomized into two groups (n = 5/group) to receive biweekly i.p. injections of 5 mg/kg trastuzumab or control solution until the end of the experiment. Tumors in the control groups received the diluent NaCl solution (0.9%). Tumors were calibrated twice weekly and tumor volume was calculated as 0.5 × d12 × d2, where d1 and d2 represent the smaller and larger diameters, respectively.
Bioinformatics and statistical analysis
Bioinformatics analyses were performed using the BrB-ArrayTool (v4.2.0, http://linus.nci.nih.gov/BRB-ArrayTools.html). Cluster analysis was performed using Cluster 3.0 and visualized with Java TreeView applications. Analyses were performed on BC of the GHEA cohort (GSE55348).9 Chemokine expression in patients of the GHEA dataset was analyzed by calculating the mean of the normalized expression values of all chemokines of the dataset (Supplementary Table S1). Genes significantly up-modulated in human M1 and in M2-polarized macrophages,42 respectively and genes of the LM22 Cibersort list43 were analyzed as M1 and M2 gene patterns (Supplementary Table S3) in the GHEA dataset by ssGSEA, as described.44 ERS score was calculated as described.11 CCL2 expression was analyzed in silico in the GSE70360 public dataset14 with processed data retrieved from the GEO repository.
Differences between groups were determined using a two-tailed Student’s t-test. Association among categorical variables was tested by Fisher’s exact test and correlation between continuous variable by a Pearson correlation analysis. Differences were considered significant at p < 0.05. Analyses were performed using GraphPad Prism 5 (GraphPad Software).
Funding Statement
This work was supported by Associazione Italiana per la Ricerca sul Cancro (AIRC) (E.T ID.15359). TT was the recipient of a fellowship from Società Italiana di Cancerologia and Fondazione Pezcoller.
Acknowledgments
The authors thank the Conventional and Confocal Microscopy Facility for confocal image acquisition, the Flow Cytometry Facility for flow cytometry analyses, and the Immunohistochemistry Facility for paraffin sections. We also thank Dr. Claudio Tripodo (University of Palermo) for providing the PD-L2 antibody and the methodology for its use, and Editage (www.editage.com) for English language editing.
Authors’ disclosures of potential conflicts of interest
The authors declare no potential conflicts of interest.
Supplementary Material
Supplemental data for this article can be accessed here.
References
- 1.Valachis A, Mauri D, Polyzos NP, Chlouverakis G, Mavroudis D, Georgoulias V.. Trastuzumab combined to neoadjuvant chemotherapy in patients with HER2-positive breast cancer: a systematic review and meta-analysis. Breast. 2011;20:485–490. doi: 10.1016/j.breast.2011.06.009. [DOI] [PubMed] [Google Scholar]
- 2.Dahabreh IJ, Linardou H, Siannis F, Fountzilas G, Murray S. Trastuzumab in the adjuvant treatment of early-stage breast cancer: a systematic review and meta-analysis of randomized controlled trials. Oncologist. 2008;13:620–630. doi: 10.1634/theoncologist.2008-0001. [DOI] [PubMed] [Google Scholar]
- 3.Triulzi T, Bianchi GV, Tagliabue E. Predictive biomarkers in the treatment of HER2-positive breast cancer: an ongoing challenge. Future Oncol. 2016;12:1413–1428. doi: 10.2217/fon-2015-0025. [DOI] [PubMed] [Google Scholar]
- 4.Prat A, Bianchini G, Thomas M, Belousov A, Cheang MC, Koehler A, Gómez P, Semiglazov V, Eiermann W, Tjulandin S, et al. Research-based PAM50 subtype predictor identifies higher responses and improved survival outcomes in HER2-positive breast cancer in the NOAH study. Clin Cancer Res. 2014;20:511–521. doi: 10.1158/1078-0432.CCR-13-0239. [DOI] [PubMed] [Google Scholar]
- 5.Fumagalli D, Venet D, Ignatiadis M, Azim HA Jr., Maetens M, Rothe F, Salgado R, Bradbury I, Pusztai L, Harbeck N, et al. RNA sequencing to predict response to neoadjuvant Anti-HER2 therapy: a secondary analysis of the NeoALTTO randomized clinical trial. JAMA Oncol. 2017; 3:227–234. doi: 10.1001/jamaoncol.2016.3824. [DOI] [PMC free article] [PubMed] [Google Scholar]
- 6.Bianchini G, Gianni L. The immune system and response to HER2-targeted treatment in breast cancer. Lancet Oncol. 2014;15:e58–68. doi: 10.1016/S1470-2045(13)70477-7. [DOI] [PubMed] [Google Scholar]
- 7.Kroemer G, Senovilla L, Galluzzi L, André F, Zitvogel L. Natural and therapy-induced immunosurveillance in breast cancer. Nat Med. 2015;21:1128–1138. doi: 10.1038/nm.3944. [DOI] [PubMed] [Google Scholar]
- 8.Di Modica M, Tagliabue E, Triulzi T. Predicting the efficacy of HER2-targeted therapies: a look at the host. Dis Markers. 2017;2017:7849108. doi: 10.1155/2017/7849108. [DOI] [PMC free article] [PubMed] [Google Scholar]
- 9.Triulzi T, De Cecco L, Sandri M, Prat A, Giussani M, Paolini B, Carcangiu ML, Canevari S, Bottini A, Balsari A, et al. Whole-transcriptome analysis links trastuzumab sensitivity of breast tumors to both HER2 dependence and immune cell infiltration. Oncotarget. 2015;6:28173–28182. doi: 10.18632/oncotarget.4405. [DOI] [PMC free article] [PubMed] [Google Scholar]
- 10.Borrello MG, Degl’Innocenti D, Pierotti MA. Inflammation and cancer: the oncogene-driven connection. Cancer Lett. 2008;267:262–270. [DOI] [PubMed] [Google Scholar]
- 11.Bianchini G, Pusztai L, Karn T, Iwamoto T, Rody A, Kelly C, Müller V, Schmidt S, Qi Y, Holtrich U, et al. Proliferation and estrogen signaling can distinguish patients at risk for early versus late relapse among estrogen receptor positive breast cancers. Breast Cancer Res. 2013;15:R86. doi: 10.1186/bcr3481. [DOI] [PMC free article] [PubMed] [Google Scholar]
- 12.Franciszkiewicz K, Boissonnas A, Boutet M, Combadiere C, Mami-Chouaib F. Role of chemokines and chemokine receptors in shaping the effector phase of the antitumor immune response. Cancer Res. 2012;72:6325–6332. doi: 10.1158/0008-5472.CAN-12-2027. [DOI] [PubMed] [Google Scholar]
- 13.Pardoll DM. The blockade of immune checkpoints in cancer immunotherapy. Nat Rev Cancer. 2012;12:252–264. doi: 10.1038/nrc3239. [DOI] [PMC free article] [PubMed] [Google Scholar]
- 14.Varadan V, Gilmore H, Miskimen KL, Tuck D, Parsai S, Awadallah A, Krop IE, Winer EP, Bossuyt V, Somlo G, et al. Immune signatures following single dose trastuzumab predict pathologic response to preoperative trastuzumab and chemotherapy in HER2-positive early breast cancer. Clin Cancer Res. 2016;22:3249–3259. doi: 10.1158/1078-0432.CCR-15-2021. [DOI] [PMC free article] [PubMed] [Google Scholar]
- 15.Castagnoli L, Iezzi M, Ghedini GC, Ciravolo V, Marzano G, Lamolinara A, Zappasodi R, Gasparini P, Campiglio M, Amici A, et al. Activated d16HER2 homodimers and Src kinase mediate optimal efficacy for trastuzumab. Cancer Res. 2014;74:6248–6259. doi: 10.1158/0008-5472.CAN-14-0983. [DOI] [PubMed] [Google Scholar]
- 16.Haringman JJ, Gerlag DM, Smeets TJ, Baeten D, van den Bosch F, Bresnihan B, Breedveld FC, Dinant HJ, Legay F, Gram H, et al. A randomized controlled trial with an anti-CCL2 (anti-monocyte chemotactic protein 1) monoclonal antibody in patients with rheumatoid arthritis. Arthritis Rheum. 2006;54:2387–2392. doi: 10.1002/art.21975. [DOI] [PubMed] [Google Scholar]
- 17.Yao M, Smart C, Hu Q, Cheng N. Continuous delivery of neutralizing antibodies elevate CCL2 levels in mice bearing MCF10CA1d breast tumor xenografts. Transl Oncol. 2017;10:734–743. doi: 10.1016/j.tranon.2017.06.009. [DOI] [PMC free article] [PubMed] [Google Scholar]
- 18.Turke AB, Song Y, Costa C, Cook R, Arteaga CL, Asara JM, Engelman JA. MEK inhibition leads to PI3K/AKT activation by relieving a negative feedback on ERBB receptors. Cancer Res. 2012;72:3228–3237. doi: 10.1158/0008-5472.CAN-11-3747. [DOI] [PMC free article] [PubMed] [Google Scholar]
- 19.Biswas DK, Shi Q, Baily S, Strickland I, Ghosh S, Pardee AB, Iglehart JD. NF-kappa B activation in human breast cancer specimens and its role in cell proliferation and apoptosis. Proc Natl Acad Sci U S A. 2004;101:10137–10142. doi: 10.1073/pnas.0403621101. [DOI] [PMC free article] [PubMed] [Google Scholar]
- 20.Shi Y, Fan X, Deng H, Brezski RJ, Rycyzyn M, Jordan RE, Strohl WR, Zou Q, Zhang N, An Z. Trastuzumab triggers phagocytic killing of high HER2 cancer cells in vitro and in vivo by interaction with Fcgamma receptors on macrophages. J Immunol. 2015;194:4379–4386. doi: 10.4049/jimmunol.1402891. [DOI] [PubMed] [Google Scholar]
- 21.Ma Y, Mattarollo SR, Adjemian S, Yang H, Aymeric L, Hannani D, Portela Catani JP, Duret H, Teng MW, Kepp O, et al. CCL2/CCR2-dependent recruitment of functional antigen-presenting cells into tumors upon chemotherapy. Cancer Res. 2014;74:436–445. doi: 10.1158/0008-5472.CAN-13-1265. [DOI] [PubMed] [Google Scholar]
- 22.Borrello MG, Alberti L, Fischer A, Degl’Innocenti D, Ferrario C, Gariboldi M, Marchesi F, Allavena P, Greco A, Collini P, et al. Induction of a proinflammatory program in normal human thyrocytes by the RET/PTC1 oncogene. Proc Natl Acad Sci U S A. 2005;102:14825–14830. doi: 10.1073/pnas.0503039102. [DOI] [PMC free article] [PubMed] [Google Scholar]
- 23.Mantovani A, Allavena P, Sica A, Balkwill F. Cancer-related inflammation. Nature. 2008;454:436–444. doi: 10.1038/nature07205. [DOI] [PubMed] [Google Scholar]
- 24.Cancer Genome Atlas Network Comprehensive molecular portraits of human breast tumours. Nature. 2012;490:61–70. doi: 10.1038/nature11412. [DOI] [PMC free article] [PubMed] [Google Scholar]
- 25.Peske JD, Woods AB, Engelhard VH. Control of CD8 T-cell infiltration into tumors by vasculature and microenvironment. Adv Cancer Res. 2015;128:263–307. doi: 10.1016/bs.acr.2015.05.001. [DOI] [PMC free article] [PubMed] [Google Scholar]
- 26.Sharma RK, Chheda ZS, Jala VR, Haribabu B. Regulation of cytotoxic T-Lymphocyte trafficking to tumors by chemoattractants: implications for immunotherapy. Expert Rev Vaccines. 2015;14:537–549. doi: 10.1586/14760584.2015.982101. [DOI] [PubMed] [Google Scholar]
- 27.Nocera NF, Lee MC, De La Cruz LM, Rosemblit C, Czerniecki BJ. Restoring lost anti-HER-2 Th1 immunity in Breast Cancer: a crucial role for Th1 cytokines in therapy and prevention. Front Pharmacol. 2016;7:356. doi: 10.3389/fphar.2016.00323. [DOI] [PMC free article] [PubMed] [Google Scholar]
- 28.Van Allen EM, Miao D, Schilling B, Shukla SA, Blank C, Zimmer L, Sucker A, Hillen U, Foppen MH, Goldinger SM, et al. Genomic correlates of response to CTLA-4 blockade in metastatic melanoma. Science. 2015;350:207–211. doi: 10.1126/science.aad0095. [DOI] [PMC free article] [PubMed] [Google Scholar]
- 29.McGranahan N, Furness AJ, Rosenthal R, Ramskov S, Lyngaa R, Saini SK, Jamal-Hanjani M, Wilson GA, Birkbak NJ, Hiley CT, et al. Clonal neoantigens elicit T cell immunoreactivity and sensitivity to immune checkpoint blockade. Science. 2016;351:1463–1469. doi: 10.1126/science.aaf1490. [DOI] [PMC free article] [PubMed] [Google Scholar]
- 30.Snyder A, Makarov V, Merghoub T, Yuan J, Zaretsky JM, Desrichard A, Walsh LA, Postow MA, Wong P, Ho TS, et al. Genetic basis for clinical response to CTLA-4 blockade in melanoma. N Engl J Med. 2014;371:2189–2199. doi: 10.1056/NEJMoa1406498. [DOI] [PMC free article] [PubMed] [Google Scholar]
- 31.Schumacher TN, Schreiber RD. Neoantigens in cancer immunotherapy. Science. 2015;348:69–74. doi: 10.1126/science.aaa4971. [DOI] [PubMed] [Google Scholar]
- 32.Savas P, Salgado R, Denkert C, Sotiriou C, Darcy PK, Smyth MJ, Loi S. Clinical relevance of host immunity in breast cancer: from TILs to the clinic. Nat Rev Clin Oncol. 2016;13:228–241. doi: 10.1038/nrclinonc.2015.215. [DOI] [PubMed] [Google Scholar]
- 33.Palacios-Arreola MI, Nava-Castro KE, Castro JI, Garcia-Zepeda E, Carrero JC, Morales-Montor J. The role of chemokines in breast cancer pathology and its possible use as therapeutic targets. J Immunol Res. 2014;2014:849720. doi: 10.1155/2014/849720. [DOI] [PMC free article] [PubMed] [Google Scholar]
- 34.Whiteside TL. The tumor microenvironment and its role in promoting tumor growth. Oncogene. 2008;27:5904–5912. doi: 10.1038/onc.2008.271. [DOI] [PMC free article] [PubMed] [Google Scholar]
- 35.Spranger S, Spaapen RM, Zha Y, Williams J, Meng Y, Ha TT, Gajewski TF. Up-regulation of PD-L1, IDO, and T(regs) in the melanoma tumor microenvironment is driven by CD8(+) T cells. Sci Transl Med. 2013;5:200ra116. doi: 10.1126/scitranslmed.3006504. [DOI] [PMC free article] [PubMed] [Google Scholar]
- 36.Taube JM, Anders RA, Young GD, Xu H, Sharma R, McMiller TL, Chen S, Klein AP, Pardoll DM, Topalian SL, et al. Colocalization of inflammatory response with B7-h1 expression in human melanocytic lesions supports an adaptive resistance mechanism of immune escape. Sci Transl Med. 2012;4:127ra37. doi: 10.1126/scitranslmed.3003689. [DOI] [PMC free article] [PubMed] [Google Scholar]
- 37.Patel Y, Shah N, Lee JS, Markoutsa E, Jie C, Liu S, Botbyl R, Reisman D, Xu P, Chen H. A novel double-negative feedback loop between miR-489 and the HER2-SHP2-MAPK signaling axis regulates breast cancer cell proliferation and tumor growth. Oncotarget. 2016;7:18295–18308. doi: 10.18632/oncotarget.7577. [DOI] [PMC free article] [PubMed] [Google Scholar]
- 38.Bianchi F, Sasso M, Turdo F, Beretta GL, Casalini P, Ghirelli C, Sfondrini L, Ménard S, Tagliabue E, Campiglio M. Fhit nuclear import following EGF stimulation sustains proliferation of Breast Cancer cells. J Cell Physiol. 2015;230:2661–2670. doi: 10.1002/jcp.24968. [DOI] [PubMed] [Google Scholar]
- 39.Le Noci V, Tortoreto M, Gulino A, Storti C, Bianchi F, Zaffaroni N, Tripodo C, Tagliabue E, Balsari A, Sfondrini L. Poly(I:C) and CpG-ODN combined aerosolization to treat lung metastases and counter the immunosuppressive microenvionment. OncoImmunology. 2015;4:e1040214. doi: 10.1080/2162402X.2015.1008371. [DOI] [PMC free article] [PubMed] [Google Scholar]
- 40.Laginestra MA, Tripodo C, Agostinelli C, Motta G, Hartmann S, Döring C, Rossi M, Melle F, Sapienza MR, Tabanelli V, et al. Distinctive histogenesis and immunological microenvironment based on transcriptional profiles of follicular dendritic cell sarcomas. Mol Cancer Res. 2017;15:541–552. doi: 10.1158/1541-7786.MCR-16-0301. [DOI] [PubMed] [Google Scholar]
- 41.Bonapace L, Coissieux MM, Wyckoff J, Mertz KD, Varga Z, Junt T, Bentires-Alj M. Cessation of CCL2 inhibition accelerates breast cancer metastasis by promoting angiogenesis. Nature. 2014;515:130–133. doi: 10.1038/nature13862. [DOI] [PubMed] [Google Scholar]
- 42.Bianchini G, Pusztai L, Pienkowski T, Im YH, Bianchi GV, Tseng LM, Liu MC, Lluch A, Galeota E, Magazzu D, et al. Immune modulation of pathologic complete response after neoadjuvant HER2-directed therapies in the NeoSphere trial. Ann Oncol. 2015;26:2429–2436. doi: 10.1093/annonc/mdv395. [DOI] [PubMed] [Google Scholar]
- 43.Martinez FO, Gordon S, Locati M, Mantovani A. Transcriptional profiling of the human monocyte-to-macrophage differentiation and polarization: new molecules and patterns of gene expression. J Immunol. 2006;177:7303–7311. [DOI] [PubMed] [Google Scholar]
- 44.Newman AM, Liu CL, Green MR, Gentles AJ, Feng W, Xu Y, Hoang CD, Diehn M, Alizadeh AA. Robust enumeration of cell subsets from tissue expression profiles. Nat Methods. 2015;12:453–457. doi: 10.1038/nmeth.3337. [DOI] [PMC free article] [PubMed] [Google Scholar]
- 45.Barbie DA, Tamayo P, Boehm JS, Kim SY, Moody SE, Dunn IF, Schinzel AC, Sandy P, Meylan E, Scholl C, et al. Systematic RNA interference reveals that oncogenic KRAS-driven cancers require TBK1. Nature. 2009;462:108–112. doi: 10.1038/nature08460. [DOI] [PMC free article] [PubMed] [Google Scholar]
Associated Data
This section collects any data citations, data availability statements, or supplementary materials included in this article.