Abstract

A pathological hallmark of Huntington’s disease (HD) is the formation of neuronal protein deposits containing mutant huntingtin fragments with expanded polyglutamine (polyQ) domains. Prior studies have shown the strengths of solid-state NMR (ssNMR) to probe the atomic structure of such aggregates, but have required in vitro isotopic labeling. Herein, we present an approach for the structural fingerprinting of fibrils through ssNMR at natural isotopic abundance (NA). These methods will enable the spectroscopic fingerprinting of unlabeled (e.g., ex vivo) protein aggregates and the extraction of valuable new long-range 13C–13C distance constraints.
Protein aggregates that are the hallmark of many incurable protein-misfolding disorders continue to be challenging targets for structural studies. However, knowledge of their structures is essential to understand the molecular mechanism of protein misfolding and aggregation.1 Magic angle spinning (MAS) ssNMR has provided not only high-resolution structures of protein fibrils but also unique and crucial insights into the atomic-level underpinnings of polymorphic aggregated states.2,3 The latter studies directly compare 1D and 2D spectra of distinct fiber polymorphs, as “spectroscopic fingerprints”, taking advantage of the structural sensitivity of NMR chemical shifts. Thus far, these experiments rely on multidimensional correlation spectroscopy applied to polypeptides with 13C/15N isotope enrichment, which limits or prevents applications to samples that are hard or impossible to label, such as patient- or animal-derived materials.
Here, an approach for determining high-resolution structural fingerprints of protein aggregates at NA is presented and shows how the absence of isotopic enrichment is a substantial advantage for these kinds of structure-based analyses. This approach is demonstrated on neurotoxic aggregates formed by the first exon of mutant huntingtin protein (with 44 Gln residues; Q44-HttEx1) and a peptide-based model of its polyQ core (D2Q15K2), both at NA (Figure 1a). Notably, we report for the first time the extraction of long-range 13C–13C distances on protein fibrils at NA, yielding intermolecular constraints that map out the core arrangement of Q44-HttEx1 fibrils. These measurements are enabled both by the dilute network of NA 13C spins (1.1%) and by enhancing sensitivity with dynamic nuclear polarization (DNP).
Figure 1.

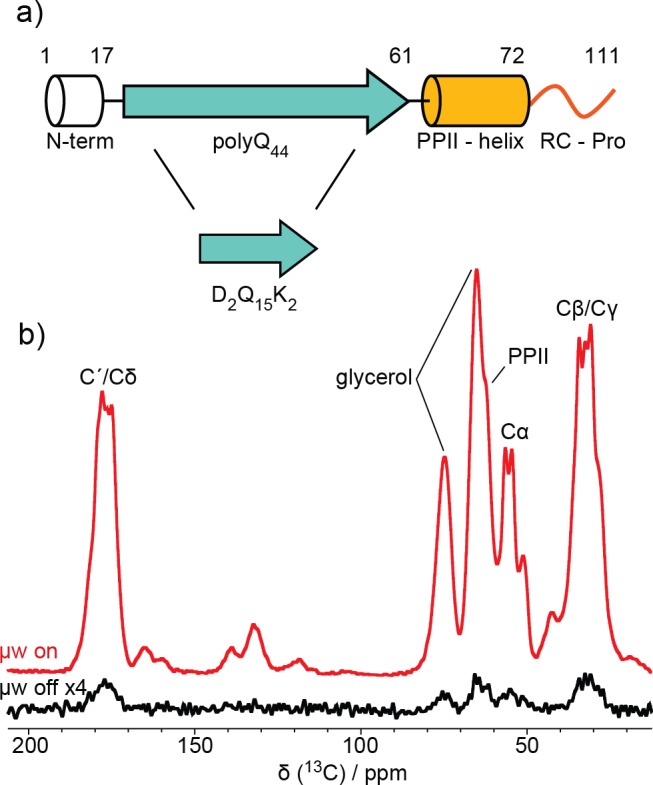
(a) Secondary structure schematic of Q44-HttEx1 and D2Q15K2. (b) 13C spectra of Q44-HttEx1 with and without μw irradiation. The polyQ and PPII-helix resonances are labeled.
PolyQ expansion diseases, such as HD, are caused by an autosomal dominant genetic mutation that leads to an expanded CAG trinucleotide repeat in affected genes.4 Expansion beyond 35 Gln residues in Htt causes the misfolding and aggregation of fragments of the protein in HD patients’ neurons.4In vitro, mutant HttEx1 forms amyloid-like fibrils that are toxic to neurons, with the aggregation conditions dictating differences in both structure and toxicity.2,3,5,6In vivo, the cellular milieu likely influences aggregate formation.3,6−8 Cryo-EM studies on cellular HttEx1 aggregates revealed a fibril morphology reminiscent of those obtained in vitro, but were unable to provide the atomic-resolution structural data needed for a direct comparison, due to the heterogeneity of the fibrils.9
Given the correlations between the structure of aggregate polymorphs and their cytotoxicity, it is of great importance to develop approaches that probe structural polymorphisms between aggregates directly from heterogeneous sources, including neuronal cell tissues, model animals, and patients. Here, we show how DNP-ssNMR enables 13C–13C and 13C–15N correlation spectra to be recorded at NA, providing spectral fingerprints, which had previously required isotopic labeling.6,7 Beyond chemical-shift-based fingerprinting, we show how DNP-enabled studies of aggregates at NA open up exciting possibilities for powerful structural measurements. The simplified spin–spin interactions at NA (i.e., without dipolar truncation),10−13 enable local and long-range distance measurements, not possible in densely isotopically enriched samples, thus allowing comparisons of local and supramolecular structures between fibril polymorphs. Combined, the chemical-shift analysis and distance information provide a rich structural fingerprint. The enhanced sensitivity necessary to enable these demanding studies is provided by MAS DNP,14,15 in which the inherently larger polarization of unpaired electrons is transferred to nuclei using suitable microwave (μw) irradiation.16,17
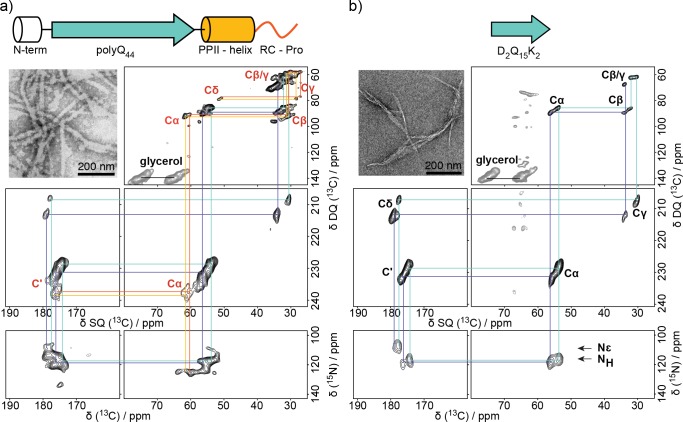
Here the enhanced sensitivity afforded by DNP translates into a 50-fold enhancement of the ssNMR signals of HttEx1 protein aggregates (Figure 1b). With the aid of this enhancement, we can determine the 13C and 15N connectivities in 2D spectra that provide a one-bond spectral fingerprint of the sample (Figure 2a). Distinct signals in this NA fingerprint define the amyloid core and the oligoproline regions of Q44-HttEx1. In the double quantum (DQ) single quantum (SQ) 13C–13C correlation experiment and heteronuclear 13C–15N correlation spectrum (Figure 2), two types of spectroscopically inequivalent glutamine residues are observed. In addition, no C′i–NH i+1 correlation is observed between the two types of glutamine residues, indicating that β-strands consist only of one or the other type of glutamine. Further confirmation of this interpretation is derived from analogous fingerprint spectra obtained on the polyQ core model peptide, D2Q15K2 (Figure 2b). Upon comparison of the Q44-HttEx1 and D2Q15K2 spectral fingerprints in Figure 2, no appreciable difference between chemical shift values is observed for either type of glutamine in the polyQ amyloid core.
Figure 2.
13C–13C and 13C–15N correlation spectra of (a) Q44-HttEx1 and (b) D2Q15K2 fibrils. Two types of Gln that compose the polyQ core are annotated in purple and cyan, while polyproline helix and random coil prolines are annotated in red and orange, respectively. TEM micrographs of the fibril samples are shown as insets. 13C assignments for oligoproline and polyQ regions are labeled in red and black in panels a and b, respectively. Only one set of assignments is shown in panels a and b for clarity.
To measure distances in MAS ssNMR, the dipolar coupling is reintroduced and the buildup of signal intensity of resonances reflecting the interaction between two nuclei is measured as a function of the buildup time.21 To enable the extraction of the corresponding interatomic distances, one simulates the distance-dependence of the polarization transfer curve.
However, the precision and accuracy of this approach are often compromised due to effects from networks of coupled nuclei, relaxation, and contributions from other NMR parameters. In densely isotopically enriched proteins, the presence of a third strongly coupled nucleus often attenuates the transfer efficiency between two weakly coupled nuclei (i.e., at long distances), in a process known as dipolar truncation (Figure S1).12,13,22 Use of DQ-selected 13C-pairs in NA samples circumvents the issue of dipolar truncation, leading to simplified spin dynamics. This facilitates the extraction of long-range distant restraints with an accuracy that is not achievable in more conventional ssNMR 13C–13C distance measurements. We use 2D DQ/SQ 13C–13C correlation experiments (Figure S2) to obtain polarization buildup curves reflecting the integrated Cα–Cα correlations of the polyQ and oligoproline signals, shown in Figure 3.
Figure 3.
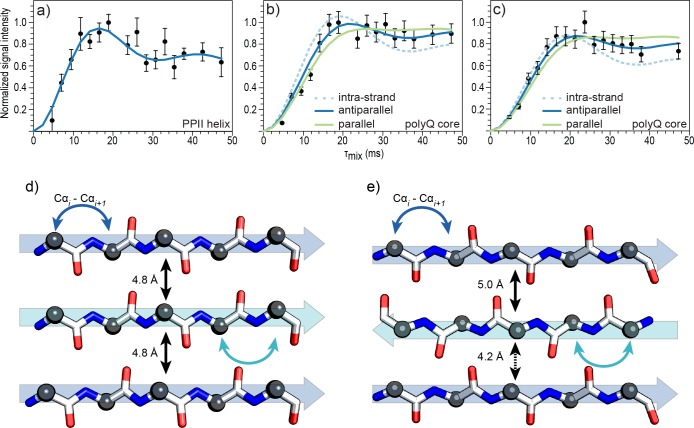
13Cα–13Cα buildup curves for (a) Q44-HttEx1 PPII-helix, (b) Q44-HttEx1 polyQ core, and (c) D2Q15K2 polyQ core. Experimental data (black circles) were obtained by monitoring the buildup of signal intensity of Cα–Cα correlations as a function of DQ mixing time.18,19 In panel a, the blue line is a simulation for a 3.6 Å i – i ± 1 distance in the PPII-helix. Simulations for intrastrand distances (dashed line), parallel β-strand arrangement (green line), and antiparallel β-stand arrangement (blue line) are shown in panels b and c. Canonical backbone conformations of (d) parallel and (e) antiparallel β-strands colored by atom type, Cα (black sphere), C′ (white), NH (blue), O (red). Intrastrand Cαi–Cαi±1 are shown as curved arrows for both types of gln β-strands (blue and cyan). Interstrand distances are labeled with black arrows.
To obtain distance information from the buildup curve a library of individual polarization buildup curves, representative of different 13C–13C distances, were numerically simulated with SPINEVOLUTION.20 Because of the 13C spin dilution at NA, only individual 13C–13C spin pairs need to be considered rather than multi-13C spin systems that require variations across a multitude of distance and angular combinations. Details of the fitting procedure can be found in the SI.
Interestingly long-range Cα–Cα contacts are only detected for one set of oligoproline signals in Q44-HttEx1. The corresponding buildup curve (Figure 3a) is best fit with a single 3.6 Å distance. The ability to probe Cα–Cα distances provides direct access to the secondary structure and allows discrimination between PPI and PPII helices, which are expected to have Cα–Cα distances in the ∼3 Å and ∼ 3.9 Å range, respectively.23 Moreover, the fact that we are not able to detect any long-range cross-peaks for the second type of oligoproline observed in Figure 2a imply that it is not forming a regular secondary structure, thus consistent with a random coil configuration. Note that access to oligoproline structural information using this approach should prove useful since PPII elements are present in fibrillary proteins and in folded and unfolded proteins.23
Fitting the Cα–Cα polyQ core buildups was conducted as follows. We first tried to fit the data assuming only i – i ± 1 intrastrand Cα–Cα contributions within the 3.5 to 3.9 Å range.24 The best fit intrastrand contact (3.8 Å) is presented as a dashed line in Figure 3b for Q44-HttEx1. There is a mismatch between these simulated intrastrand distances and the experimental points, indicating that the experimental data also contain long-range distance contributions. To evaluate whether this mismatch stems from underlying non-Gln signals we performed an analogous analysis on the polyQ model peptide (D2Q15K2) lacking the flanking domains. As shown in Figure 3c, buildup curves of this polyQ amyloid assembly showed a similar deviation from the intrastrand simulations.
Thus, it appears these measurements are detecting a significant presence of close intermolecular contacts in the polyQ amyloid core. To explore this, we modeled interstrand distances from parallel and antiparallel β-strand arrangements in our simulations. In parallel β-strands, Cα atoms maintain the same relative orientation between strands, while they alternate facing toward and away from each other in antiparallel β-strands (Figure 3d,e). Simulated buildup curves for parallel and antiparallel arrangements are plotted as green and blue solid lines respectively in Figure 3b,c. The simulated distances were derived from canonical cross-β structure interstrand arrangements (i.e., 4.8 Å hydrogen bonding distance between β-strands).25
Both configurations fit the data reasonably well within the error of the measurement; however, an antiparallel structure best fits the data, based on a χ2 analysis (Table 1). We also list a simulation result with two intrastrand and three long-range distances. Based on the χ2, this model did not fit the experimental data, which confirms that we observe only two interstrand distance contributions. Unambiguous discrimination between parallel and antiparallel arrangements with this method, would require further gains in sensitivity and are currently being pursued by developing more efficient polarization agents and ultralow temperature DNP MAS ssNMR instrumentation.26,27
Table 1. χ2 Analysis for Structural Arrangements in Q44-HttEx1 Using Canonical PPII Helix and β-Strand Structures.
| simulated distances (Å) |
||||
|---|---|---|---|---|
| region | sequential | interstrand | A | χ2a |
| PPII helices | ||||
| 3.2 | – | 4.64 | 3.7 | |
| 3.6 | – | 4.74 | 0.68 | |
| 4.0 | – | 4.73 | 2.7 | |
| polyQ core | ||||
| intrastrand | 3.8×2 | – | 2.69 | 6.0 |
| parallel | 3.8×2 | 4.8×2 | 1.44 | 2.8 |
| antiparallel | 3.8×2 | 4.2, 5.0 | 1.47 | 1.3 |
| 3.8×2 | 4.8×3 | 1.16 | 5.1 | |
Chemical shift analysis yields information on the local backbone geometry within protein deposits. However, it is increasingly realized that also the intermolecular or supramolecular arrangement within misfolded protein fibrils is critical to our understanding of their formation and polymorphs. As demonstrated here, distance measurements at NA prove effective in obtaining long-range inter- and intramolecular information. Thus, spectral and structural fingerprints can be obtained, which facilitate an in-depth comparison of fibril polymorphs. We applied this methodology to both Q44-HttEx1 protein and a peptide-based model of its polyQ core domains. Notably, the 13C and 15N resonance assignments of the polyQ core and oligoproline regions were completed under DNP conditions without the need for supplementary conventional NMR experiments; the results are consistent with previous NMR studies that relied on (and indeed required) isotopically enriched samples.28−30 Overall, these results are an important first demonstration of structural measurements of protein fibrils at NA with DNP-enhanced ssNMR. The atomic resolution structural measurements made possible by these methods will complement conventional ssNMR and cryo-EM studies and pave the way for studies of unlabeled protein aggregates derived from cells, patients, and other hard-to-label sources.
Acknowledgments
The authors thank Drs. Daniel Lee and Diego Gauto for helpful discussions, and Dr. James Conway for use of the EM facility. This work was funded by European Union Horizon 2020 research and innovation program under the Marie Skłodowska-Curie Action-795423-BOLD-NMR (A.N.S.), European Research Council grant ERC-CoG-2015 No. 682895 (G.D.P), and NIH grants R01 GM112678 (P.v.d.W.) and T32 GM088119 (J.C.B.).
Supporting Information Available
The Supporting Information is available free of charge on the ACS Publications website at DOI: 10.1021/jacs.8b09002.
Details regarding samples, NMR, and simulations (PDF)
Author Present Address
⊥ Zernike Institute for Advanced Materials, University of Groningen, Nijenborgh 4, 9747 AG Groningen, Netherlands
The authors declare no competing financial interest.
Supplementary Material
References
- Ross C. A.; Poirier M. A. Nat. Rev. Mol. Cell Biol. 2005, 6 (11), 891–898. 10.1038/nrm1742. [DOI] [PubMed] [Google Scholar]
- Van der Wel P. C. A. Solid State Nucl. Magn. Reson. 2017, 88, 1–14. 10.1016/j.ssnmr.2017.10.001. [DOI] [PMC free article] [PubMed] [Google Scholar]
- Tycko R. Neuron 2015, 86 (3), 632–645. 10.1016/j.neuron.2015.03.017. [DOI] [PMC free article] [PubMed] [Google Scholar]
- Bates G. P.; Dorsey R.; Gusella J. F.; Hayden M. R.; Kay C.; Leavitt B. R.; Nance M.; Ross C. A.; Scahill R. I.; Wetzel R.; Wild E. J.; Tabrizi S. J. Nat. Rev. Dis. Prim. 2015, 1, 15005. 10.1038/nrdp.2015.5. [DOI] [PubMed] [Google Scholar]
- Nekooki-Machida Y.; Kurosawa M.; Nukina N.; Ito K.; Oda T.; Tanaka M. Proc. Natl. Acad. Sci. U. S. A. 2009, 106 (24), 9679–9684. 10.1073/pnas.0812083106. [DOI] [PMC free article] [PubMed] [Google Scholar]
- Lin H.-K.; Boatz J. C.; Krabbendam I. E.; Kodali R.; Hou Z.; Wetzel R.; Dolga A. M.; Poirier M. A.; Van der Wel P. C. A. Nat. Commun. 2017, 8 (May), 15462. 10.1038/ncomms15462. [DOI] [PMC free article] [PubMed] [Google Scholar]
- Qiang W.; Yau W.-M.; Lu J.-X.; Collinge J.; Tycko R. Nature 2017, 541 (7636), 217–221. 10.1038/nature20814. [DOI] [PMC free article] [PubMed] [Google Scholar]
- Frederick K. K.; Michaelis V. K.; Corzilius B.; Ong T. C.; Jacavone A. C.; Griffin R. G.; Lindquist S. Cell 2015, 163 (3), 620–628. 10.1016/j.cell.2015.09.024. [DOI] [PMC free article] [PubMed] [Google Scholar]
- Bäuerlein F. J. B.; Saha I.; Mishra A.; Kalemanov M.; Martínez-Sánchez A.; Klein R.; Dudanova I.; Hipp M. S.; Hartl F. U.; Baumeister W.; Fernández-Busnadiego R. Cell 2017, 171, 179–187. 10.1016/j.cell.2017.08.009. [DOI] [PubMed] [Google Scholar]
- Takahashi H.; Hediger S.; De Paëpe G. Chem. Commun. 2013, 49 (82), 9479. 10.1039/c3cc45195j. [DOI] [PubMed] [Google Scholar]
- Märker K.; Pingret M.; Mouesca J. M.; Gasparutto D.; Hediger S.; De Paëpe G. J. Am. Chem. Soc. 2015, 137 (43), 13796–13799. 10.1021/jacs.5b09964. [DOI] [PubMed] [Google Scholar]
- Märker K.; Paul S.; Fernández-de-Alba C.; Lee D.; Mouesca J.-M.; Hediger S.; De Paëpe G. Chem. Sci. 2017, 8 (2), 974–987. 10.1039/C6SC02709A. [DOI] [PMC free article] [PubMed] [Google Scholar]
- Costa P. R.Spins, Peptides, and Alzheimer’s Disease: Solid-State Nuclear Magnetic Resonance Investigations of Amyloid Peptide Conformation. Thesis, MIT, 1996. [Google Scholar]
- Smith A. N.; Long J. R. Anal. Chem. 2016, 88 (1), 122–132. 10.1021/acs.analchem.5b04376. [DOI] [PMC free article] [PubMed] [Google Scholar]
- Lee D.; Hediger S.; De Paëpe G. Solid State Nucl. Magn. Reson. 2015, 66, 6–20. 10.1016/j.ssnmr.2015.01.003. [DOI] [PubMed] [Google Scholar]
- Can T. V.; Ni Q. Z.; Griffin R. G. J. Magn. Reson. 2015, 253, 23–35. 10.1016/j.jmr.2015.02.005. [DOI] [PMC free article] [PubMed] [Google Scholar]
- Mentink-Vigier F.; Vega S.; De Paëpe G. Phys. Chem. Chem. Phys. 2017, 19, 3506–3522. 10.1039/C6CP07881H. [DOI] [PubMed] [Google Scholar]
- Teymoori G.; Pahari B.; Stevensson B.; Edén M. Chem. Phys. Lett. 2012, 547, 103–109. 10.1016/j.cplett.2012.07.053. [DOI] [Google Scholar]
- Teymoori G.; Pahari B.; Edén M. J. Magn. Reson. 2015, 261, 205–220. 10.1016/j.jmr.2015.09.004. [DOI] [PubMed] [Google Scholar]
- Veshtort M.; Griffin R. G. J. Magn. Reson. 2006, 178 (2), 248–282. 10.1016/j.jmr.2005.07.018. [DOI] [PubMed] [Google Scholar]
- De Paëpe G. Annu. Rev. Phys. Chem. 2012, 63 (1), 661–684. 10.1146/annurev-physchem-032511-143726. [DOI] [PubMed] [Google Scholar]
- Märker K.Atomic-level structure determination of organic assemblies by dynamic nuclear polarization enhanced solid-state NMR. Thesis, University Grenoble Alpes, 2017. [Google Scholar]
- Adzhubei A. A.; Sternberg M. J. E.; Makarov A. a. J. Mol. Biol. 2013, 425 (12), 2100–2132. 10.1016/j.jmb.2013.03.018. [DOI] [PubMed] [Google Scholar]
- Pauling L.; Corey R. B. Proc. Natl. Acad. Sci. U. S. A. 1951, 37 (11), 729–740. 10.1073/pnas.37.11.729. [DOI] [PMC free article] [PubMed] [Google Scholar]
- Serpell L. C. Biochim. Biophys. Acta, Mol. Basis Dis. 2000, 1502 (1), 16–30. 10.1016/S0925-4439(00)00029-6. [DOI] [PubMed] [Google Scholar]
- Mentink-Vigier F.; Mathies G.; Liu Y.; Barra A. L.; Caporini M. A.; Lee D.; Hediger S.; Griffin R. G.; De Paëpe G. Chem. Sci. 2017, 8 (12), 8150–8163. 10.1039/C7SC02199B. [DOI] [PMC free article] [PubMed] [Google Scholar]
- Bouleau E.; Saint-Bonnet P.; Mentink-Vigier F.; Takahashi H.; Jacquot J. F.; Bardet M.; Aussenac F.; Purea A.; Engelke F.; Hediger S.; Lee D.; De Paëpe G. Chem. Sci. 2015, 6 (12), 6806–6812. 10.1039/C5SC02819A. [DOI] [PMC free article] [PubMed] [Google Scholar]
- Hoop C. L.; Lin H.-K.; Kar K.; Magyarfalvi G.; Lamley J. M.; Boatz J. C.; Mandal A.; Lewandowski J. R.; Wetzel R.; Van der Wel P. C. A. Proc. Natl. Acad. Sci. U. S. A. 2016, 113 (6), 1546–1551. 10.1073/pnas.1521933113. [DOI] [PMC free article] [PubMed] [Google Scholar]
- Isas J. M.; Langen R.; Siemer A. B. Biochemistry 2015, 54 (25), 3942–3949. 10.1021/acs.biochem.5b00281. [DOI] [PMC free article] [PubMed] [Google Scholar]
- Schneider R.; Schumacher M. C.; Mueller H.; Nand D.; Klaukien V.; Heise H.; Riedel D.; Wolf G.; Behrmann E.; Raunser S.; Seidel R.; Engelhard M.; Baldus M. J. Mol. Biol. 2011, 412 (1), 121–136. 10.1016/j.jmb.2011.06.045. [DOI] [PubMed] [Google Scholar]
Associated Data
This section collects any data citations, data availability statements, or supplementary materials included in this article.


