Abstract
Neuronal developmental disorder is a class of diseases in which there is impairment of the central nervous system and brain function. The brain in its developmental phase undergoes tremendous changes depending upon the stage and environmental factors. Neurodevelopmental disorders include abnormalities associated with cognitive, speech, reading, writing, linguistic, communication, and growth disorders with lifetime effects. Computational methods provide great potential for betterment of research and insight into the molecular mechanism of diseases. In this study, we have used four samples of microarray neuronal developmental data: control, RV (resveratrol), NGF (nerve growth factor), and RV + NGF. By using computational methods, we have identified genes that are expressed in the early stage of neuronal development and also involved in neuronal diseases. We have used MeV application to cluster the raw data using distance metric Pearson correlation coefficient. Finally, 60 genes were selected on the basis of coexpression analysis. Further pathway analysis was done using the Metascape tool, and the biological process was studied using gene ontology database. A total of 13 genes AKT1, BAD, BAX, BCL2, BDNF, CASP3, CASP8, CASP9, MYC, PIK3CD, MAPK1, MAPK10, and CYCS were identified that are common in all clusters. These genes are involved in neuronal developmental disorders and cancers like colorectal cancer, apoptosis, tuberculosis, amyotrophic lateral sclerosis (ALS), neuron death, and prostate cancer pathway. A protein-protein interaction study was done to identify proteins that belong to the same pathway. These genes can be used to design potential inhibitors against neurological disorders at the early stage of neuronal development. The microarray samples discussed in this publication are part of the data deposited in NCBI's Gene Expression Omnibus (Yadav et al., 2018) and are accessible through GEO Series (accession number GSE121261).
1. Introduction
1.1. Neuronal Development Disorder
Neurogenesis is a process of generating new and functional neurons from neuronal precursors known as NSC (neuronal stem cells) [1, 2]. Functional neurons are generated at the embryonic stage at different stages of development throughout life [3, 4]. With rapid advancement in techniques and curiosity to understand neuronal diseases at the development stage, researchers have explored a wide area of neuronal development diseases and their causes [5–8]. Neuronal stem cells have two major features that are regeneration capacity, that is, ability of self-renewal by process of cell division, and differentiation capacity, that is, process of generating new and specialized cell types [9]. Developed neurons do not carry dendrites and axons, but they play an important role to receive and send signals to other neurons [10]. Significant development has been made to identify genes that are involved in neuronal diseases at the developmental stage [11]. It is important to study different stages of nervous system development and to identify abnormalities that can arise from improper development of brain at its early stage [12]. Significant contribution has been made by scientists to identify neuronal disorders that occur at the early stage of development [13]. Neuronal disorders include abnormalities associated with intellectual disability, attention deficit hyperactivity disorder (ADHD), and cognitive skills disorders, like dyslexia and dysgraphia, and language development disorders like expression disorder [14–18]. Scientific evidence shows that neurological disorders can be identified at the early stage by the first week or month of a lifecycle [19–21]. It is important to identify which genes are crucial and result in neurological disorders.
We have used high-throughput microarray experiment to identify genes that are involved in the early stage of neurodevelopment. Our aim was to identify genes that were expressed when stem cells were exposed to MCP (monocrotophos), a neurotoxicant, and to evaluate the effective role of resveratrol (RV) and nerve growth factor (NGF) as the neuroprotectant.
1.2. Resveratrol Clinical Perspectives
Resveratrol is a natural phenol and phytoalexin produced naturally by several plants in response to injury [22]. There is exponential evidence since 1939 in the literature that resveratrol is a promising natural compound for prevention and treatment of a wide range of human diseases [23]. Resveratrol is also reported to be effective against neuronal cell dysfunction and cell death, Huntington's disease and Alzheimer's disease [24–27]. Molecular studies show that resveratrol is associated with an induction of genes for oxidative phosphorylation and mitochondrial biogenesis [28]. Effect of resveratrol is known to extend lifespan, and it impacts mitochondrial function and metabolic homeostasis [29]. In the current work, we have mapped effectiveness of resveratrol against injured neurodevelopment samples. In this study, four samples were prepared (control, resveratrol, NGF, and RV + NGF). Datasets of prepared samples were taken to investigate the neuroprotective role of resveratrol against exposure of monocrotophos. In silico expression analysis of different datasets is done to identify genes that are coexpressed.
1.3. Microarray Data Analysis
Microarrays provide a rich source of data on the molecular mechanism of cell function. Each microarray reports expression of thousands of mRNAs [30]. Virtually, almost every human disease is being studied using microarrays experiment, with the aim of finding the novel genes involved in diseases and disease markers and to identify drug targets [31]. Bioinformatics analysis plays an important part of processing the information, embedded in large-scale expression profiling studies, and for laying the biological interpretation of high throughput microarray data [32]. A basic yet challenging task in the analysis of microarray gene expression data is the identification of changes in gene expression that are associated with particular biological conditions [33, 34]. Careful statistical design and analysis are essential to identify genes involved in each biological condition.
A standard workflow is required to utilize computational tools at various steps of microarray analysis. This paper also describes use of different bioinformatics tools for quality control, normalization, coexpression, annotation, and pathway and protein-protein interaction analysis.
1.4. Clustering and Coexpression Analysis
Clustering is a method to identify genes that are coexpressed in each biological condition [35]. Clustering methods uses a distance measure (e.g., Euclidean metric) to compare expression values of pairs of genes for each experiment [36]. When the distance between a pair of genes is small, then the two genes might be clustered. Clusters are analyzed to identify genes that are coexpressed and coregulated.
1.5. Biological Annotation and Interpretation
After extensive analysis of microarray data, one needs to annotate Affymetrix IDs for its significance. Annotation reveals the biological significance of genes like its molecular pathway, diseases involved, gene ontology, and so on [37]. Careful exploration is required to identify genes that are expressed in each condition of microarray experiment. Pathway and process enrichment is a crucial part of annotation, as it leads to the identification of set of genes that are involved in the same pathways [38]. Pathways analysis also highlights the set of proteins that interact with each other; this information is used to categorize protein interaction partners and to study protein-protein interaction network [39].
2. Materials and Methods
2.1. Microarray Data
The MSCs (mesenchymal stem cells) were used to study effect of monocrotophos (MCP) and repairing capability of resveratrol and nerve growth factor. MSCs were exposed to RV, NGF, and RV + NGF, respectively. In total, four samples were generated to identify genes that were coexpressed at the neuronal development stage. Affymetrix gene chip platform (Prime view.CDF) was used to identify gene expression using four samples as described in Table 1.
Table 1.
Four samples that were used for microarray gene expression analysis.
| S.no | Samples | Description | Raw files |
|---|---|---|---|
| 1 | Control | Control sample | Control.CEL |
| 2 | RV | MSCs exposed to RV | RV.CEL |
| 3 | NGF | MSCs exposed to NGF | NGF.CEL |
| 4 | RV + NGF | MSCs exposed to combined RV + NGF | RV + NGF.CEL |
2.2. Microarray Data Analysis and Annotation
Computational software and tools were used to identify genes that are coexpressed. Figure 1 shows the workflow used for microarray data analysis and annotation. Raw files were used, i.e., chip electronic file (CEL) and chip description file (CDF) for quality control analysis. R and Bioconductor, Affy package, was used for data normalization and data transformation. Gene expression matrix was generated form Affy package, using RMA (robust multiarray average).
Figure 1.
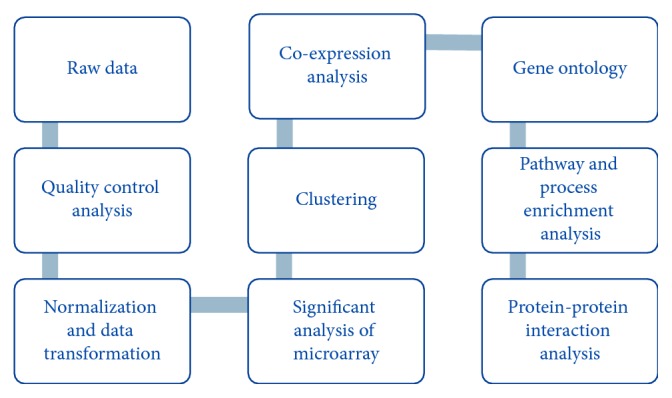
Workflow used for microarray data analysis and annotation.
Significant analysis of microarray (SAM) [40] and clustering were done using MeV application [41]. The clustering method was used to cluster significant genes obtained from the SAM method. For clustering, the distance metric Pearson correlation coefficient was used, using parameter of k–means algorithm, number of cluster 10, and number of iteration 50. Coexpressed genes were identified by analyzing each ten clusters.
2.3. Pathway Enrichment and Protein-Protein Interaction Analysis
Coexpressed genes identified from clustering analysis were further annotated for biological intervention and pathway analysis. The list of coexpressed genes was searched against pathway and GO database using the Metascape tool (http://metascape.org) [42]. Each gene was studied for its pathway and process enrichment score for statistical significance of genes in each biological process. Genes were also clustered according to their pathways. Relationship between genes was also identified by using the network map generated from the Metascape tool and visualized in the Cytoscape tool [43].
Protein-protein interaction analysis is carried out by different protein interaction databases like BioGrid, InWeb_IM, and OmniPath by using the Metascape tool. Molecular complex detection (MCODE) algorithm was used by the Metascape tool to identify densely connected network of protein-protein interaction [44].
3. Results
3.1. Quality Control Analysis
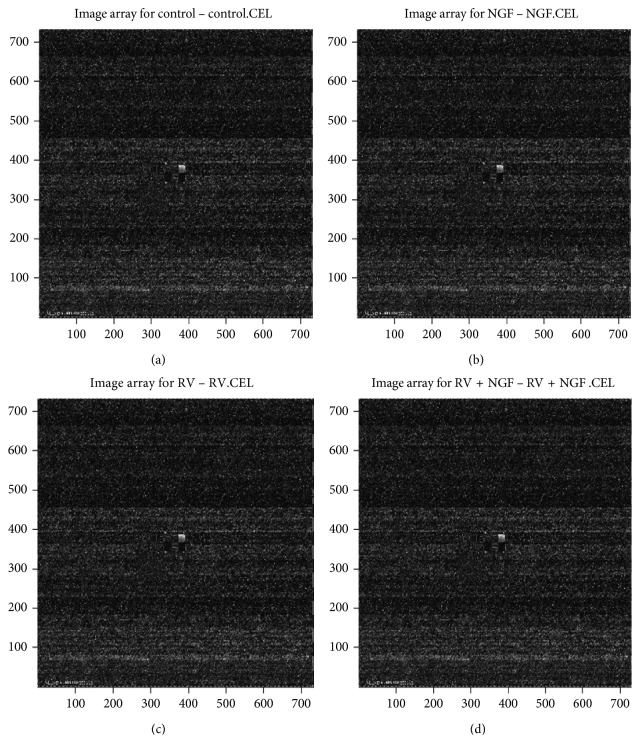
Quality control (QC) is an important aspect of examining microarray data, before any statistical analysis to be done. QC analysis was done using Affy package of R and Bioconductor [45]. Figure 2 shows the chip image of four samples: (a) control sample, (b) NGF sample, (c) RV sample, and (d) RV + NGF sample; it signifies there is no error in chips of all four samples, and they can be used for data exploration and analysis.
Figure 2.
Affymetrix chip image: (a) control sample, (b) NGF sample, (c) RV sample, and (d) RV + NGF sample.
3.2. Data Normalization and Transformation
Finding biologically relevant answer from microarray experiment is a primary need of any microarray experiment. Variations in gene expression should be biologically not from any source of errors like biasness in dyes, lasers, samples, and chip spotting during microarray experiment [46]. To analyze microarray data, one needs to remove these biasness and errors in microarray experiment. Normalization is a method to remove these systematic errors that affect gene expression measures [47]. After QC analysis, normalization was done using Affy package of R and Bioconductor. We have used the RMA method of normalization. Figure 3 shows the box plot of four samples after data normalization. Box plot shows statistical values like mean or median and variations between samples [48]. Figure 3 shows that means of all four samples are at position. Data were transformed to logarithm base 2 value of the expression ratio, and expression matrix was written, for further statistical analysis and comparisons.
Figure 3.
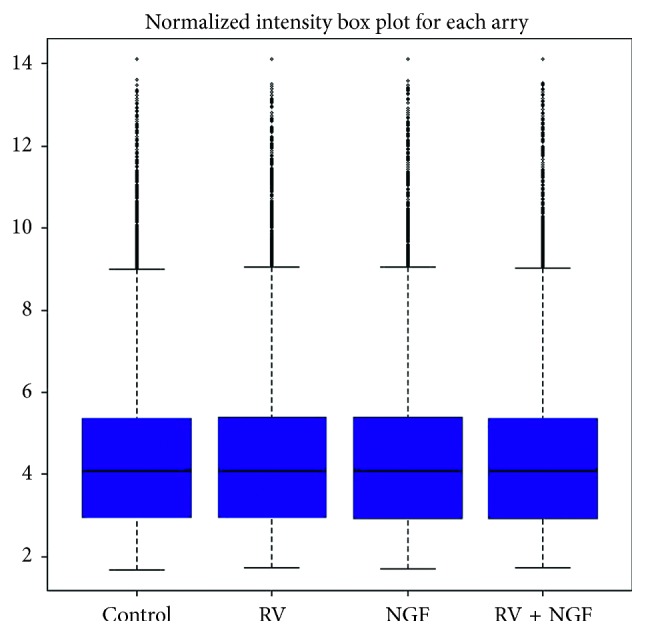
Box plot of microarray samples after normalization.
3.3. Clustering and Coexpression Analysis
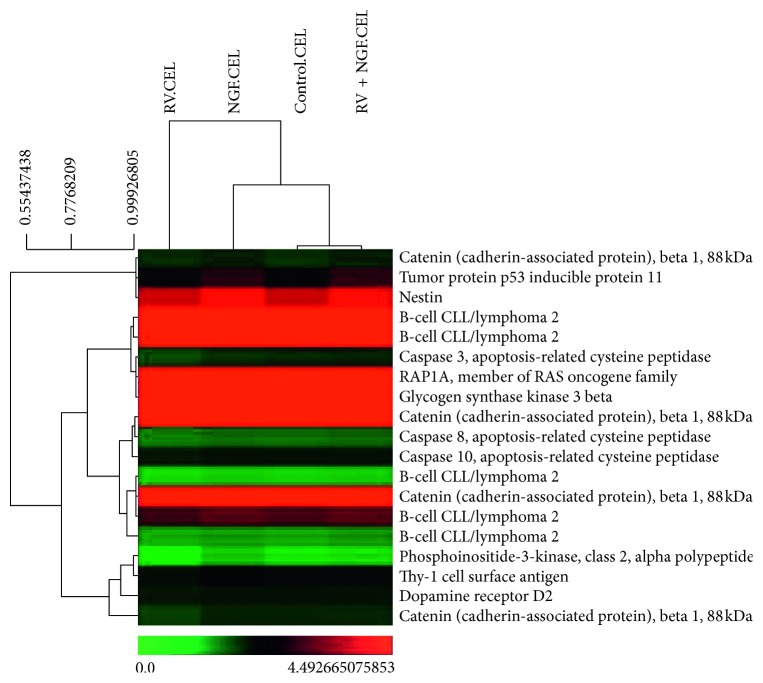
Significant analysis of microarray (SAM) was done to identify the number of genes that were statistically significant. Out of 49,495 genes, 49,022 genes were found to be insignificant and 473 genes were statistically significant. K-means clustering was done on significant genes with parameter of k = 10. Ten clusters were generated and studied for coexpression of genes. Figure 4 shows cluster 1 (only one cluster is shown but all ten clusters were studied for coexpression analysis) which shows coexpression of Tp53 and B-cell cll/lymphoma2 gene. In addition, Caspase-8, Caspase-10, and dopamine receptor are also coregulated.
Figure 4.
Clustering result of significant genes.
Analysis of all ten clusters results in identification of coexpressed genes. Rigorous analysis of clustering shows that 60 genes were coexpressed (AKT1, BAD, BAX, BCL2, BDNF, CASP3, CASP8, CASP9, MYC, PIK3CD, MAPK1, MAPK10, and CYCS). These genes were used for gene ontology, biological function, and pathway analysis. Descriptions including function of these 60 genes were shown in pathway and process enrichment analysis.
3.4. Pathway and Process Enrichment Analysis
Coexpressed genes that were clustered in the clustering step were used for biological annotation and interpretation. The Metascape tool was used to study pathway and process of these 60 genes. Protein-protein interaction network was constructed to identify more proteins that have similar function and belong to same pathway. 60 genes were further clustered into 20 groups on the basis of their enrichment score (enrichment score is the score between observed count and expected count by chance) [49].
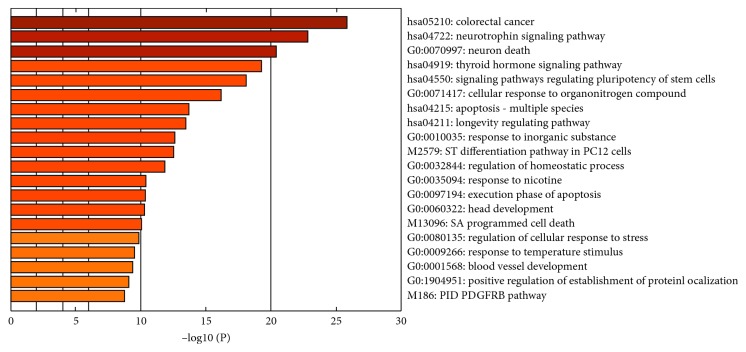
In each cluster, one term represents the cluster that is most statistically significant [42]. Figure 5 shows the heat map of enriched terms colored by the p value. Pathway enrichment analysis shows that most of the genes were involved in colorectal cancer, neurotrophin signaling pathway, neuron death, and thyroid hormone signaling pathway. Other clusters indicate genes that were involved in cellular response to organonitrogen compounds, response to nicotine, and head development. Genes that belong to these clusters were further studied in detail for function and pathway analysis.
Figure 5.
Heat map of enriched terms across input gene lists, colored by p values.
Top 5 clusters are shown in Table 2; count is the number of genes in each cluster; percentage is the total gene ontology provided in list of genes; Log10(P) is the log base 10 value; and Log10(q) is the log base 10 adjusted p value [42].
Table 2.
Pathway and process enrichment analysis.
| S.no | GO | Category | Description | Count | % | Log10 (P) | Log10 (q) |
|---|---|---|---|---|---|---|---|
| 1 | Hsa05210 | KEGG pathway | Colorectal cancer | 15 | 25 | −25.7 | −21.4 |
| 2 | Hsa04722 | KEGG pathway | Neurotrophin signaling pathway | 16 | 26.6 | −22.8 | −19.1 |
| 3 | Go: 0070997 | Go biological processes | Neuron death | 19 | 31.6 | −20.3 | −16.9 |
| 4 | Hsa04919 | KEGG pathway | Thyroid hormone signaling pathway | 14 | 23.3 | −19.2 | −15.9 |
| 5 | Hsa04550 | KEGG pathway | Signaling pathways regulating pluripotency of stem cells | 14 | 23.3 | −18.0 | −14.9 |
Pathway enrichment shows that neuronal development genes are involved in colorectal cancer, neuron death, and other diseases like leukemia and sclerosis [50]. Genes AKT1, BAD, BAX, BCL2, CASP3, CASP8, CASP9, MYC, PIK3CD, MAPK1, MAPK10, and CYCS are commonly expressed in the cluster of colorectal cancer, neuronal signaling pathway, neuronal death, amytrophic lateral aclerosis, and tuberculosis [51]. Further proteins are identified that show interaction with these proteins on the basis of protein-protein interaction study.
3.5. Protein-Protein Interaction Enrichment Analysis
Protein-protein interaction (PPI) enrichment was done among the list of genes that were clustered in pathway and process enrichment analysis. The Metascape tool predicts PPI network by comparing it with protein interaction databases (BioGrid, InWeb_IM, and OmniPath) [42]. PPI is made between proteins having physical interactions, and PPI network is further subclustered on the basis of the p value score. Figure 6 shows the PPI map between the set of input genes. Three best scoring genes by the p value are identified; these proteins define the functionality of PPI network. Best scoring genes belong to apoptosis (hsa04210) [52], colorectal cancer (hsa05210) [53], and hepatitis B (hsa05161) [54]. PPI network represents involvement of neuronal development genes in diseases like cancer.
Figure 6.
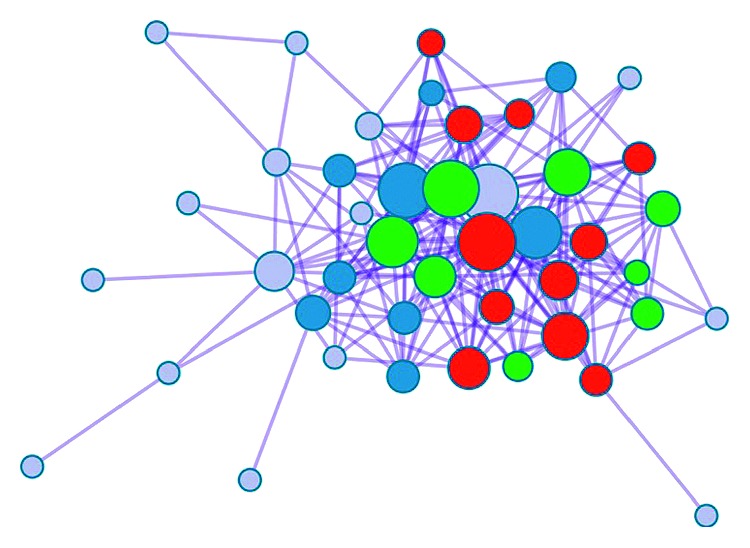
Protein-protein interaction network.
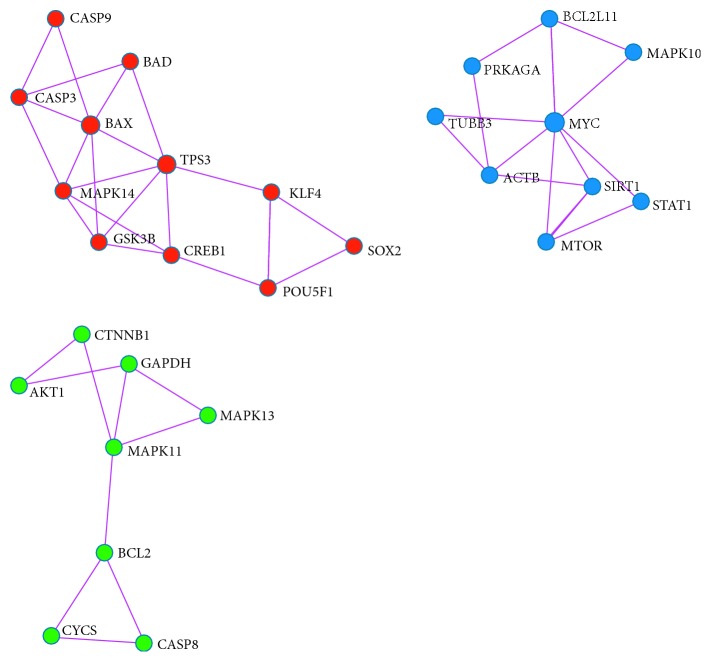
The molecular complex detection (MCODE) method was applied to identify closely related protein from PPI network. The MCODE algorithm subclustered PPI network into 3 subclusters. Figure 7 shows MCODE components (red, blue, and green as MCODE 1, 2, and 3). Three dense PPI were made and detail of each cluster is given in Table 3. MCODE prediction validates the results of clustering as previously shown in Figure 4. The same set of proteins was identified by MCODE algorithm as predicted by clustering using the MeV tool. These proteins have the same GO and pathway.
Figure 7.
MCODE protein-protein interaction network. Colors show the different components of MCODE (red color: MCODE 1, blue color: MCODE2, and green color: MCODE 3).
Table 3.
Cluster details of MCODE protein-protein interaction and pathways.
| Cluster | Symbol | Pathways | Diseases |
|---|---|---|---|
| 1 | CASP3 | Caspase-3 | Cancer |
| CASP9 | Caspase-9 | Aging, cancer, chemdependency | |
| BAX | BCL2-associated X and apoptosis regulator | Colorectal cancer, somatic, T-cell acute lymphoblastic leukemia | |
| TP53 | Tumor protein p53 | Breast cancer, colorectal cancer, hepatocellular carcinoma, etc. | |
| BAD | BCL2-associated agonist of cell death | Cancer, hematological, infection | |
| GSK3B | Glycogen synthase kinase 3 beta | Cancer | |
| POU5F1 | POU class 5 homeobox 1 | Chemdependency | |
| MAPK14 | Mitogen-activated protein kinase 14 | Chemdependency | |
| CREB1 | cAMP responsive element-binding protein 1 | Histiocytoma | |
| SOX2 | SRY-box 2 | Optic nerve hypoplasia and abnormalities of the central nervous system | |
| KLF4 | Kruppel like factor 4 | Cardiovascular and metabolic diseases | |
|
| |||
| 2 | MTOR | Mechanistic target of rapamycin | Aging, cancer, chemdependency |
| PRKACA | Protein kinase cAMP-activated catalytic subunit alpha | Cushing syndrome | |
| MAPK10 | Mitogen-activated protein kinase 10 | Metabolic diseases | |
| STAT1 | Signal transducer and activator of transcription 1 | Mycobacterial and viral infections | |
| ACTB | Actin beta | Baraitser-winter syndrome 1 and dystonia | |
| BCL2L11 | BCL2 like 11 | Cancer, cardiovascular diseases | |
| SIRT1 | Sirtuin 1 | Aging, cancer, cardiovascular diseases | |
| TUBB3 | Tubulin beta 3 class III | Fibrosis, cortical dysplasia, brain malformations | |
| MYC | v-myc avian myelocytomatosis viral oncogene homolog | Burkitt lymphoma | |
|
| |||
| 3 | GAPDH | Glyceraldehyde-3-phosphate dehydrogenase | Aging |
| CASP8 | Caspase-8 | Breast cancer, lung cancer | |
| AKT1 | AKT serine/threonine kinase 1 | Breast cancer, somatic, colorectal cancer, ovarian cancer, schizophrenia | |
| BCL2 | BCL2, apoptosis regulator | Leukemia/lymphoma | |
| CYCS | Cytochrome c, somatic | Thrombocytopenia | |
| MAPK11 | Mitogen-activated protein kinase 11 | Unknown | |
| MAPK13 | Mitogen-activated protein kinase 13 | Unknown | |
| CTNNB1 | Catenin beta 1 | Colorectal cancer, hepatocellular carcinoma, ovarian cancer and mental retardation | |
Cluster analysis of MCODE components is done, and details of proteins involved in each cluster and their corresponding pathways are shown in Table 3. Cluster 1 includes proteins CASP3, CASP9, BAX, TP53, BAD, GSK3B, POU5F1, MAPK14, CREB1, SOX2, and KLF4. Gene ontology data show that these proteins are associated with amyotrophic lateral sclerosis (hsa05014) [55], colorectal cancer (hsa05210) [56], and positive regulation of neuron death (GO: 1901216) [57].
Cluster 2 genes are mentioned in Table 3. GO analysis shows that these proteins belong to thyroid hormone signaling pathway (hsa04919) [55], diseases of signal transduction (R-HSA-5663202) [56], and pathways in cancer (hsa05200) [57]. Cluster 3 proteins are involved in pathways of toxoplasmosis (hsa05145) [55], tuberculosis (hsa05152) [56], and fluid shear stress and atherosclerosis (hsa05418) [55].
MCODE cluster and cluster of MeV software show that some genes were commonly expressed and were coregulated. AKT1, BAD, BAX, BCL2, BDNF, CASP3, CASP8, CASP9, MYC, PIK3CD, MAPK1, MAPK10, and CYCS genes are coregulated. PPI analysis identifies other proteins that have interaction with abovementioned proteins. These proteins are important in neuronal differentiation, and regeneration proteins like ACTB, GSK3B, CREB1, and CTNNB1 have physical interaction with coexpressed proteins [58]. Table 3 also gives the information about proteins and association with diseases. Analysis of disease associated with proteins highlights that some proteins belong to different classes of cancers. 12 proteins (CASP3, CASP9, BAX, TP53, BAD,GSK3B, MTOR, BCL2L11, SIRT1, CASP8, AKT1, and C TNNB1 proteins) are involved in diverse types of cancers like lung cancer, breast cancer, ovarian cancer, colorectal cancer, and leukemia [59].
While other proteins (GSK3B, POU5F1, MAPK14, CREB1, SOX2, KLF4, PRKACA, MAPK10, STAT1, ACTB, TUBB3, MYC, GAPDH, AKT1, and CTNNB1) are related with process of aging, neuronal diseases, cardiovascular diseases, abnormal brain development, mental retardation, schizophrenia, and mycobacterial and viral infections [60–62].
Key findings of the pathway and disease association study are identification of proteins involved in neurological diseases and also expressed at the early stage of neuronal development. SOX2 protein was expressed in optic nerve hypoplasia and abnormalities of the central nervous system [63], STAT1 was expressed during mycobacterial and viral infections [64], TUBB3 was related with fibrosis and cortical dysplasia and brain deformities, AKT1 was expressed in breast cancer, colorectal cancer, ovarian cancer, and schizophrenia [65] and CTNNB1 was expressed in colorectal cancer, hepatocellular carcinoma, ovarian cancer, and mental retardation [66]. The study shows that proteins (SOX2, STAT1, AKT1, and CTNNB1) can be used as markers for neurological disease at the early stage of neuronal development, and they can be potential drug targets for therapeutic development.
4. Conclusion and Discussion
Microarray experiment is designed to investigate the genes that are expressed at the early stage of neuronal development. Neurodevelopmental microarray gene expression data are used to identify genes that are expressed in neuronal disorders, at its initial stage of progress [67]. Four samples were prepared, viz, control, resveratrol, nerve growth factor, and RV + NGF and hybridized to Affymetrix chip (Prime view). Gene expression matrix was constructed, and computational analysis was done. The protocol is designed to study biologically significant genes. Microarray data analysis workflow includes quality control, data normalization, clustering, pathways enrichment, and PPI study. Clustering analysis identifies genes that are coexpressed. These sets of coexpressed genes are used for pathway and process enrichment analysis. Gene ontology and pathway study reveal proteins that share common pathways and function. Further protein-protein interaction network is constructed to identify more number of proteins, which have physical interaction with coexpressed proteins. PPI network is subclustered to predict closely related proteins. Gene ontology information of these proteins is used to identify function and disease associated with proteins. 12 proteins CASP3, CASP9, BAX, TP53, BAD, GSK3B, MTOR, BCL2L11, SIRT1, CASP8, AKT1, and CTNNB1 proteins are predicted that are involved in various types of cancers like lung cancer, breast cancer, ovarian cancer, colorectal cancer, and leukemia [60, 61, 62]. Some proteins like SOX2, STAT1, AKT1, and CTNNB1 proteins are associated with neurological disease like abnormal brain development, mental retardation, schizophrenia, and mycobacterial and viral infections [63–66]. These genes can be used as markers for neurological disease, for detection of abnormalities at the early stage of neuronal development [67]. Predicted proteins can also act as potential drug targets for the drug development process. Further work is required for wet lab verification of predicted genes that are expressed in neurological disorders and express at the developmental stage. More research is required in the field of neurodevelopmental biology to identify neurological abnormalities at its budding stage. This paper also highlights the importance of microarray experiment in understanding the neurological diseases and methodology to study various outcomes of gene expression data, like coexpression analysis, pathway and process identification, and protein-protein interaction network study.
Data Availability
The microarray data used to support the findings of this study are included within the supplementary information file.
Conflicts of Interest
The authors declare that they have no conflicts of interest.
Supplementary Materials
Gene expression matrix microarray raw files (CEL and CDF files) were used to make gene expression matrix using Affy package and RMA (robust multiarray average) method. This matrix file was used for further microarray analysis like clustering, pathway, and protein-protein interaction analysis. Pathway and protein-protein interaction result as generated from the Metascape tool is given. This file includes information about clustered formed within genes and network details with scores. Annotation and enrichment annotation file and pathway enrichment result as generated from the Metascape tool is given. Annotation file includes information about genes like gene symbol, gene description, GO biological process, protein function, and so on.
References
- 1.Eriksson P. S., Perfilieva E., Eriksson T. B., et al. Neurogenesis in the adult human hippocampus. Nature Medicine. 1998;4(11):p. 1313. doi: 10.1038/3305. [DOI] [PubMed] [Google Scholar]
- 2.Van Praag H., Kempermann G., Gage F. H. Running increases cell proliferation and neurogenesis in the adult mouse dentate gyrus. Nature Neuroscience. 1999;2(3):p. 266. doi: 10.1038/6368. [DOI] [PubMed] [Google Scholar]
- 3.Van Praag H., Schinder A. F., Christie B. R., Toni N., Palmer T. D., Gage F. H. Functional neurogenesis in the adult hippocampus. Nature. 2002;415(6875):p. 1030. doi: 10.1038/4151030a. [DOI] [PMC free article] [PubMed] [Google Scholar]
- 4.Wegiel J., Kuchna I., Nowicki K., et al. The neuropathology of autism: defects of neurogenesis and neuronal migration, and dysplastic changes. Acta Neuropathologica. 2010;119(6):755–770. doi: 10.1007/s00401-010-0655-4. [DOI] [PMC free article] [PubMed] [Google Scholar]
- 5.Johnston M. V., Blue M. E., Sakkubai N. Rett syndrome and neuronal development. Journal of Child Neurology. 2005;20(8):759–763. doi: 10.1177/08830738050200082601. [DOI] [PubMed] [Google Scholar]
- 6.Galaburda A. M., LoTurco J., Ramus F., Fitch R. H., Rosen G. D. From genes to behavior in developmental dyslexia. Nature Neuroscience. 2006;9(10):1213–1217. doi: 10.1038/nn1772. [DOI] [PubMed] [Google Scholar]
- 7.Lewis D. A., Levitt P. Schizophrenia as a disorder of neurodevelopment. Annual Review of Neuroscience. 2002;25(1):409–432. doi: 10.1146/annurev.neuro.25.112701.142754. [DOI] [PubMed] [Google Scholar]
- 8.Trapp B. D., Nave K.-A. Multiple sclerosis: an immune or neurodegenerative disorder? Annual Review of Neuroscience. 2008;31:247–269. doi: 10.1146/annurev.neuro.30.051606.094313. [DOI] [PubMed] [Google Scholar]
- 9.Muñoz-Elías G., Dale W., Black I. B. Marrow stromal cells, mitosis, and neuronal differentiation: stem cell and precursor functions. Stem Cells. 2003;21(4):437–448. doi: 10.1634/stemcells.21-4-437. [DOI] [PubMed] [Google Scholar]
- 10.Schuldiner M., Eiges R., Eden A., et al. Induced neuronal differentiation of human embryonic stem cells. Brain Research. 2001;913(2):201–205. doi: 10.1016/s0006-8993(01)02776-7. [DOI] [PubMed] [Google Scholar]
- 11.Purpura D. P. in Brain Mechanisms in Mental Retardation. Amsterdam, Netherlands: Elsevier Inc.; 1975. Normal and aberrant neuronal development in the cerebral cortex of human fetus and young infant; pp. 141–169. [DOI] [PubMed] [Google Scholar]
- 12.West A. E., Greenberg M. E. Neuronal activity–regulated gene transcription in synapse development and cognitive function. Cold Spring Harbor Perspectives in Biology. 2011;3(6) doi: 10.1101/cshperspect.a005744.a005744 [DOI] [PMC free article] [PubMed] [Google Scholar]
- 13.Whitaker-Azmitia M. P. Serotonin and brain development: role in human developmental diseases. Brain Research Bulletin. 2001;56(5):479–485. doi: 10.1016/s0361-9230(01)00615-3. [DOI] [PubMed] [Google Scholar]
- 14.Bale T. L., Baram T. Z., Brown A. S., et al. Early life programming and neurodevelopmental disorders. Biological Psychiatry. 2010;68(4):314–319. doi: 10.1016/j.biopsych.2010.05.028. [DOI] [PMC free article] [PubMed] [Google Scholar]
- 15.Zoghbi H. Y. Postnatal neurodevelopmental disorders: meeting at the synapse? Science. 2003;302(5646):826–830. doi: 10.1126/science.1089071. [DOI] [PubMed] [Google Scholar]
- 16.Dennis M., Francis D. J., Cirino P. T., Schachar R., Barnes M. A., Fletcher J. M. Why IQ is not a covariate in cognitive studies of neurodevelopmental disorders. Journal of the International Neuropsychological Society. 2009;15(3):331–343. doi: 10.1017/s1355617709090481. [DOI] [PMC free article] [PubMed] [Google Scholar]
- 17.Krakowiak P., Walker C. K., Bremer A. A., et al. Maternal metabolic conditions and risk for autism and other neurodevelopmental disorders. Pediatrics. 2012;129(5):e1121–e1128. doi: 10.1542/peds.2011-2583. [DOI] [PMC free article] [PubMed] [Google Scholar]
- 18.Levitt P., Eagleson K. L., Powell E. M. Regulation of neocortical interneuron development and the implications for neurodevelopmental disorders. Trends in Neurosciences. 2004;27(7):400–406. doi: 10.1016/j.tins.2004.05.008. [DOI] [PubMed] [Google Scholar]
- 19.Gillberg I. C., Gillberg C. Children with preschool minor neurodevelopmental disorders. IV: behaviour and school achievement at age 13. Developmental Medicine and Child Neurology. 1989;31(1):3–13. doi: 10.1111/j.1469-8749.1989.tb08406.x. [DOI] [PubMed] [Google Scholar]
- 20.Millan M. J. An epigenetic framework for neurodevelopmental disorders: from pathogenesis to potential therapy. Neuropharmacology. 2013;68:2–82. doi: 10.1016/j.neuropharm.2012.11.015. [DOI] [PubMed] [Google Scholar]
- 21.Baur J. A., Sinclair D. A. Therapeutic potential of resveratrol: the in vivo evidence. Nature Reviews Dug discovery. 2006;5(6):p. 493. doi: 10.1038/nrd2060. [DOI] [PubMed] [Google Scholar]
- 22.Frémont L. Biological effects of resveratrol. Life Sciences. 2000;66(8):663–673. doi: 10.1016/s0024-3205(99)00410-5. [DOI] [PubMed] [Google Scholar]
- 23.Lagouge M., Argmann C., Gerhart-Hines Z., et al. Resveratrol improves mitochondrial function and protects against metabolic disease by activating SIRT1 and PGC-1α. Cell. 2006;127(6):1109–1122. doi: 10.1016/j.cell.2006.11.013. [DOI] [PubMed] [Google Scholar]
- 24.Aziz M. H., Reagan-Shaw S., Wu J., Longley B. J., Ahmad N. Chemoprevention of skin cancer by grape constituent resveratrol: relevance to human disease? FASEB Journal. 2005;19(9):1193–1195. doi: 10.1096/fj.04-3582fje. [DOI] [PubMed] [Google Scholar]
- 25.Magyar K., Halmosi R., Palfi A., et al. Cardioprotection by resveratrol: a human clinical trial in patients with stable coronary artery disease. Clinical Hemorheology and Microcirculation. 2012;50(3):179–187. doi: 10.3233/CH-2011-1424. [DOI] [PubMed] [Google Scholar]
- 26.Vingtdeux V., Dreses-Werringloer U., Zhao H., Davies P., Marambaud P. Therapeutic potential of resveratrol in Alzheimer’s disease. BMC Neuroscience. 2008;9(2):p. S6. doi: 10.1186/1471-2202-9-s2-s6. [DOI] [PMC free article] [PubMed] [Google Scholar]
- 27.Frankel E. N., Waterhouse A. L., Kinsella J. E. Inhibition of human LDL oxidation by resveratrol. The Lancet. 1993;341(8852):1103–1104. doi: 10.1016/0140-6736(93)92472-6. [DOI] [PubMed] [Google Scholar]
- 28.López-Lluch G., Irusta P. M., Navas P., de Cabo R. Mitochondrial biogenesis and healthy aging. Experimental Gerontology. 2008;43(9):813–819. doi: 10.1016/j.exger.2008.06.014. [DOI] [PMC free article] [PubMed] [Google Scholar]
- 29.Biala A., Tauriainen E., Siltanen A., et al. Resveratrol induces mitochondrial biogenesis and ameliorates Ang II-induced cardiac remodeling in transgenic rats harboring human renin and angiotensinogen genes. Blood Pressure. 2010;19(3):196–205. doi: 10.3109/08037051.2010.481808. [DOI] [PubMed] [Google Scholar]
- 30.Renée de M. X., Boer J. M., van Houwelingen H. C. Microarray data analysis. Applied bioinformatics. 2004;3(4):229–235. doi: 10.2165/00822942-200403040-00004. [DOI] [PubMed] [Google Scholar]
- 31.Weeraratna A. T., Taub D. D. Microarray Data Analysis. New York City, NY, USA: Humana Press; 2007. [Google Scholar]
- 32.Behzadi P., Behzadi E., Ranjbar R. Microarray data analysis. Challenge. 2014;7:p. 8. [Google Scholar]
- 33.Smyth G. K., Yang Y. H., Speed T. Functional Genomics. New York City, NY, USA: Humana Press; 2003. Statistical issues in cDNA microarray data analysis; pp. 111–136. [DOI] [PubMed] [Google Scholar]
- 34.Jirapech-Umpai T., Aitken S. Feature selection and classification for microarray data analysis: evolutionary methods for identifying predictive genes. BMC bioinformatics. 2005;6(1):p. 148. doi: 10.1186/1471-2105-6-148. [DOI] [PMC free article] [PubMed] [Google Scholar]
- 35.Getz G., Levine E., Domany E. Coupled two-way clustering analysis of gene microarray data. Proceedings of the National Academy of Sciences. 2000;97(22):12079–12084. doi: 10.1073/pnas.210134797. [DOI] [PMC free article] [PubMed] [Google Scholar]
- 36.Curtis R. K., Orešič M., Vidal-Puig A. Pathways to the analysis of microarray data. TRENDS in Biotechnology. 2005;23(8):429–435. doi: 10.1016/j.tibtech.2005.05.011. [DOI] [PubMed] [Google Scholar]
- 37.Werner T. Bioinformatics applications for pathway analysis of microarray data. Current Opinion in Biotechnology. 2008;19(1):50–54. doi: 10.1016/j.copbio.2007.11.005. [DOI] [PubMed] [Google Scholar]
- 38.Wu G., Feng X., Stein L. A human functional protein interaction network and its application to cancer data analysis. Genome Biology. 2010;11(5):p. R53. doi: 10.1186/gb-2010-11-5-r53. [DOI] [PMC free article] [PubMed] [Google Scholar]
- 39.Dudoit S., Gentleman R. C., Quackenbush J. Open source software for the analysis of microarray data. Biotechniques. 2003;34(13):45–51. doi: 10.2144/mar03dudoit. [DOI] [PubMed] [Google Scholar]
- 40.Howe E., Holton K., Nair S., Schlauch D., Sinha R., Quackenbush J. Biomedical Informatics for Cancer Research. Boston, MA, USA: Springer; 2010. Mev: Multiexperiment Viewer; pp. 267–277. [Google Scholar]
- 41.Tripathi S., Pohl M. O., Zhou Y., et al. Meta-and orthogonal integration of influenza OMICs data defines a role for UBR4 in virus budding. Cell Host and Microbe. 2015;18(6):723–735. doi: 10.1016/j.chom.2015.11.002. [DOI] [PMC free article] [PubMed] [Google Scholar]
- 42.Shuaichen L., Wang G. Bioinformatic analysis reveals CYP2C9 as a potential prognostic marker for HCC and liver cancer cell lines suitable for its mechanism study. Cellular and Molecular Biology. 2018;64(7):70–74. doi: 10.14715/cmb/2018.64.7.12. [DOI] [PubMed] [Google Scholar]
- 43.Kuno A., Nishimura K., Takahashi S. Time-course transcriptome analysis of human cellular reprogramming from multiple cell types reveals the drastic change occurs between the mid phase and the late phase. BMC Genomics. 2018;19(1):p. 9. doi: 10.1186/s12864-017-4389-8. [DOI] [PMC free article] [PubMed] [Google Scholar]
- 44.Wilson C. L., Miller C. J. Simpleaffy: a BioConductor package for Affymetrix quality control and data analysis. Bioinformatics. 2005;21(18):3683–3685. doi: 10.1093/bioinformatics/bti605. [DOI] [PubMed] [Google Scholar]
- 45.Irizarry R. A. Exploration, normalization, and summaries of high density oligonucleotide array probe level data. Biostatistics. 2003;4(2):249–264. doi: 10.1093/biostatistics/4.2.249. [DOI] [PubMed] [Google Scholar]
- 46.Kreil D. P., Karp N. A., Lilley K. S. DNA microarray normalization methods can remove bias from differential protein expression analysis of 2D difference gel electrophoresis results. Bioinformatics. 2004;20(13):2026–2034. doi: 10.1093/bioinformatics/bth193. [DOI] [PubMed] [Google Scholar]
- 47.Yang Y. H. Normalization for cDNA microarray data: a robust composite method addressing single and multiple slide systematic variation. Nucleic Acids Research. 2002;30(4):p. e15. doi: 10.1093/nar/30.4.e15. [DOI] [PMC free article] [PubMed] [Google Scholar]
- 48.Huang Da W., Sherman B. T., Lempicki R. A. Bioinformatics enrichment tools: paths toward the comprehensive functional analysis of large gene lists. Nucleic Acids Research. 2008;37(1):1–13. doi: 10.1093/nar/gkn923. [DOI] [PMC free article] [PubMed] [Google Scholar]
- 49.Soden S. E., Saunders C. J., Willig L. K., et al. Effectiveness of exome and genome sequencing guided by acuity of illness for diagnosis of neurodevelopmental disorders. Science Translational Medicine. 2014;6(265) doi: 10.1126/scitranslmed.3010076.265ra168 [DOI] [PMC free article] [PubMed] [Google Scholar]
- 50.Wang S., Chong Z. Z., Shang Y. C., Maiese K. Wnt1 inducible signaling pathway protein 1 (WISP1) blocks neurodegeneration through phosphoinositide 3 kinase/Akt1 and apoptotic mitochondrial signaling involving Bad, Bax, Bim, and Bcl-xL. Current Neurovascular Research. 2012;9(1):20–31. doi: 10.2174/156720212799297137. [DOI] [PMC free article] [PubMed] [Google Scholar]
- 51.Lee Y. S., Hwang S. G., Kim J. K., et al. Identification of novel therapeutic target genes in acquired lapatinib-resistant breast cancer by integrative meta-analysis. Tumor Biology. 2016;37(2):2285–2297. doi: 10.1007/s13277-015-4033-7. [DOI] [PubMed] [Google Scholar]
- 52.Tarca A. L., Draghici S., Bhatti G., Romero R. Down-weighting overlapping genes improves gene set analysis. BMC Bioinformatics. 2012;13(1):p. 136. doi: 10.1186/1471-2105-13-136. [DOI] [PMC free article] [PubMed] [Google Scholar]
- 53.Chen S.-L., Wang Z.-M., Hu Z.-Y., Li B. Genome-wide analysis of differentially expressed long noncoding RNAs induced by low shear stress in human umbilical vein endothelial cells. Integrative Molecular Medicine. 2015;2:276–289. doi: 10.15761/imm.1000154. [DOI] [Google Scholar]
- 54.Liu Z.-P., Wang Y., Zhang X.-S., Chen L. Identifying dysfunctional crosstalk of pathways in various regions of Alzheimer’s disease brains. BMC Systems Biology. 2010;4(2) doi: 10.1186/1752-0509-4-s2-s11. [DOI] [PMC free article] [PubMed] [Google Scholar]
- 55.Wang R., Wei J., Li Z., Tian Y., Du C. Bioinformatical analysis of gene expression signatures of different glioma subtypes. Oncology Letters. 2018;15(3):2807–2814. doi: 10.3892/ol.2017.7660. [DOI] [PMC free article] [PubMed] [Google Scholar]
- 56.Wang H.-Q., Xie X.-P., Zheng C.-H. A pathway-based classification method that can improve microarray-based colorectal cancer diagnosis. Proceedings of International Conference on Intelligent Computing; August 2011; Berlin, Heidelberg. Springer; [Google Scholar]
- 57.Choudhari J. K., Sahariah B. P., Choubey J. K., Patel A., Verma M. K. Identification of potential transcription factor and protein kinases for regulation of differentially expressed genes for fluoride exposure in human using Expression2Kinases (X2K) approach. Network Modeling Analysis in Health Informatics and Bioinformatics. 2017;6(1):p. 7. doi: 10.1007/s13721-017-0148-7. [DOI] [Google Scholar]
- 58.Uversky V., Na I., Landau K., Schenck R. Highly disordered proteins in prostate cancer. Current Protein and Peptide Science. 2017;18(5):453–481. doi: 10.2174/1389203717666161028145848. [DOI] [PubMed] [Google Scholar]
- 59.Weinstein E., Cui X., Simmons P. Genomic Editing of Neurodevelopmental Genes in Animals. U.S. Patent Application No. 12/842.
- 60.Nousome D. Houston, TX, USA: The University of Texas School of Public Health; 2012. Identification of genetic risk factors for cerebellar mutism in pediatric brain tumor patients. Dissertation. [Google Scholar]
- 61.Sullivan C. R., Mielnik C., O’Donovan S. M., et al. Connectivity Analyses of Bioenergetic Changes in Schizophrenia: Identification of Novel Treatments. bioRxiv; 2018. [DOI] [PMC free article] [PubMed] [Google Scholar]
- 62.Ferri A. L. M. Sox2 deficiency causes neurodegeneration and impaired neurogenesis in the adult mouse brain. Development. 2004;131(15):3805–3819. doi: 10.1242/dev.01204. [DOI] [PubMed] [Google Scholar]
- 63.Nishibori T., Tanabe Y., Su L., David M. Impaired development of CD4+CD25+ regulatory T cells in the absence of STAT1: increased susceptibility to autoimmune disease. Journal of Experimental Medicine. 2004;199(1):25–34. doi: 10.1084/jem.20020509. [DOI] [PMC free article] [PubMed] [Google Scholar]
- 64.Xiromerisiou G., Hadjigeorgiou G. M., Papadimitriou A., Katsarogiannis E., Gourbali V., Singleton A. B. Association between AKT1 gene and Parkinson’s disease: a protective haplotype. Neuroscience Letters. 2008;436(2):232–234. doi: 10.1016/j.neulet.2008.03.026. [DOI] [PMC free article] [PubMed] [Google Scholar]
- 65.Morikawa T. Association of CTNNB1 (β-catenin) alterations, body mass index, and physical activity with survival in patients with colorectal cancer. JAMA. 2011;305(16):1685–1694. doi: 10.1001/jama.2011.513. [DOI] [PMC free article] [PubMed] [Google Scholar]
- 66.Parikshak N. N., Gandal M. J., Geschwind D. H. Systems biology and gene networks in neurodevelopmental and neurodegenerative disorders. Nature Reviews Genetics. 2015;16(8):p. 441. doi: 10.1038/nrg3934. [DOI] [PMC free article] [PubMed] [Google Scholar]
- 67.Crino P. B., Trojanowski J. Q., Dichter M. A., Eberwine J. Embryonic neuronal markers in tuberous sclerosis: single-cell molecular pathology. Proceedings of the National Academy of Sciences. 1996;93(24):14152–14157. doi: 10.1073/pnas.93.24.14152. [DOI] [PMC free article] [PubMed] [Google Scholar]
Associated Data
This section collects any data citations, data availability statements, or supplementary materials included in this article.
Supplementary Materials
Gene expression matrix microarray raw files (CEL and CDF files) were used to make gene expression matrix using Affy package and RMA (robust multiarray average) method. This matrix file was used for further microarray analysis like clustering, pathway, and protein-protein interaction analysis. Pathway and protein-protein interaction result as generated from the Metascape tool is given. This file includes information about clustered formed within genes and network details with scores. Annotation and enrichment annotation file and pathway enrichment result as generated from the Metascape tool is given. Annotation file includes information about genes like gene symbol, gene description, GO biological process, protein function, and so on.
Data Availability Statement
The microarray data used to support the findings of this study are included within the supplementary information file.


