

Abstract
Ongoing objective assessment of national bovine tuberculosis (bTB) policy in Ireland is important to monitor efforts towards improved bTB control. The study objective was to investigate temporal trends in the risk of herd recurrence. The study included all herds derestricted following a bTB episode ending in 1998, 2008 or 2012. The respective ‘study periods’ were up to the end of 2001 for 1998-derestricted herds, to the end of 2011 for 2008-derestricted herds, and to the end of 2015 for 2012-derestricted herds. A multivariable Cox proportional-hazard model was developed to examine time to next restriction. The results from the model showed a continuing significant decreasing trend in herd recurrence of bTB in Ireland from 1998 until 2015: herds derestricted in 2008 were 0.75 (95 per cent CI 0.68 to 0.82) times as likely to develop a further restriction compared with 1998 herds, and herds derestricted in 2012 were 0.85 (95per cent CI 0.76 to 0.95) times as likely as 2008 herds. However, despite significant improvements, recurrence of bTB remains a concern, with 30.2 per cent (95 per cent CI 28.0 to 32.4 per cent) of herds derestricted in 2012 being re-restricted over the subsequent three years. Further work is needed to address the two key drivers of herd recurrence, namely residual infection and local reinfection.
Keywords: bovine tuberculosis, epidemiology, cattle
Introduction
More and Good (2015) have defined bovine tuberculosis (bTB) persistence as the ongoing or repeated presence of bTB (caused by infection with Mycobacterium bovis) in a herd or locality despite control efforts. It is an important feature of bTB, presenting either as herd recurrence (in a single herd) or local persistence (in a locality). The persistence of bTB can be attributed either to residual infection in cattle (i.e. cattle infected but missed during testing) or reinfection, either from local sources (such as spread from the environment, wildlife or neighbouring farms) or following cattle introduction.1 In general, one would expect the former to become less important, and the latter more important, with increasing time since last known presence of infection.
There is now substantial knowledge about aspects of these infection sources in bTB persistence. Relevant to residual infection, a number of studies have identified the heightened bTB risk in animals moved from herds where bTB had previously been identified, including Clegg and others,2 3 Wolfe and others4 and Berrian and others.5 Further, future bTB risk is increased in animals inconclusive to the single intradermal comparative tuberculin test (SICTT)6 7 or negative to the SICTT but positive to the interferon-γ test8–10. The role of local sources, including contiguous spread and wildlife, in bTB persistence is well recognised in several countries including Ireland11 12 and the UK.13 Although cattle movements contribute to bTB establishment (accounting in Ireland for approximately 7 per cent of herd restrictions),2 3 they are unlikely to play a substantial role in bTB persistence.1
To assess the relative importance of residual infection and local infection sources in bTB persistence, White and others12 attributed 15 per cent of bTB episodes (periods of herd restriction following bTB identification in a herd) in Ireland during 2006 to residual infection, between 0 and 20 per cent to contiguous spread (from neighbouring farms) and between 19 and 39 per cent to wildlife. Using within-herd transmission models, Conlan and others14 estimated that 50 per cent (33–67 per cent) of recurrent breakdowns in Britain can be attributed to residual infection, falling to 24 per cent (11–42 per cent) of recurrent breakdowns under an alternative model. These authors further suggest that improved herd testing is unlikely to substantially reduce recurrence unless external infection pressure (which they define as environmental sources and cattle movements) is simultaneously addressed. The relative importance of residual infection and local infection sources is likely to vary both in space and time, influenced by multiple factors including national bTB control policies.
There is ongoing evolution of national bTB policy in Ireland, informed by progressive advances in scientific knowledge15 16. In particular, there has been increasing focus on drivers for herd recurrence and local persistence of bTB, relating both to residual infection and local reinfection. A number of strategies are in place to maximise the probability that infection is cleared from herds while restricted, including extensive and strategic use of interferon-γ both diagnostically and as a quality assurance test8 10, and movement restrictions on inconclusive skin reactors, following the work of Clegg and others.6 7 With respect to local reinfection, a targeted badger culling policy has been in place since 2004, concentrated in areas where bTB in cattle is problematic.17 Further, Good and others18 present strategies to limit the spread of infection from contiguous herds, including extensive application of a contiguous herd programme. There has also been an increased focus on strategies to limit the consequences that could follow derestriction of herds at higher risk of persistence. In Ireland, there is differential management of herds for an extended period following derestriction, guided by factors known to influence future bTB risk, including outbreak severity, both in Ireland19 and Great Britain.20 This is consistent with the recent work of Clegg and others3, who highlighted the need for robust controls on high-risk (so-called H-) herds for an extended period post derestriction.
Ongoing objective assessment is important to monitor national efforts towards improved bTB control. In earlier work, Gallagher and others21 compared herd recurrence of bTB in Irish herds between 1998 and 2008. They found a significant reduction in herd recurrence following a bTB episode, with 2008-derestricted herds being 0.74 times (95 per cent CI 0.68 to 0.81) as likely to be restricted during the subsequent three-year study period compared with 1998-derestricted herds. The aim of the current study was to investigate whether there were significant changes in the risk of herd recurrence of bTB in Ireland in 2012-derestricted herds, which was the most recent data available at the time of the study, compared with 1998-derestricted and 2008-derestricted herds.
Materials and methods
The national Eradication Programme
In Ireland, the bTB eradication programme relies on both field and abattoir surveillance, the former based on annual testing of all herds, at least annually, using the SICTT,22 and the latter on inspection of all animals at slaughter. The SICTT involves the intradermal injection of bovine and avian tuberculins in the mid-third section of the neck, with the skin thickness at the site of the test recorded at the time of injection and 72 hours (±4 hours) later. Any animal that displays clinical signs at the bovine injection site, such as oedema, exudative necrosis, heat and/or pain, is considered positive and therefore a reactor. An animal with a positive bovine reaction which is more than 4 mm greater than the avian reaction is deemed a ‘standard reactor’. In addition, ‘non-standard reactors’ may also be identified during an episode; these include animals with a positive or inconclusive bovine reaction which is from 1 to 4 mm greater than the avian reaction (i.e. standard inconclusive reactors) and may also include animals with a positive or inconclusive bovine reaction 0 to 2 mm less than the avian reaction (ie, severe inconclusive reactors), animals with a bovine reaction of 4 mm or more regardless of any avian reaction (ie, positive to the Single Intradermal Test), animals removed for epidemiological reasons by a Veterinary Inspector regardless of reaction at the bovine site or the results of ancillary blood test(s), such as the interferon-γ assay.18 Herds are restricted from trading following the detection of at least one test reactor animal or a ‘factory lesion’ at routine slaughter, with restriction continuing until two consecutive clear full-herd SICTT tests are achieved and the herd is then derestricted. A bTB episode refers to this period of herd restriction.
The study population
The study population consisted of all Irish herds that had a bTB episode ending in either 1998, 2008 or 2012. The 2012 study herd cohort were the latest data available at the time of the study, and the earlier comparator study herd cohorts (2008 and 1998, respectively) allowed comparison with herd recurrence 4 and 10 years previously. The eligibility criteria were applied as previously by Gallagher and others,21 as follows. The study herds included all Irish herds derestricted following a bTB episode that ended in 1998, 2008 or 2012, with the derestricted episode now referred to as the ‘index’ restriction. The ‘index’ restriction involved two or more standard reactors to the SICTT noting that for this count a M bovis confirmed lesion found during abattoir surveillance in a non-reactor animal is equivalent to a standard reactor. A standard SICTT reactor was recorded when the bovine reaction was >4 mm larger than the avian reaction. For each of these study herd cohorts, the respective ‘study periods’ were up to the end of 2001 for 1998-derestricted herds, to the end of 2011 for 2008-derestricted herds and to the end of 2015 for 2012-derestricted herds. This resulted in three study periods, 1998–2001, 2008–2011 and 2012–2015 (study periods 1, 2 and 3, respectively). Each study herd was followed from the time of the end of the index restriction until either the start date of the first subsequent restriction or the date of their last test in the respective study period, whichever occurred first. If a herd was derestricted on more than one occasion during the year of interest, the latter derestriction was used. Study herds were included if the index restriction was a minimum of four months (>120 days) and a maximum of two years (<730 days). Herds that were not tested during the study period following the index restriction were excluded.
Data analysis
The outcome of interest was the time from derestriction (ie, the ending of the index restriction) to the next restriction. A number of independent variables were considered in the study, including
Year derestricted (1998, 2008 or 2012).
Those relating to the study herd at the time of derestriction (herd size, herd type (beef, dairy, suckler, other), proportion of cows).
The locality (District Electoral Division (DED)): Either the percentage of bTB herds newly restricted in the locality during the year of the index derestriction or reactor animals per thousand tests (APT) in the locality during the year of the index derestriction.
The index restriction (number of standard reactors and reactors with visible lesions during the index restriction, duration (days) of the index restriction and whether the index restriction started when a confirmed lesion was disclosed at routine abattoir surveillance).
History of bTB restriction (a bTB episode ending during the five years before the start of the index restriction (yes/no), time since the end of the previous restriction (seven years was used, if the herd was never previously restricted), number of standard reactors in previous restriction).
See Gallagher and others21 for more information.
Chi-square tests using the main demographic variables of study herds and the index restriction (herd size at the time of derestriction of the index restriction, herd type, number of standard reactors and duration of the index restriction) were used to investigate whether there was a significant (P<0.05) difference in the study population across the three study periods. Log-rank and Wilcoxon tests were used to compare survival times across the three study periods, and Kaplan-Meier survival curves were created to visually compare the time to subsequent restriction.
A multivariable Cox proportional-hazard model was developed to examine the time to next restriction. A univariable analysis on all the independent variables (listed above) was used to determine which terms to include in the initial model building. Variables with a P value of <0.2 in the univariable analysis were included in the multivariable model. Continuous independent variables were categorised into five groups based on the corresponding quintiles, as determined previously by Gallagher and others.21 Univariable models were used to assess whether to treat variables as continuous or categorical by comparing models using the Akaike Information Criteria. A backwards selection procedure based on a likelihood ratio test (P>0.05) was used to exclude variables until a final model was reached. The proportional hazards assumption was tested using a plot of the log(-log(survival)) survival lines to check for parallel curves. Schoenfeld residuals were also plotted and examined. Overall model fit was checked using scaled score residuals and deviance residuals. Analyses were conducted using SAS V.9.3.
Results
The numbers of study herds derestricted during 1998 (study period 1), 2008 (study period 2) and 2012 (study period 3) were 2452, 2626 and 1755, respectively (table 1). The percentage of subsequent restrictions for study periods 1–3 was 46.4 per cent (95 per cent CI 44.4 to 48.4 per cent), 34.7 per cent (95 per cent CI 32.9 to 36.5 per cent) and 30.2 per cent (95 per cent CI 28.0 to 32.4 per cent), respectively (table 1). Between periods 1 and 2, and also periods 2 and 3, there were significant differences in herd size, the proportion of derestricted herds in the largest herd size category (≥158 animals) increased from 19.0 per cent in 1998 to 26.5 per cent in 2012 (table 2). The proportion of derestricted herds that were dairy herds was lowest (31.3 per cent) in 2008 compared with the other two years (43.9 per cent in 1998 and 39.6 per cent in 2012). In 2012, fewer derestricted herds (16.8 per cent) had an index restriction duration of ≥255 days compared with the other two years (19.4 per cent in 1998 and 20.3 per cent in 2008). The number of standard reactors per restriction was significantly different between periods 2 and 3 but not periods 1 and 2 (table 2). Index restrictions with more than eight standard reactors decreased over time from 17.2 to 13.8 per cent and the proportion with 2 to 3 standard reactors increased from 48.3 to 54.1 per cent. The Kaplan-Meier probabilities of surviving for three years without a restriction for herds derestricted in 1998, 2008 and 2012 were 0.56, 0.67 and 0.71, respectively (log-rank test, P<0.001). Kaplan-Meier survival curves are presented in figure 1.
Table 1.
The univariable association between the percentage of derestricted herds that were subsequently restricted and independent variables
| Variable | Class | Herds (n) | Subsequent restrictions (n) | Subsequent restrictions (%) | P values (chi-square test) |
| Year derestricted | 1998 | 2452 | 1138 | 46.41 | <0.001 |
| 2008 | 2626 | 912 | 34.73 | ||
| 2012 | 1755 | 530 | 30.20 | ||
| Relating to the study herd | |||||
| Herd size | 1–34 | 1365 | 360 | 26.37 | <0.001 |
| 35–63 | 1319 | 409 | 31.01 | ||
| 64–101 | 1335 | 516 | 38.65 | ||
| 102–157 | 1350 | 579 | 42.89 | ||
| ≥158 | 1464 | 716 | 48.91 | ||
| Herd type | Beef | 879 | 336 | 38.23 | <0.001 |
| Dairy | 2595 | 1167 | 44.97 | ||
| Other | 251 | 75 | 29.88 | ||
| Suckler | 3108 | 1002 | 32.24 | ||
| Proportion of cows at derestriction | 0–0.19 | 1352 | 528 | 39.05 | 0.246 |
| 0.20–0.29 | 1347 | 529 | 39.27 | ||
| 0.30–0.34 | 1194 | 431 | 36.1 | ||
| 0.35–0.41 | 1596 | 578 | 36.22 | ||
| 0.42–1 | 1344 | 514 | 38.24 | ||
| Relating to the locality | |||||
| Location: bTB herd incidence in the DED | 0–4.35 | 1707 | 489 | 28.65 | <0.001 |
| 4.36–7.50 | 1453 | 536 | 36.89 | ||
| 7.51–11.36 | 1293 | 488 | 37.74 | ||
| 11.37–16.66 | 1251 | 533 | 42.61 | ||
| >16.66 | 1129 | 534 | 47.3 | ||
| Reactor APT in the DED | 0–1.33 | 1713 | 515 | 30.06 | <0.001 |
| 1.34–3.03 | 1437 | 537 | 37.37 | ||
| 3.04–5.57 | 1274 | 467 | 36.66 | ||
| 5.58–9.90 | 1250 | 534 | 42.72 | ||
| >9.90 | 1159 | 527 | 45.47 | ||
| Relating to the index restriction | |||||
| Standard reactors per restriction | 1* | 345 | 136 | 39.42 | <0.001 |
| 2–3 | 3455 | 1163 | 33.66 | ||
| 4–8 | 1945 | 775 | 39.85 | ||
| >8 | 1088 | 506 | 46.51 | ||
| Number of reactor cattle with visible lesions | 1 | 1763 | 648 | 36.76 | <0.001 |
| 2–3 | 1678 | 649 | 38.68 | ||
| 4–8 | 903 | 370 | 40.97 | ||
| >8 | 387 | 183 | 47.29 | ||
| Duration of restriction (days) | 120–140 | 1444 | 518 | 35.87 | <0.001 |
| 141–155 | 1507 | 505 | 33.51 | ||
| 156–203 | 1230 | 452 | 36.75 | ||
| 204–254 | 1346 | 521 | 38.71 | ||
| ≥255 | 1306 | 584 | 44.72 | ||
| Triggered through abattoir surveillance? | No | 5798 | 2151 | 37.1 | 0.008 |
| Yes | 1035 | 429 | 41.45 | ||
| bTB history | |||||
| History of bTB restriction | No | 3640 | 1171 | 32.17 | <0.001 |
| Yes | 3193 | 1409 | 44.13 | ||
| Time since previous restriction | 19–566 | 1390 | 662 | 47.63 | <0.001 |
| 567–1443 | 1394 | 587 | 42.11 | ||
| ≥1444 | 4049 | 1331 | 32.87 | ||
| Standard reactors in previous restriction | 0 | 3035 | 1072 | 35.32 | <0.001 |
| 1 | 1501 | 566 | 37.71 | ||
| 2–3 | 1108 | 453 | 40.88 | ||
| 4–8 | 745 | 291 | 39.06 | ||
| >8 | 444 | 198 | 44.59 | ||
*Includes confirmed case by abattoir surveillance followed by one standard reactor.
APT, animals per thousand tests; bTB, bovine tuberculosis; DED, District Electoral Division.
Table 2.
Distribution of selected independent variables by year of derestriction
| Variable | Class | Herds derestricted in 1998 | Herds derestricted in 2008 | Herds derestricted in 2012 | P Values† | P Values‡ | |||
| Number | % | Number | % | Number | % | ||||
| Herd size | 1–34 | 452 | 18.43 | 585 | 22.28 | 328 | 18.69 | <0.001 | <0.001 |
| 35–63 | 482 | 19.66 | 523 | 19.92 | 314 | 17.89 | |||
| 64–101 | 542 | 22.1 | 473 | 18.01 | 320 | 18.23 | |||
| 102–157 | 511 | 20.84 | 511 | 19.46 | 328 | 18.69 | |||
| ≥158 | 465 | 18.96 | 534 | 20.34 | 465 | 26.5 | |||
| Herd type | Beef | 307 | 12.52 | 359 | 13.67 | 213 | 12.14 | <0.001 | <0.001 |
| Dairy | 1077 | 43.92 | 823 | 31.34 | 695 | 39.6 | |||
| Other | 11 | 0.45 | 161 | 6.13 | 79 | 4.5 | |||
| Suckler | 1057 | 43.11 | 1283 | 48.86 | 768 | 43.76 | |||
| Standard reactors per restriction | 1* | 123 | 5.02 | 145 | 5.52 | 77 | 4.39 | 0.310 | 0.026 |
| 2–3 | 1184 | 48.29 | 1322 | 50.34 | 949 | 54.07 | |||
| 4–8 | 722 | 29.45 | 736 | 28.03 | 487 | 27.75 | |||
| >8 | 423 | 17.25 | 423 | 16.11 | 242 | 13.79 | |||
| Duration of restriction | 120–140 | 645 | 26.31 | 454 | 17.29 | 345 | 19.66 | <0.001 | <0.001 |
| 141–155 | 332 | 13.54 | 641 | 24.41 | 534 | 30.43 | |||
| 156–203 | 556 | 22.68 | 455 | 17.33 | 219 | 12.48 | |||
| 204–254 | 442 | 18.03 | 542 | 20.64 | 362 | 20.63 | |||
| ≥255 | 477 | 19.45 | 534 | 20.34 | 295 | 16.81 | |||
* Includes confirmed case by abattoir surveillance followed by one standard reactor.
†Denotes the P value of a chi-square test between herds derestricted in 1998 and 2008
‡ Denotes the P value of a chi-square test between herds derestricted in 2008 and 2012
Figure 1.
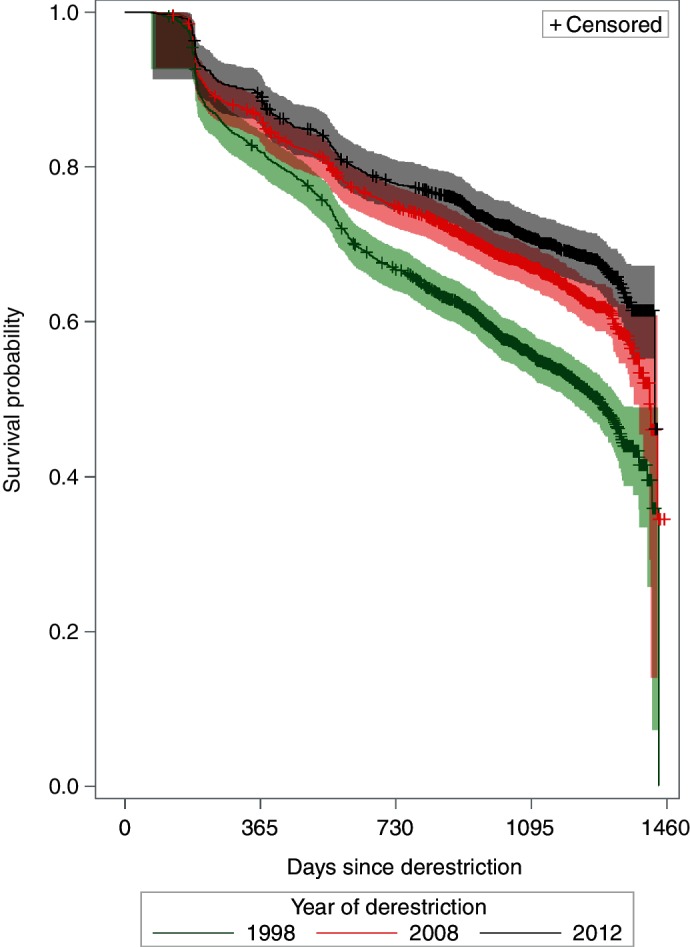
Kaplan-Meier survival estimates of time to subsequent restriction, by year of derestriction.
All independent variables considered in the univariable analysis were significant, with the exception of the proportion of cows at derestriction (table 1). In the final multivariable model, the following six variables were included: year of derestriction, herd size, herd type, standard reactors per restriction, bTB herd incidence in DED and history of bTB restriction.
Herds derestricted in 2012 were 0.85 (95 per cent CI 0.76 to 0.95) times as likely to be restricted in the subsequent period compared with 2008 herds. This follows the trend seen when comparing 2008 herds to 1998 herds, with an HR of 0.75 (95 per cent CI 0.68 to 0.82) (table 3). There was also a trend of increasing hazard of future restrictions associated with increasing herd size, increasing number of standard reactors, increasing bTB herd incidence in the DED and a history of bTB restriction. The hazard varied across herd type, with dairy and suckler herds showing significantly lower chances of subsequent restrictions compared with beef herds (table 3).
Table 3.
Final Cox-proportional hazards model of time from derestriction to next restriction
| Covariates | HR | P values | 95% CI | |
| Lower | Upper | |||
| Year of derestriction | ||||
| 2008 (referent: 1998) | 0.749 | <0.001 | 0.685 | 0.819 |
| 2012 (referent: 2008) | 0.849 | 0.0036 | 0.761 | 0.948 |
| Herd size (referent: 1–34 animals) | ||||
| 35–63 | 1.161 | 0.0412 | 1.006 | 1.340 |
| 64–101 | 1.431 | <0.001 | 1.244 | 1.646 |
| 102–157 | 1.637 | <0.001 | 1.419 | 1.889 |
| ≥158 | 1.902 | <0.001 | 1.643 | 2.201 |
| Herd type (referent: beef) | ||||
| Dairy | 0.816 | 0.0028 | 0.714 | 0.932 |
| Other | 0.723 | 0.0125 | 0.561 | 0.933 |
| Suckler | 0.749 | <0.001 | 0.661 | 0.849 |
| Standard reactors per restriction (referent: one reactor) | ||||
| 2–3 | 0.884 | 0.1749 | 0.739 | 1.057 |
| 4–8 | 1.012 | 0.8989 | 0.842 | 1.216 |
| >8 | 1.187 | 0.0787 | 0.981 | 1.437 |
| bTB herd incidence in DED (referent: 0%–4.35%) | ||||
| 4.36–7.50 | 1.266 | 0.0002 | 1.119 | 1.432 |
| 7.51–11.36 | 1.305 | <0.001 | 1.150 | 1.483 |
| 11.37–16.66 | 1.550 | <0.001 | 1.368 | 1.756 |
| >16.66 | 1.761 | <0.001 | 1.551 | 2.000 |
| History of bTB restriction (referent: no) | ||||
| Yes | 1.285 | <0.001 | 1.186 | 1.392 |
bTB, bovine tuberculosis; DED, District Electoral Division.
Discussion
In this study, the authors have focused on herd recurrence of bTB instead of herd bTB incidence, specifically to focus on the issue of bTB control in herds already known to be infected. There has been a continuing significant decreasing trend in herd recurrence of bTB in Ireland since 1998 until 2015: herds derestricted in 2008 were 0.75 times as likely to develop a further restriction compared with 1998 herds (as reported previously by Gallagher and others21), and herds derestricted in 2012 were 0.85 times as likely as 2008 herds (table 3). This ongoing improvement is reassuring and gives confidence in the multiple control strategies that contribute to the national bTB eradication programme. The observed reduction in bTB recurrence cannot be attributed to single policy changes, given that bTB herd recurrence is influenced by both residual infection and local reinfection. The national programme is evolving, informed by ongoing scientific research, which most recently have focused on issues relating to surveillance and control, and to both cattle and wildlife.3 17 23–27
Results regarding other variables within the model were very similar to the patterns found in the previous paper,21 with the exception of herd type. Previously suckler herds had the lowest risk of a future breakdown whereas ‘other’ herds now have the lowest risk, with beef herds having the highest risk in both models. The results are also similar to other studies that looked at the risk of recurrence.19 20 28–30 Larger herds were at the highest risk of recurrence12 19 28–30 for reasons that are not entirely clear. As suggested previously,1 increasing herd size may increase opportunity for exposure, both within the herd and from neighbouring herds.12 31 In addition, herd-level specificity will decrease as the number of individuals being tested within each herd increases.32 Several authors have identified beef herds in Ireland at highest risk of recurrence.21 29 The reasons remain unclear, with Gallagher and others21 speculating that management differences may be driving the higher recurrence in beef herds since they are generally less accustomed to human contact compared with dairy animals. Testers may face greater difficulties with test consistency when performing the SICTT (a test conducted in the field) on non-compliant animals in facilities where restraint is poor.22
Increasing severity of previous restrictions has frequently been identified as a risk factor for recurrence in other studies.19 28 29 In a study of new breakdowns in 2012, Clegg and others3 found that the risk of a new restriction was related to both the severity of, and time since, a previous restriction. In this study, risk increased following breakdowns of two or more standard reactors and during the first two years following derestriction. However, the risk persisted for extended periods following derestriction. White and others12 also found history of bTB to be a significant risk factor, with risk of recurrence increased for up to five years since a previous restriction.
The bTB herd incidence in the locality also increased the risk of recurrence, in common with previous studies.12 29 30 Doyle and others30 found a significant increase in recurrence when the local prevalence was above 12 per cent. In the current study, risk of recurrence was higher when the local incidence was 4.4 per cent or higher. White and others12 found an increased incidence of bTB associated both with herds that were directly contiguous and those at a distance of >25 m, concluding that the best explanation of the locality risk for herds at a distance of >25 m was an infected wildlife source.
Over the study period, the herd size of derestricted herds has increased (table 2). This reflects the general change in farming practices in Irish farms over this time period, with the average herd size in Ireland increasing from 56.9 to 57.733 34 between 2008 and 2012. There were no figures available for 1998; however, the nearest available year was 2003 when the national average herd size was 53.3.35 There were various increases and decreases in the proportion of derestricted herds by herd type, with decreases in dairy herds derestricted when comparing 1998 (43.9 per cent) with 2012 (39.6 per cent) and increases in ‘other’ herds (0.4 per cent in 1998 compared with 4.5 per cent in 2012). Herd type was accounted for in the model as a confounder; therefore, the reported decrease in risk of recurrence over time was after accounting for differences in herd size, type, etc. In 2012, a lower proportion of derestricted herds had more than eight reactors (13.8 per cent) compared with 1998 (17.2 per cent) (table 2) and a higher proportion of derestricted herds had 2–3 reactors (54 per cent in 2012 and 48.3 per cent in 1998). In addition, the proportion of derestricted herds in 2012 with longer duration restrictions (16.8 per cent) was lower than in 1998 (19.4 per cent). These latter observations may also reflect an improving situation in the control of infected herds resulting in shorter, less severe restrictions. An earlier comparison in bTB trends across the UK and Ireland36 is currently being extended to also consider restriction comparison of the frequency, duration and severity of bTB restrictions.
Three different herd cohorts were considered in this study, in each case allowing three years for follow-up. The 2012 herd cohort represented the most recent data available, and comparator herd cohorts were chosen to allow critical evaluation of herd recurrence in Ireland over a 10-year period (the 2008 compared with the 1998 herd cohort) and a shorter period (the 2012 compared with the 2008 herd cohort). Building on previous work by Gallagher and others,21 the current study was conducted to provide policymakers with updated information concerning the impact of recent changes to the national eradication programme. Key policy changes relevant to bTB control have included objective measurement of tester performance,37 increased use of interferon-γ both diagnostically (routinely in herds with four or more reactors to the SICTT) and as part of general quality assurance of the SICTT testing,8 10 restriction of inconclusive reactors to the herd of origin with lifelong movement restriction38 following work by Clegg and others6 7, and increased controls on herds contiguous to high-risk breakdowns following the work by White and others12 since 2012. Wildlife management has continued to evolve, consequent to increasing knowledge of badger bTB vaccination39–42; however, these changes will only impact the 2012 herd cohort.
Despite these significant improvements, herd recurrence of bTB in Ireland remains a concern, with 30.2 per cent of herds derestricted in 2012 being re-restricted over the subsequent three years (table 1). Much more needs to be done to address the two key drivers of herd recurrence, namely residual infection and local reinfection. With respect to residual infection, relevant EU legislation (Council Directive 64/432/EEC) allows herd derestriction following two clear full herd tests conducted at least two months apart. As highlighted previously, however, there is now robust evidence, both from observational and modelling studies, of the presence of infected but undetected animals in previously infected herds. Further, as discussed previously, animals from these herds pose a heightened bTB risk for some years into the future. Therefore, in the authors' view, these risks can only be controlled with a substantial departure from the current legislative baseline. There are lessons to be learnt from the successful bTB eradication programme in Australia, where three key strategies were used to manage residual infection.38 First, risk-based trading was used throughout the programme to facilitate ongoing trade while also limiting any associated bTB risks. Using this approach, commerce could continue in the face of very lengthy periods of herd restriction (herds were not entirely free to trade until eight years after detection of the last infected animal). Second, infection risk was always assessed at the level of the herd (or area), rather than the individual. Finally, there was progressive tightening of controls as the programme progressed. With respect to local reinfection, considerable progress is being made in Ireland to reduce the risk posed by badgers, currently through culling but with a progressive shift towards badger vaccination. Efforts to limit residual infection will, by default, also impact other sources of introduction, including spread from introduced cattle and from cattle on neighbouring farms.
This study highlights continuing improvement in the risk of recurrence of herd restrictions due to bTB in Ireland: herds derestricted in 2008 were 0.75 (95 per cent CI 0.68 to 0.82) times as likely to develop a further restriction compared with 1998 herds, and herds derestricted in 2012 were 0.85 (95 per cent CI 0.76 to 0.95) times as likely as 2008 herds. Nonetheless, recurrence of bTB remains a concern in Ireland, with 30.2 per cent (95 per cent CI 28.0 to 32.4 per cent) of herds derestricted in 2012 being re-restricted over the subsequent three years. Ongoing measurement of the bTB eradication programme will be important to understand whether new measures are having an impact on the control of bTB within infected herds. Upcoming changes to the future programme include a nationwide vaccination programme for badgers and increased controls on movements from high-risk herds. It would be valuable to conduct a similar analysis in 3–5 years to critically evaluate the impact of these and other changes.
Footnotes
Funding: This research received no specific grant from any funding agency in the public, commercial or not-for-profit sectors.
Competing interests: None declared.
Provenance and peer review: Not commissioned; externally peer reviewed.
References
- 1.More SJ, Good M. Understanding and managing bTB risk: perspectives from Ireland. Vet Microbiol 2015;176:209–18. 10.1016/j.vetmic.2015.01.026 [DOI] [PubMed] [Google Scholar]
- 2.Clegg TA, More SJ, Higgins IM, et al. Potential infection-control benefit for Ireland from pre-movement testing of cattle for tuberculosis. Prev Vet Med 2008;84:94–111. 10.1016/j.prevetmed.2007.11.004 [DOI] [PubMed] [Google Scholar]
- 3.Clegg TA, Good M, More SJ. Future risk of bovine tuberculosis recurrence among higher risk herds in Ireland. Prev Vet Med 2015;118:71–9. 10.1016/j.prevetmed.2014.11.013 [DOI] [PubMed] [Google Scholar]
- 4.Wolfe DM, Berke O, More SJ, et al. The risk of a positive test for bovine tuberculosis in cattle purchased from herds with and without a recent history of bovine tuberculosis in Ireland. Prev Vet Med 2009;92:99–105. 10.1016/j.prevetmed.2009.07.012 [DOI] [PubMed] [Google Scholar]
- 5.Berrian AM, O’Keeffe J, White PW, et al. Risk of bovine tuberculosis for cattle sold out from herds during 2005 in Ireland. Vet Rec 2012;170:620 10.1136/vr.100674 [DOI] [PubMed] [Google Scholar]
- 6.Clegg TA, Good M, Duignan A, et al. Longer-term risk of Mycobacterium bovis in Irish cattle following an inconclusive diagnosis to the single intradermal comparative tuberculin test. Prev Vet Med 2011;100:147–54. 10.1016/j.prevetmed.2011.02.015 [DOI] [PubMed] [Google Scholar]
- 7.Clegg TA, Good M, Duignan A, et al. Shorter-term risk of Mycobacterium bovis in Irish cattle following an inconclusive diagnosis to the single intradermal comparative tuberculin test. Prev Vet Med 2011;102:255–64. 10.1016/j.prevetmed.2011.07.014 [DOI] [PubMed] [Google Scholar]
- 8.Gormley E, Doyle MB, Fitzsimons T, et al. Diagnosis of Mycobacterium bovis infection in cattle by use of the gamma-interferon (Bovigam) assay. Vet Microbiol 2006;112:171–9. 10.1016/j.vetmic.2005.11.029 [DOI] [PubMed] [Google Scholar]
- 9.Lahuerta-Marin A, Gallagher M, McBride S, et al. Should they stay, or should they go? Relative future risk of bovine tuberculosis for interferon-gamma test-positive cattle left on farms. Vet Res 2015;46:90 10.1186/s13567-015-0242-8 [DOI] [PMC free article] [PubMed] [Google Scholar]
- 10.Clegg TA, Good M, Doyle M, et al. The performance of the interferon gamma assay when used as a diagnostic or quality assurance test in Mycobacterium bovis infected herds. Prev Vet Med 2017;140:116–21. 10.1016/j.prevetmed.2017.03.007 [DOI] [PubMed] [Google Scholar]
- 11.Griffin JM, Williams DH, Kelly GE, et al. The impact of badger removal on the control of tuberculosis in cattle herds in Ireland. Prev Vet Med 2005;67:237–66. 10.1016/j.prevetmed.2004.10.009 [DOI] [PubMed] [Google Scholar]
- 12.White PW, Martin SW, De Jong MC, et al. The importance of ’neighbourhood' in the persistence of bovine tuberculosis in Irish cattle herds. Prev Vet Med 2013;110:346–55. 10.1016/j.prevetmed.2013.02.012 [DOI] [PubMed] [Google Scholar]
- 13.Godfray HC, Donnelly CA, Kao RR, et al. A restatement of the natural science evidence base relevant to the control of bovine tuberculosis in Great Britain. Proc Biol Sci 2013;280:20131634 10.1098/rspb.2013.1634 [DOI] [PMC free article] [PubMed] [Google Scholar]
- 14.Conlan AJ, McKinley TJ, Karolemeas K, et al. Estimating the hidden burden of bovine tuberculosis in Great Britain. PLoS Comput Biol 2012;8:e1002730 10.1371/journal.pcbi.1002730 [DOI] [PMC free article] [PubMed] [Google Scholar]
- 15.More SJ, Good M. The tuberculosis eradication programme in Ireland: a review of scientific and policy advances since 1988. Vet Microbiol 2006;112:239–51. 10.1016/j.vetmic.2005.11.022 [DOI] [PubMed] [Google Scholar]
- 16.Sheridan M. Progress in tuberculosis eradication in Ireland. Vet Microbiol 2011;151:160–9. 10.1016/j.vetmic.2011.02.040 [DOI] [PubMed] [Google Scholar]
- 17.Byrne AW, Kenny K, Fogarty U, et al. Spatial and temporal analyses of metrics of tuberculosis infection in badgers (Meles meles) from the Republic of Ireland: Trends in apparent prevalence. Prev Vet Med 2015;122:345–54. 10.1016/j.prevetmed.2015.10.013 [DOI] [PubMed] [Google Scholar]
- 18.Good M, Duignan A, Maher P. Veterinary handbook on herd management in the bovine TB eradication programme. 2010. http://www.agriculture.gov.ie/media/migration/animalhealthwelfare/diseasecontrols/tuberculosistbandbrucellosis/diseaseeradicationpolicy/TBHandbook2010070710.pdf (accessed 4 Oct 2016).
- 19.Olea-Popelka FJ, White PW, Collins JD, et al. Breakdown severity during a bovine tuberculosis episode as a predictor of future herd breakdowns in Ireland. Prev Vet Med 2004;63:163–72. 10.1016/j.prevetmed.2004.03.001 [DOI] [PubMed] [Google Scholar]
- 20.Karolemeas K, McKinley TJ, Clifton-Hadley RS, et al. Recurrence of bovine tuberculosis breakdowns in Great Britain: risk factors and prediction. Prev Vet Med 2011;102:22–9. 10.1016/j.prevetmed.2011.06.004 [DOI] [PubMed] [Google Scholar]
- 21.Gallagher MJ, Higgins IM, Clegg TA, et al. Comparison of bovine tuberculosis recurrence in Irish herds between 1998 and 2008. Prev Vet Med 2013;111:237–44. 10.1016/j.prevetmed.2013.05.004 [DOI] [PubMed] [Google Scholar]
- 22.Monaghan ML, Doherty ML, Collins JD, et al. The tuberculin test. Vet Microbiol 1994;40:111–24. 10.1016/0378-1135(94)90050-7 [DOI] [PubMed] [Google Scholar]
- 23.Clegg TA, Duignan A, More SJ. The relative effectiveness of testers during field surveillance for bovine tuberculosis in unrestricted low-risk herds in Ireland. Prev Vet Med 2015;119:85–9. 10.1016/j.prevetmed.2015.02.005 [DOI] [PubMed] [Google Scholar]
- 24.Clegg TA, Good M, More SJ. Risk factors for cattle presenting with a confirmed bTB lesion at slaughter, from herds with no evidence of within-herd transmission. Prev Vet Med 2016;126:111–20. 10.1016/j.prevetmed.2016.02.003 [DOI] [PubMed] [Google Scholar]
- 25.Clegg TA, Good M, Hayes M, et al. Trends and predictors of large tuberculosis episodes in cattle herds in ireland. Front Vet Sci 2018;5:346 10.3389/fvets.2018.00086 [DOI] [PMC free article] [PubMed] [Google Scholar]
- 26.Richardson IW, Berry DP, Wiencko HL, et al. A genome-wide association study for genetic susceptibility to Mycobacterium bovis infection in dairy cattle identifies a susceptibility QTL on chromosome 23. Genet Sel Evol 2016;48:1 10.1186/s12711-016-0197-x [DOI] [PMC free article] [PubMed] [Google Scholar]
- 27.Willeberg PW, McAloon CG, Houtsma E, et al. The herd-level sensitivity of abattoir surveillance for bovine tuberculosis: Simulating the effects of current and potentially modified meat inspection procedures in irish cattle. Front Vet Sci 2018;5:82 10.3389/fvets.2018.00082 [DOI] [PMC free article] [PubMed] [Google Scholar]
- 28.Wolfe DM, Berke O, Kelton DF, et al. From explanation to prediction: a model for recurrent bovine tuberculosis in Irish cattle herds. Prev Vet Med 2010;94:170–7. 10.1016/j.prevetmed.2010.02.010 [DOI] [PubMed] [Google Scholar]
- 29.Clegg TA, Blake M, Healy R, et al. The impact of animal introductions during herd restrictions on future herd-level bovine tuberculosis risk. Prev Vet Med 2013;109:246–57. 10.1016/j.prevetmed.2012.10.005 [DOI] [PubMed] [Google Scholar]
- 30.Doyle LP, Gordon AW, Abernethy DA, et al. Bovine tuberculosis in Northern Ireland: risk factors associated with time from post-outbreak test to subsequent herd breakdown. Prev Vet Med 2014;116:47–55. 10.1016/j.prevetmed.2014.06.010 [DOI] [PubMed] [Google Scholar]
- 31.Griffin JM, Martin SW, Thorburn MA, et al. A case-control study on the association of selected risk factors with the occurrence of bovine tuberculosis in the Republic of Ireland. Prev Vet Med 1996;27:217–29. 10.1016/0167-5877(95)00571-4 [DOI] [Google Scholar]
- 32.Martin SW, Shoukri M, Thorburn MA. Evaluating the health status of herds based on tests applied to individuals. Prev Vet Med 1992;14:33–43. 10.1016/0167-5877(92)90082-Q [DOI] [Google Scholar]
- 33.Department of Agriculture, Fisheries and Food, 2008. AIM bovine statistics report https://www.agriculture.gov.ie/media/migration/animalhealthwelfare/animalidentificationandmovement/cattlemovementmonitoringsystem/AIM%20Bovine%20Statistics%20Report%202008%20Ver1.pdf (accessed 11 Jul 2017).
- 34.Department of Agriculture Food and the Marine, 2012. AIM Bovine Statistics Report https://www.agriculture.gov.ie/media/migration/animalhealthwelfare/animalidentificationandmovement/AIMBOVINESTATISTICSREPORT2012220513.pdf (accessed 11 Jul 2017).
- 35.Department of Agriculture and Food, 2003. CMMS Statistics Report www.agriculture.gov.ie/media/migration/animalhealthwelfare/animalidentificationandmovement/cattlemovementmonitoringsystem/cmms_stats.pdf (accessed 11 Jul 2017).
- 36.Abernethy DA, Upton P, Higgins IM, et al. Bovine tuberculosis trends in the UK and the Republic of Ireland, 1995-2010. Vet Rec 2013;172:312 10.1136/vr.100969 [DOI] [PubMed] [Google Scholar]
- 37.Duignan A, Good M, More SJ. Quality control in the national bovine tuberculosis eradication programme in Ireland. Rev Sci Tech 2012;31:845–60. 10.20506/rst.31.3.2166 [DOI] [PubMed] [Google Scholar]
- 38.More SJ, Radunz B, Glanville RJ. Lessons learned during the successful eradication of bovine tuberculosis from Australia. Vet Rec 2015;177:224–32. 10.1136/vr.103163 [DOI] [PMC free article] [PubMed] [Google Scholar]
- 39.Aznar I, McGrath G, Murphy D, et al. Trial design to estimate the effect of vaccination on tuberculosis incidence in badgers. Vet Microbiol 2011;151:104–11. 10.1016/j.vetmic.2011.02.032 [DOI] [PubMed] [Google Scholar]
- 40.Aznar I, More SJ, Frankena K, et al. Estimating the power of a Mycobacterium bovis vaccine trial in Irish badgers. Prev Vet Med 2013;111:297–303. 10.1016/j.prevetmed.2013.05.007 [DOI] [PubMed] [Google Scholar]
- 41.Aznar I, Frankena K, More SJ, et al. Optimising and evaluating the characteristics of a multiple antigen ELISA for detection of Mycobacterium bovis infection in a badger vaccine field trial. PLoS One 2014;9:e100139 10.1371/journal.pone.0100139 [DOI] [PMC free article] [PubMed] [Google Scholar]
- 42.Gormley E, Ní Bhuachalla D, O’Keeffe J, et al. Oral Vaccination of Free-Living Badgers (Meles meles) with Bacille Calmette Guérin (BCG) Vaccine Confers Protection against Tuberculosis. PLoS One 2017;12:e0168851 10.1371/journal.pone.0168851 [DOI] [PMC free article] [PubMed] [Google Scholar]