

Abstract
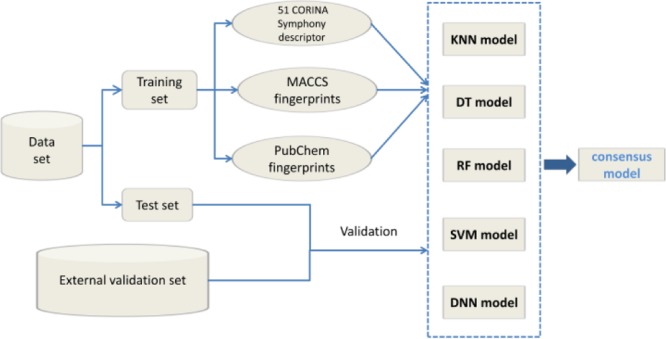
HIV-1 protease plays an important role in the processing of virus infection. Protease is an effective therapeutic target for the treatment of HIV-1. Our data set is based on a selection of 4855 HIV-1 protease inhibitors (PIs) from ChEMBL. A series of 15 classification models for predicting the active inhibitors were built by machine learning methods, including k-nearest neighors (K-NN), decision tree (DT), random forest (RF), support vector machine (SVM), and deep neural network (DNN). The molecular structures were characterized by (1) fingerprint descriptors including MACCS fingerprints and PubChem fingerprints and (2) physicochemical descriptors calculated by CORINA Symphony. The prediction accuracies of all of the models are more than 70% on the test set; the best accuracy of 83.07% was obtained by model 4A, which was built by the SVM method based on MACCS fingerprint descriptors. Nine consensus models were built with three kinds of different descriptors, which combined all of the machine learning methods using the “consensus prediction”. Model C3a developed with MACCS fingerprint descriptors showed the highest accuracy on both training set (91.96%) and test set (83.15%). An external validation set including 35 989 compounds from DUD database and 239 active inhibitors from the recent literature was used to verify the performance of our model. The best prediction accuracy of 98.37% was obtained by model 3C, which was built by RF based on CORINA Symphony descriptors. In addition, from the analysis of molecular descriptors, it shows that the aromatic system and atoms related to hydrogen bonding provide important contributions to the bioactivity of PIs.
Introduction
AIDS (acquired immune deficiency syndrome) has been a serious threat to human health since it was first reported in 1981. HIV (human immunodeficiency virus) is a pathogenic retrovirus which is divided into HIV-1 and HIV-2. HIV-1 which widely spreads in the world is the main infectious agent.1 HIV-1 protease plays an important role in catalyzing the transformation from an immature noninfectious virus to a mature infectious virus.2 For the cure of HIV-1 infection, HIV-1 protease is an effective therapeutic target.3 HIV-1 protease inhibitors (PIs) are used as drugs against AIDS in the past years.4 PIs are also members of highly active antiretroviral therapy.5 The PI drugs that have been approved by FDA during 1995–1999 were saquinavir (1995), ritonavir (1996), indinavir (1996), nelfinavir (1997), and amprenavir (1999).6 However, some limitations affect these drugs, such as low bioavailability and short half-life. Moreover, extensive toxicity, gastrointestinal symptoms, and drug resistance have also been reported.6,7 Several PI drugs such as lopinavir (2002), atazanavir (2003), tipranavir, and darunavir (2005) have also been approved by FDA in recent years, but the emergence of drug-resistant and cross-resistant HIV-1 variants still appeared.6 Thus, developing new PIs for the treatment of HIV-1 is still an ongoing need.
Structure–activity relationship (SAR) and quantitative structure activity relationship (QSAR) models are useful methods for studying the bioactivity of PIs. A mathematical model is used for expressing the relationship of the molecular structural features and their biological activities.8 In the work of Deeb and Goodarzi, partial least square and support vector machine (SVM) methods were used to develop QSAR models to predict the inhibitory activity. The data set included 46 nonpeptide HIV-1 PIs. It was divided into a training set which included 39 (85%) inhibitors and a test set which included 7 (15%) inhibitors. The coefficients of determination (R2) for the training set and the test set were 0.9800 and 0.9355, respectively.9 Using the SAR models, Ali and colleagues evaluated a set of HIV-1 PIs containing phenyloxazolidinone to enhance the antiviral potency of the compounds and obtained several new nM potent inhibitors with a hydroxyethylamine core.10
In this work, we collected 4855 HIV-1 PIs from the ChEMBL database11 as our data set. Then, computational models were built to classify the protease active inhibitors on the basis of their bioactivity. The models were computed by machine learning methods of k-nearest neighbors (k-NN), decision tree (DT), random forest (RF), SVM, and deep neural network (DNN). Using the models built in this work, a molecule can efficiently be predicted whether it is an active inhibitor for HIV-1 protease efficiently. The computational models can be used for virtual screening and give helpful information for drug design and the synthesis of HIV-1 PIs.
Materials and Methods
Data Set
We collected 4855 molecules and their bioactivity (IC50/Ki) values of HIV-1 PIs from ChEMBL.11 The compounds have been checked according to the literature as shown in the Supporting Information. Taking 10 nM as the threshold, the compounds were classified as active inhibitors when they were PI-positive and weakly active or inactive inhibitors when they were PI-negative. According to this rule, the data set contained 2004 PI-positive and 2851 PIs-negative compounds. In this work, the data set was separated into a training set and a test set by randomly splitting it in a 2:1 ratio. The training set which contained 3236 compounds was used to establish a model, and the test set which involved 1619 compounds was used to validate a model (as shown in Table 1).
Table 1. Data Set Involved in This Study.
| data set | PIs positive | PIs negative | total | |
|---|---|---|---|---|
| training set | ChEMBL | 1322 | 1914 | 3236 |
| test set | ChEMBL | 683 | 936 | 1619 |
| external validation set | DUD literature | 239 | 35 750 | 35 989 |
Molecular Descriptors
We calculated two types of molecular descriptors: two different kinds of fingerprints and CORINA Symphony12 descriptors. MACCS fingerprints included 166 patterns and PubChem fingerprints included 881 patterns, which were calculated by the PaDEL Descriptor software.13
CORINA Symphony was used to calculate chemical and physicochemical properties of a compound. Two hundred and fourteen CORINA Symphony descriptors, which include 22 global, 8 size and shape, 88 two-dimensional (2D) property-weighted autocorrelation, and 96 three-dimensional (3D) property-weighted autocorrelation descriptors, were calculated.
Global molecular descriptors express a chemical structure by a chemical, structural, or physicochemical feature or a property of the molecule represented by a numerical value. For example, HAccN means the number of hydrogen bonding acceptor atoms derived from the sum of nitrogen atoms in the molecule. Size and shape descriptors characterize the size and the 3D shape of a molecule by a numerical value, such as aspheric which means molecular asphericity.12
2D property-weighted autocorrelation descriptors use the 2D structure of a molecule and atom pair properties as a basis to obtain vectorial molecular descriptors, which characterize the substructure features of a molecule.12 The atom pair properties are added up for a certain topological distance which is the number of bonds on the shortest path between two atoms. The calculated equation for 2D property-weighted autocorrelation descriptors is shown as eq 1
| 1 |
A(d) is the topological autocorrelation coefficient referring to atom pairs i, j, which are separated by d bonds. pi, pj is an atomic property such as partial atomic charge on atom i or j, respectively. A single value is obtained as one coefficient of the 2D autocorrelation vector by summation over all values of a certain topological distance.
The 3D property-weighted autocorrelation descriptors use the 3D structure of a molecule and atom pair properties as a basis for deriving vectorial molecular descriptors.12 The atom pair properties are added up for certain 3D distance intervals. The calculated equation for 3D property-weighted autocorrelation descriptors is shown as eq 2
| 2 |
Ln is the number of distances occurring in a certain distance interval. pi and pj are the atom properties of the atoms i and j, respectively. A single value of a coefficient results for the 3D autocorrelation vector for each 3D distance interval.
The Pearson correlation coefficient (CC) and stepwise linear regression were used for filtering the CORINA Symphony descriptors in this work. First, we calculated the Pearson CCs (r) of all pairs of descriptors and their correlation with bioactivity. The molecular descriptors which were not obviously correlated with activity (r < 0.1) were removed. If two descriptors are highly relevant with a CC (r > 0.9), the descriptor which had the lower CC with the activity would be deleted. Next, the remaining descriptors were selected again by stepwise linear regression analysis.
We obtained 51 CORINA Symphony descriptors with this approach. The 51 selected descriptors and the explanations are shown in Table S1. The selected descriptors were normalized to [0.1, 0.9] via eq 3 before they were used as input for models.
| 3 |
where xi is the original value, xi* is the normalized value, xmin is the minimum value, and xmax is the maximum value of the descriptor variables.
Machine Learning Methods
Machine learning methods have been widely applied to solve complex classification and prediction problems of compound activity in drug discovery. In this work, k-NN,14 DT,15 RF,16 SVM,17 and DNN18 were utilized to classify the HIV-1 PIs.
k-NN is a widely used classification method. The main idea for this method is that if a sample is in the most contiguous sample in the feature space, most of them belong to a certain category and also this sample belongs to this category. The algorithm averages the response value over the closest neighbors to estimate the response value.14 The parameters were selected by a cross-validation method. The number of the closest neighbors ranged from 3 to 10.
DT learning is a method for approximating a target function that will produce discrete values using inductive inference.19 For a DT, each nonleaf node contributes to a test to be conducted on a single attribute value, each branch represents the attribute in a certain range of output, and each leaf node stores a category. Using a DT for making a decision is the process of starting from the root node, then test for the classification of the corresponding feature attribute, and its value in accordance with the choice of the output branch, until one reaches a leaf node. The category of each leaf node is stored as a decision result. The Classification and Regression Tree (CART) algorithm was adopted to implement this operation.15 CART provides binary trees that output the largest information gain at each node. The parameters were optimized by cross-validation. The range of the minimum number of samples was from 1 to 5, and the range of the maximum depth was from 0 to 12.
A RF consists of DTs which have no relationship with each other. A RF is an ensemble of unpruned classification trees created by using bootstrap samples of the training data and random feature selection in the tree induction.16 The essence of a RF combines multiple DTs depending on an independent drawing of samples to improve the result of the DT. The parameters were obtained by cross-validation. The range of the number of trees was from 10 to 150, and the range of the maximum depth was from 0 to 20.
A SVM is a supervised machine learning algorithm for binary class label prediction.17 The main idea originated from the Vapnik Chervonenkis dimension and the Vapnik’s structural risk minimization principle. A SVM builds a hyperplane that can divide the data in a high-dimensional space. The radial basis function was used as the kernel function to calculate the scalar product between two data points in a higher dimensional space. The kernel function parameters γ (eq 4) and the optimum loss parameter C (eq 5) were chosen through the cross-validation method. The range for log 2γ and log 2c was −10 to 10.
| 4 |
| 5 |
| 6 |
A DNN is a new field in the study of machine learning. It aims to establish and simulate the human brain to analyze and learn the data. DNN is an artificial neural network with more than one intermediate layer and more neurons in each layer.18−20 The DNN contains an input layer, an output layer, and several hidden layers. A neuron is a computing and storage unit in layers. The output of a neuron is calculated by eq 7
| 7 |
O represents the output. f(x) is the activation function for a layer. xi is the input value or the output value of a hidden layer, and wi is the weight of each input or connection between neurons. b is a default bias term. The parameters were chosen by cross-validation. We set the number of hidden layers as 1, 2, and 3. The number of neurons in each hidden layer varied from 2 to 210.
We chose the sigmoid function as the activation function for DNN. The function is shown in eq 8
| 8 |
In the process of training, the loss function was minimized by optimizing the weights and bias of neurons using the backward propagation algorithm. In addition, in this process, the training set was divided into several batches to optimize the weights and bias randomly. If all batches were used, the training process completed one epoch. The number of batches and epochs are related to the convergence and stability of the model. The number of epoch should be set as large as possible. The network was trained for 2000 epochs with a batch of 100. The optimizer function uses the gradient decent rule for the training process. The optimizer “Adadelta”21 was used for the models. The learning rate was set as 1.0. The learning rate decay over each update was set as 0.
Consensus Model
Consensus scoring or data fusion can enhance the performance of a single classification model by improving prediction reliability.22 We created several new consensus models that combine the k-NN, DT, RF, SVM, and DNN models using the “consensus prediction”. For each kind of input descriptors, five individual models were obtained by using the k-NN, DT, RF, SVM, and DNN models. On the basis of the results of five models, three consensus models (C3, C4, and C5) were computed for the training and test set. If more than three of the five single classification model predictions are correct, the consensus model result is “TRUE”, otherwise it is “FALSE”. We named this consensus model as C3. Similarly, we performed consensus model C4 (more than four of the five single classification model predictions are correct) and C5 (all five single classification model predictions are correct).” In this way, nine consensus models were built with three kinds of different descriptors (CORINA Symphony descriptors, MACCS fingerprints descriptors, and PubChem fingerprints descriptors).
Evaluation of Model Performance
The models can be evaluated by the statistical parameters sensitivity (SE), specificity (SP), and Matthews CC (MCC) as shown in eqs 9–12.
| 9 |
| 10 |
| 11 |
| 12 |
True positive (TP) represents the number of PI-positive which were calculated correctly. True negative (TN) represents the number of PI-negative which were calculated correctly. False positive (FP) means the number of PI-positive which were computed incorrectly. False negative (FN) means the number of PI-negative which were computed incorrectly. SE and SP evaluate the prediction accuracies for PI-positive and PI-negative, respectively. The range of MCC is from −1 to 1. The higher the MCC is, the better classification is provided by the model. To evaluate the predictive ability of the models, the external validation set was also predicted by the models. The external validation set included 35 750 decoys derived from the DUD database23 and 239 active inhibitors from the recent literature.24−29
The F-score is used to compute the importance of individual descriptors in this work. This index measures the discrimination of two sets of real numbers as shown in eq 13.
| 13 |
 ,
,  , and
, and  represent the average
of the ith descriptor of the whole, PI-positive,
and PI-negative data sets,
respectively. xk,i(+) is the ith descriptor of the kth PI-positive,
and xk,i is the ith descriptor of the kth PI-negative. n+ and n– are
the number of PI-positive and PI-negative, respectively.
represent the average
of the ith descriptor of the whole, PI-positive,
and PI-negative data sets,
respectively. xk,i(+) is the ith descriptor of the kth PI-positive,
and xk,i is the ith descriptor of the kth PI-negative. n+ and n– are
the number of PI-positive and PI-negative, respectively.
Results and Discussion
Analysis of the Chemical Space and Applicability Domain
We collected 4855 HIV-1 PIs in the data set, which contained different types of compounds, such as the compounds containing a benzothiophene ring,30 the isosorbide-derived P2 ligands,31 sulfoximine,32 and so forth.” The data set was separated into a training set and a test set randomly. The training set contained 1914 PI-negative and 1322 PI-positive structures. The test set contained 936 PI-negative and 683 PI-positive molecules.
The molecular weight (MW) and aqueous solubility (log S) are the global molecular descriptors in the 51 selected CORINA Symphony descriptors. The scattered distributions of MW and aqueous solubility can characterize the chemical space for the training set and the test set. Principal component analysis (PCA) was performed to identify the chemical space of the training set and the test set. The first two principal components obtained by PCA of the 51 selected descriptors were used to describe the molecules. For the PCA analysis, the cumulative contributions of two resulting principal eigenvectors (PC1 and PC2) reached 39.95 and 14.09%, respectively. The content in the first two principal components reached 54.04%, which suggests that PC1 and PC2 can be used to represent the higher dimensional data set. The chemical spaces for the training set and the test set nearly completely covered each other as shown in Figure 1. On the basis of the analysis, the prediction result of the test set is reliable and dependable.
Figure 1.

Scattered distribution for the training set and test set. (a) Chemical space represented by MW and aqueous solubility (log S). (b) Chemical space characterized by the first two principal components obtained by PCA.
The chemical space for predictions by a model is given by the training set. The compounds in test set must be similar to those in the training set in some of their properties.33 The applicability domain is defined as the range of the values of the selected global descriptor MW and aqueous solubility (log S), which represent the chemical space of the training set in a simply manner. If a molecule is out of the chemical space, the prediction can be unreliable.
Performance of the Classification Models
The molecules were characterized by MACCS fingerprints, PubChem fingerprints, and CORINA Symphony descriptors. The models for the classification of the molecules based on their bioactivity were built by machine learning methods including k-NN, DT, RF, SVM, and DNN. In addition, we created new consensus models that combine all of the machine learning methods using the “consensus prediction”. The important parameters used to build the models are listed in Table 2. The results of the models are listed in Table 3. The results of the consensus models are listed in Table 4.
Table 2. Important Parameters Used To Establish the Models.
| models | descriptors | methodsa | parameters |
|---|---|---|---|
| model 1A | MACCS fingerprint | k-NN | the number of the closet neighbors k = 3. |
| model 1B | PubChem fingerprint | k-NN | the number of the closet neighbors k = 3 |
| model 1C | CORINA Symphony | k-NN | the number of the closet neighbors k = 10 |
| model 2A | MACCS fingerprint | DT | the maximum depth of the tree d = 0; the minimum number of samples s = 2; the number of features to consider when looking for the best split n = 13 |
| model 2B | PubChem fingerprint | DT | the maximum depth of the tree d = 0; the minimum number of samples s = 4; the number of features to consider when looking for the best split n = 30 |
| model 2C | CORINA Symphony | DT | the maximum depth of the tree d = 8; the minimum number of samples s = 2; the number of features to consider when looking for the best split n = 7 |
| model 3A | MACCS fingerprint | RF | the number of trees n = 100; the max depth of the tree d = 10; the number of features to consider when looking for the best split n = 13 |
| model 3B | PubChem fingerprint | RF | the number of trees n = 70; the max depth of the tree d = 10; the number of features to consider when looking for the best split n = 30 |
| model 3C | CORINA Symphony | RF | the number of trees n = 110; the max depth of the tree d = 6; the number of features to consider when looking for the best split n = 7 |
| model 4A | MACCS fingerprint | SVM | the optimum loss parameter C = 4.0; the kernel function parameter γ = 0.0625 |
| model 4B | PubChem fingerprint | SVM | the optimum loss parameter C = 4.0; the kernel function parameter γ = 0.0015625 |
| model 4C | CORINA Symphony | SVM | the optimum loss parameter C = 4.0; the kernel function parameter γ = 2.0 |
| model 5A | MACCS fingerprint | DNN | the number of hidden layer = 1; the number of neuron = 16 |
| model 5B | PubChem fingerprint | DNN | the number of hidden layer = 2; the number of neuron in first hidden layer = 16, the number of neuron in second hidden layer = 16 |
| model 5C | CORINA Symphony | DNN | the number of hidden layer = 1; the number of neuron = 64 |
NB: naive bayes; k-NN: k-nearest neighbors; DT: decision tree; RF: random forest; SVM: support vector machine; DNN: deep neural net.
Table 3. Summary of k-NN, DT, RF, SVM, and DNN Models Based on Fingerprints and CORINA Symphony Descriptors.
| test
set |
||||||||
|---|---|---|---|---|---|---|---|---|
| model | methods | descriptors | number of compounds training/test set | training set accuracy (%) | 5-fold cross-validation on training set (%) | SE | SP | accuracy/MCC |
| model 1A | k-NN | MACCS fingerprint | 3236/1619 | 89.52 | 79.02 | 0.76 | 0.83 | 80.48%/0.60 |
| model 1B | k-NN | PubChem fingerprint | 3236/1619 | 89.89 | 80.07 | 0.77 | 0.83 | 80.91%/0.61 |
| model 1C | k-NN | CORINA Symphony | 3236/1619 | 83.02 | 78.19 | 0.78 | 0.78 | 78.01%/0.54 |
| model 2A | DT | MACCS fingerprint | 3236/1619 | 86.00 | 76.79 | 0.76 | 0.77 | 76.59%/0.51 |
| model 2B | DT | PubChem fingerprint | 3236/1619 | 89.52 | 79.57 | 0.77 | 0.79 | 78.01%/0.54 |
| model 2C | DT | CORINA Symphony | 3236/1619 | 80.89 | 71.22 | 0.64 | 0.75 | 70.49%/0.40 |
| model 3A | RF | MACCS fingerprint | 3236/1619 | 88.10 | 80.62 | 0.83 | 0.79 | 80.35%/0.59 |
| model 3B | RF | PubChem fingerprint | 3236/1619 | 88.41 | 80.84 | 0.83 | 0.78 | 79.92%/0.59 |
| model 3C | RF | CORINA Symphony | 3236/1619 | 83.09 | 75.68 | 0.74 | 0.74 | 74.04%/0.46 |
| model 4A | SVM | MACCS fingerprint | 3236/1619 | 92.31 | 81.80 | 0.82 | 0.84 | 83.07%/0.65 |
| model 4B | SVM | PubChem fingerprint | 3236/1619 | 90.91 | 83.37 | 0.83 | 0.82 | 82.58%/0.64 |
| model 4C | SVM | CORINA Symphony | 3236/1619 | 85.94 | 78.59 | 0.80 | 0.80 | 79.56%/0.58 |
| model 5A | DNN | MACCS fingerprint | 3236/1619 | 90.98 | 79.71 | 0.80 | 0.84 | 82.27%/0.63 |
| model 5B | DNN | PubChem fingerprint | 3236/1619 | 90.79 | 82.69 | 0.81 | 0.82 | 81.53%/0.62 |
| model 5C | DNN | CORINA Symphony | 3236/1619 | 82.65 | 76.27 | 0.76 | 0.79 | 77.82%/0.54 |
Table 4. Summary on the Performance of Consensus Modelsa.
| model | methods | descriptors | number of compounds training/test set | training set accuracy (%) | test set accuracy (%) |
|---|---|---|---|---|---|
| model C3a | C3 | MACCS fingerprint | 3236/1619 | 91.96 | 83.15 |
| model C3b | C3 | PubChem fingerprint | 3236/1619 | 91.44 | 82.53 |
| model C3c | C3 | CORINA Symphony | 3236/1619 | 85.97 | 79.07 |
| model C4a | C4 | MACCS fingerprint | 3236/1619 | 86.65 | 74.75 |
| model C4b | C4 | PubChem fingerprint | 3236/1619 | 87.64 | 77.41 |
| model C4c | C4 | CORINA Symphony | 3236/1619 | 78.78 | 69.25 |
| model C5a | C5 | MACCS fingerprint | 3236/1619 | 76.21 | 62.90 |
| model C5b | C5 | PubChem fingerprint | 3236/1619 | 77.94 | 63.77 |
| model C5c | C5 | CORINA Symphony | 3236/1619 | 63.51 | 52.17 |
C3: more than three of the five individual classification model predictions are correct. C4: more than four of the five individual classification model predictions are correct. C5: all of the five individual classification model predictions are correct.
Classification Models Built Using k-NN
Three classification models were built using k-NN, model 1A by MACCS fingerprints, model 1B by PubChem fingerprints, and model 1C using CORINA Symphony descriptors. Model 1B which was computed using PubChem fingerprint descriptors performed best with an accuracy of 80.91% on the test set. The MCC value of model 1B was also more than those of the other models. This suggested that the prediction performance of model 1B was better than other models. PubChem fingerprints are more suitable for the classification of the inhibitors by the k-NN method.
Classification Models Built Using a DT
Three classification models were computed using a DT, model 2A by MACCS fingerprints, model 2B by PubChem fingerprints, and model 2C using CORINA Symphony descriptors. Model 2B which was built based on PubChem fingerprint descriptors performed best with the accuracies of 78.01% on the test set, 89.52% on the training set, and 79.57% by a 5-fold cross-validation. For the MCC value, model 2B was also more than those of the other DT models. It revealed that PubChem fingerprints are more suitable for the classification of the inhibitors using the DT method.
Classification Models Built Using a RF
Three classification models were developed using a RF method, model 3A based on MACCS fingerprints, model 3B by PubChem fingerprints, and model 3C using CORINA Symphony descriptors. Model 3A which was built based on MACCS fingerprint descriptors showed the best accuracy of 80.35% of on the test set. The accuracy of the training set and 5-fold cross-validation for model 3A and model 3B were higher than those of model 3C. The MCC value of model 3A was equal to that of model 3B, which was also higher than those of models 3C. MACCS and PubChem fingerprints showed good classification performance for the inhibitors using the RF method.
Classification Models Built Using a SVM
Three classification models were constructed using a SVM, model 4A by MACCS fingerprints, model 4B by PubChem fingerprints, and model 4C using CORINA Symphony descriptors. For the results of the models, model 4A which was built based on MACCS fingerprints descriptors showed a better performance with accuracies of 92.31 and 83.07% on the training set and the test set, respectively. Model 4B based on PubChem fingerprint descriptors obtained a higher accuracy of 83.37% by 5-fold cross-validation than those of the others. The MCC values of model 4A and model 4B were higher than that of model 4C. Model 4A and model 4B showed a better classification ability of the inhibitors.
Classification Models Built Using a DNN
Three classification models were developed using a DNN, model 5A by MACCS fingerprints, model 5B by PubChem fingerprints, and model 5C using CORINA Symphony descriptors. In the process of parameter selection, the number of neurons per hidden layer can be different. We set the number of neurons per hidden layer at the same number from 2 to 210; the prediction results of the models are shown in Figure 2. Figure 2 shows the accuracies for the training set and the test set obtained by the models on the basis of MACCS fingerprints, PubChem fingerprints, and CORINA Symphony descriptors using the DNN method. From Figure 2, we can see that the accuracy increases with the number of neurons when the number of neurons per layer was less than 400. Then, the accuracy changed little with the increase of the number of neurons. From Figure 2b, one can see that when the number of neurons was more than 200, there is an obvious overfitting for the models. The PubChem fingerprints include 881 substructure patterns. More features mean more complicated calculations for the model compared with MACCS fingerprints and CORINA Symphony descriptors. Then, there are less data for each feature available to complete the training process. To avoid overfitting, a “drop-out” procedure, which drops some neurons in each batch, can be imported to the training process.34 However, the overfitting still existed when the number of neurons was more than 200; the reason may be that the number of data is not enough for the PubChem fingerprints by the DNN method.
Figure 2.

Accuracy of the training set and test set obtained by the models based on (a) MACCS fingerprints, (b) PubChem fingerprints, and (c) CORINA Symphony descriptors using the DNN method.
Model 5A built based on MACCS fingerprint descriptors showed a better accuracy of 82.27% on the test set than those of the other models. The accuracy of the training set and 5-fold cross-validation for model 5B were higher than those of models 5A and 5C. The MCC values of model 5A and model 5B were higher than those of model 5C. For the DNN models, MACCS and PubChem fingerprints are suitable to classify the inhibitors.
For all of the models established by k-NN, DT, RF, SVM, and DNN, the prediction accuracies on the test set are higher than 70% based on the data set. Model 4A which was built by SVM based on MACCS fingerprints was the best model in view of the accuracy of 83.07% and the MCC of 0.65 on the test set. From the point of average prediction accuracy and MCC on the test set of the models, SVM performed better than other methods. The results of DNN models were close to those of SVM models.
Performance of the Consensus Models
In this work, three kinds of different descriptors (CORINA Symphony descriptors, MACCS fingerprints descriptors, and PubChem fingerprints descriptors) were used as input of the models. For each kind of input descriptors such as MACCS fingerprints descriptors, five individual models (model 1A, model 2A, model 3A, model 4A, and model 5A) were obtained by using the k-NN, DT, RF, SVM, and DNN methods, respectively. On the basis of the results of five models (model 1, 2, 3, 4,and 5A), three consensus models (model C3a, model C4a, and model C5a) were computed for the training and test set. For each compound, if the prediction results for more than three of the five individual models are correct, the consensus models result is “TRUE”, otherwise it is “FALSE”. We named this model as “model C3a”. Similarly, we performed model C4a (more than four of the five individual classification model predictions are correct) and model C5a (all of the five individual classification model predictions are correct). The results of consensus models are presented in Table 4. For the average accuracy, model C3a–c constructed by the C3 consensus prediction method (more than three of the five single classification model predictions are correct) obtained higher accuracy. Model C3a developed with MACCS fingerprint descriptors showed the highest accuracy on both training set (91.96%) and test set (83.15%). As for the C4 consensus prediction method, model C4b built with PubChem fingerprint descriptors showed the highest accuracy on both training set (87.64%) and test set (77.41%). As for the C5 consensus prediction method, the highest performance was obtained for the model C5b, which was developed using PubChem fingerprint descriptors. More than half of all of the compounds were predicted correctly by the consensus model C5a, C5b, and C5c, which indicated that the models built in this work are stable. As for the descriptors, the fingerprint descriptors performed better than CORINA Symphony descriptors for the prediction of the compounds in both training and test set with all consensus prediction methods.
Analysis of Molecular Descriptors
To examine the role of the descriptors, we calculated F-score for fingerprints and the CORINA Symphony descriptors. Table 5 shows the top 10 fingerprints sorted by F-score and the representative substructures. The top 10 fingerprints sorted by F-score include two MACCS fingerprints and 8 PubChem fingerprints. We also calculated the frequency of substructures that appeared in the PI-positive and PI-negative. The fingerprint MACCSFP 133 obtains the highest F-score value, which represents the three atoms including one nitrogen atom linked by a ring bond and a chain bond (shown in Table 5). The frequencies of MACCSFP 133 that appears in the PI-positive and the PI-negative were 50.00 and 24.19%, respectively, and the difference was 28.81%. In Table 6, the differences of eight substructures are more than 20%. The 10 fragments give a positive contribution to bioactivity. From Table 6, one can see that 9 of the 10 fingerprints substructures include a nitrogen atom and one includes an oxygen atom. Five of the 10 fingerprint substructures include an aromatic ring.
Table 5. Top 10 Fingerprints Sorted by F-Score and the Representative Substructures.


Frequency of the substructure appeared in inhibitors.
Frequency of the substructure appeared in weakly inhibitors.
The difference value of (a) and (b).
Table 6. CC to Activity and F-Score of 52 Selected CORINA Symphony Descriptors.
| descriptor | CC | F-score | description | class |
|---|---|---|---|---|
| 3DACorr:Ident:Cor3D:ori1_3 | 0.185 | 0.076 | molecular size | A |
| 3DACorr:PiEN:Cor3D:ori1_12 | 0.158 | 0.076 | π atom electronegativities | B |
| 2DACorr:SigChg_10 | 0.119 | 0.064 | σ atom charges | C |
| 2DACorr:PiChg_5 | 0.121 | 0.061 | π atom charges | B |
| 3DACorr:LpEN:Cor3D:ori1_10 | 0.124 | 0.057 | lone pair electronegativities | D |
| 3DACorr:TotChg:Cor3D:ori1_9 | 0.112 | 0.056 | total atom charges | E |
| 2DACorr:LpEN_10 | 0.191 | 0.055 | lone pair electronegativities | D |
| 3DACorr:Ident:Cor3D:ori1_2 | 0.191 | 0.052 | molecular size | A |
| HAccN | 0.132 | 0.052 | number of hydrogen bonding acceptors | F |
| Aspheric:Cor3D:ori1 | -0.172 | 0.051 | molecular shape | A |
| 3DACorr:LpEN:Cor3D:ori1_12 | 0.124 | 0.050 | lone pair electronegativities | D |
| 2DACorr:PiEN_2 | 0.213 | 0.046 | π atom electronegativities | B |
| 2DACorr:LpEN_9 | 0.114 | 0.044 | lone pair electronegativities | D |
| 3DACorr:LpEN:Cor3D:ori1_7 | 0.168 | 0.043 | lone pair electronegativities | D |
| 3DACorr:LpEN:Cor3D:ori1_9 | 0.126 | 0.043 | lone pair electronegativities | D |
| 2DACorr:LpEN_11 | 0.109 | 0.041 | lone pair electronegativities | D |
| weight | 0.153 | 0.041 | molecular weight | A |
| 3DACorr:PiEN:Cor3D:ori1_7 | 0.234 | 0.041 | π atom electronegativities | B |
| 2DACorr:SigEN_3 | 0.208 | 0.040 | σ atom electronegativities | C |
| 3DACorr:PiChg:Cor3D:ori1_8 | 0.121 | 0.037 | π atom charges | B |
| 3DACorr:PiEN:Cor3D:ori1_8 | 0.227 | 0.033 | π atom electronegativities | B |
| log S | -0.188 | 0.032 | solubility | A |
| 3DACorr:SigEN:Cor3D:ori1_11 | 0.151 | 0.031 | σ atom electronegativities | C |
| 3DACorr:Polariz:Cor3D:ori1_7 | 0.233 | 0.028 | effective atom polarizabilities | G |
| 2DACorr:TotChg_7 | 0.118 | 0.027 | total atom charges | E |
| 3DACorr:PiEN:Cor3D:ori1_4 | 0.115 | 0.026 | π atom electronegativities | B |
| 3DACorr:SigChg:Cor3D:ori1_9 | 0.108 | 0.025 | σ atom charges | C |
| 3DACorr:LpEN:Cor3D:ori1_8 | 0.151 | 0.025 | lone pair electronegativities | D |
| 3DACorr:SigEN:Cor3D:ori1_7 | 0.220 | 0.024 | σ atom electronegativities | C |
| 2DACorr:PiEN_10 | 0.257 | 0.023 | π atom electronegativities | B |
| 3DACorr:SigEN:Cor3D:ori1_9 | 0.191 | 0.023 | σ atom electronegativities | C |
| 2DACorr:Polariz_11 | 0.217 | 0.022 | effective atom polarizabilities | G |
| 3DACorr:Ident:Cor3D:ori1_5 | 0.253 | 0.020 | molecular size | A |
| 3DACorr:PiEN:Cor3D:ori1_5 | 0.192 | 0.019 | π atom electronegativities | B |
| 3DACorr:Polariz:Cor3D:ori1_1 | 0.144 | 0.019 | effective atom polarizabilities | G |
| Eccentric:Cor3D:ori1 | -0.152 | 0.017 | molecular shape | A |
| 2DACorr:Ident_7 | 0.196 | 0.016 | molecular size | A |
| HDonO | 0.145 | 0.016 | number of hydrogen bonding donors | F |
| 2DACorr:PiEN_8 | 0.142 | 0.016 | π atom electronegativities | B |
| InertiaX:Cor3D:ori1 | 0.138 | 0.016 | molecular size | A |
| 2DACorr:Polariz_1 | 0.162 | 0.015 | effective atom polarizabilities | G |
| 3DACorr:LpEN:Cor3D:ori1_6 | 0.133 | 0.015 | lone pair electronegativities | D |
| 3DACorr:PiEN:Cor3D:ori1_11 | 0.184 | 0.015 | π atom electronegativities | B |
| 3DACorr:PiEN:Cor3D:ori1_1 | 0.213 | 0.014 | π atom electronegativities | B |
| 2DACorr:PiEN_4 | 0.131 | 0.014 | π atom electronegativities | B |
| 3DACorr:SigChg:Cor3D:ori1_7 | 0.106 | 0.013 | σ atom charges | C |
| 2DACorr:PiChg_6 | -0.101 | 0.013 | π atom charges | B |
| 3DACorr:PiEN:Cor3D:ori1_10 | 0.215 | 0.012 | π atom electronegativities | B |
| 3DACorr:TotChg:Cor3D:ori1_5 | 0.111 | 0.012 | total atom charge | E |
| 3DACorr:PiEN:Cor3D:ori1_3 | 0.110 | 0.012 | π atom electronegativities | B |
| 3DACorr:Polariz:Cor3D:ori1_10 | 0.198 | 0.011 | effective atom polarizabilities | G |
Table 6 shows the CCs to activity and the F-Score of 52 selected CORINA Symphony descriptors. We divided the descriptors into seven classes. Class A includes nine descriptors which described molecular size, shape, and solubility. The descriptors of class B are related to π atom charges and electronegativities. The descriptors of class C are related to σ atom charges and electronegativities. Class D included nine descriptors which are related to lone pair electronegativities. Class E includes two descriptors which describe the total charge (sum of σ and π charges). The descriptors of class F are related to hydrogen bonding. The descriptors of class G describe effective atom polarizabilities. The descriptors of the seven classes represent the molecular size and shape, charges, and electronegativities.
The interactions between the inhibitors and HIV-1 protease are revealed in Figure 3. Figure 3a depicts the interactions between indinavir and protease (PDB code: 2BPX).35 The oxygen atom of the hydroxyl group makes up a hydrogen bond with Asp 25 at two sites of the amino acid chain. The other oxygen atom of hydroxy forms two hydrogen bonds with Asp 29 and Gly 27 at chain B. The aromatic ring forms π–π stacking interactions with Val 82 at chain A. Figure 3b depicts the structure and interactions between the ligand 8FP and protease (PDB code: 5UOV).27 The ligand has shown Ki of 0.025 nM with the enzyme.27 The oxygen atom of the hydroxy group forms two hydrogen bonds with Asp 25 at two sites of amino acids chain. The oxygen atom of the acylamino group forms a hydrogen bond with Asp 29 at chain B. The aromatic ring forms π–π stacking interactions with Ala 28 at chain B. As shown in Figure 3, hydrogen bond and π–π stacking interactions are important interactions. The descriptors of class B, class D, and class F confirm that an aromatic system and atoms related to hydrogen bonding are important for the bioactivity of PIs.
Figure 3.

Structure of the ligand and protease dimer. (a) Interactions between indinavir and the protease dimer (PDB code: 2BPX). (b) Interactions between the ligand 8FP and protease dimer (PDB code: 5UOV).
Analysis of Prediction Results
For the 1619 molecules in the test set, 1608 compounds were correctly predicted by at least one of the 15 models. Only 11 molecules (CHEMBL122388, CHEMBL71218, CHEMBL194770, CHEMBL87092, CHEMBL313955, CHEMBL187387, CHEMBL94078, CHEMBL112846, CHEMBL323014, CHEMBL73875, and CHEMBL424415) were wrongly predicted by all of the 15 models. Their molecular structures are shown in Figure 4. The molecular structures of CHEMBL122388, CHEMBL71218, CHEMBL187387, CHEMBL94078, CHEMBL112846, CHEMBL323014, and CHEMBL73875 do not contain these important fragments which are shown in Table 4. Because of the lack of these important fragments, the prediction of the compounds was not good. The bioactivity of CHEMBL194770 is on the edge of the threshold. This may be the reason for the error. CHEMBL122388 and CHEMBL71218 have the same scaffold of pyrone group. CHEMBL87092 and CHEMBL313955 are fluorinated compounds. CHEMBL187387 and CHEMBL94078 have substituted phenylethylamine groups. CHEMBL112846, CHEMBL323014, CHEMBL73875, and CHEMBL424415 are peptides with a somehow larger MW. For these scaffolds of molecules, it is suggested that the prediction ability could be improved by increasing the number of similar molecules in the training set.
Figure 4.

Molecules which were predicted incorrectly by all 15 models in this study.
Predicted Results of External Validation Set
The 35 750 decoys, which are all assumed to be inactive compounds against HIV-1 protease from the DUD database, and 239 inhibitors collected from the literature were collected as an external validation set. The external validation set contained different types of compounds, such as the derivatives bearing oxazolylmethyl or thiazolylmethyl, the compounds binding bicyclic piperazine sulfonamide core, and so forth. The molecular structures of 239 active inhibitors are shown in the Supporting Information. All of the models built in this work were used to predict the external validation set. The predicted results are shown in Table 7. Model 3C which was built by the RF method based on CORINA Symphony descriptors obtained the best accuracy of 98.37% for the external validation set. For the average accuracy, the RF models were higher than the other models. SVM and DNN models were not as good as RF models, but they were better than the DT models. As for the descriptors, CORINA Symphony descriptors performed better than the fingerprint descriptors for the prediction of the compounds in the external validation set with all methods. The SP values are higher than SE values for most models. It indicated that the models have better predictive ability for negative compounds. The prediction ability for positive compounds could be improved by increasing the number of similar active inhibitors in the training set.
Table 7. Predicted Accuracy of the External Validation Set Using the Models Built in This Work.
| models | descriptors | methodsa | accuracy (%) | SE | SP |
|---|---|---|---|---|---|
| model 1A | MACCS fingerprint | k-NN | 63.62 | 0.69 | 0.64 |
| model 1B | PubChem fingerprint | k-NN | 75.70 | 0.63 | 0.76 |
| model 1C | CORINA Symphony | k-NN | 94.05 | 0.58 | 0.94 |
| model 2A | MACCS fingerprint | DT | 77.60 | 0.62 | 0.78 |
| model 2B | PubChem fingerprint | DT | 84.56 | 0.45 | 0.85 |
| model 2C | CORINA Symphony | DT | 84.30 | 0.59 | 0.84 |
| model 3A | MACCS fingerprint | RF | 95.83 | 0.71 | 0.96 |
| model 3B | PubChem fingerprint | RF | 94.60 | 0.59 | 0.95 |
| model 3C | CORINA Symphony | RF | 98.37 | 0.43 | 0.98 |
| model 4A | MACCS fingerprint | SVM | 93.32 | 0.59 | 0.94 |
| model 4B | PubChem fingerprint | SVM | 90.60 | 0.44 | 0.91 |
| model 4C | CORINA Symphony | SVM | 98.14 | 0.46 | 0.98 |
| model 5A | MACCS fingerprint | DNN | 80.79 | 0.71 | 0.81 |
| model 5B | PubChem fingerprint | DNN | 80.67 | 0.52 | 0.81 |
| model 5C | CORINA Symphony | DNN | 97.97 | 0.57 | 0.98 |
k-NN: k-nearest neighbors; DT: decision tree; RF: random forest; SVM: support vector machine; DNN: deep neural net.
Conclusions
Four thousand eight hundred and fifty five molecules and their bioactivities (IC50/Ki) for HIV-1 protease were collected from ChEMBL as the data set for this work. The data set was separated into a training set including 3236 molecules and a test set including 1619 molecules. An external validation set including 35 989 compounds was also used to validate the models. In the process of building models, k-NN, DT, RF, SVM, and DNN were used to identify HIV-1 protease active inhibitors. In addition, we created consensus models that combine the k-NN, DT, RF, SVM, and DNN models using the “consensus prediction”. CORINA Symphony and fingerprint descriptors including MACCS fingerprints and PubChem fingerprints were used to characterize the molecular structure features. For the prediction results of the test set, the SVM models performed better than the models of the other methods. The prediction results of the test set obtained by the DNN models were nearly as good as the prediction results obtained by the SVM models. For the consensus models, model C3a developed with MACCS fingerprint descriptors showed the highest accuracy on both training set (91.96%) and test set (83.15%). For the prediction results of the external validation set, the RF models performed better than the others models. The prediction results of the external validation set obtained by the SVM and DNN models were nearly as good as the prediction results obtained by the RF models. The fingerprints were suitable for establishing classification models in view of the prediction results on the test set. Considering the prediction results on the external validation set, CORINA Symphony descriptors were the best for classification models of PIs. From the analysis of the descriptors, we found that an aromatic system and atoms involved in hydrogen bonding contribute to the bioactivity of PIs. Taking all of these observations together, we would recommend using the SVM method based on MACCS fingerprints as a compromise for the prediction of PI activity of a compound.
Acknowledgments
This work was supported by the National Natural Science Foundation of China (21675010), and “Chemical Grid Project” of Beijing University of Chemical Technology. We thank the Molecular Networks GmbH, Nuremberg, Germany for providing the programs CORINA Symphony and SONNIA for our scientific work.
Supporting Information Available
The Supporting Information is available free of charge on the ACS Publications website at DOI: 10.1021/acsomega.8b01843.
The authors declare no competing financial interest.
Supplementary Material
References
- Global Report. UNAIDS Report on the Global AIDS Epidemic 2012; Joint United Nations Programme on HIV/AIDS (UNAIDS), 2012.
- Wiegers K.; Rutter G.; Kottler H.; Tessmer U.; Hohenberg H.; Krausslich H. G. Sequential steps in human immunodeficiency virus particle maturation revealed by alterations of individual Gag polyprotein cleavage sites. J. Virol. 1998, 72, 2846–2854. [DOI] [PMC free article] [PubMed] [Google Scholar]
- Prabu-Jeyabalan M.; Nalivaika E.; Schiffer C. A. Substrate Shape Determines Specificity of Recognition for HIV-1 Protease. Structure 2002, 10, 369–381. 10.1016/s0969-2126(02)00720-7. [DOI] [PubMed] [Google Scholar]
- Shen H.-B.; Chou K.-C. HIVcleave: a web-server for predicting human immunodeficiency virus protease cleavage sites in proteins. Anal. Biochem. 2008, 375, 388–390. 10.1016/j.ab.2008.01.012. [DOI] [PubMed] [Google Scholar]
- Gray C. M.; Lawrence J.; Schapiro J. M.; Altman J. D.; Winters M. A.; Crompton M.; Loi M.; Kundu S. K.; Davis M. M.; Merigan T. C. Frequency of class I HLA-restricted anti-HIV CD8+ T cells in individuals receiving highly active antiretroviral therapy (HAART). J. Immunol. 1999, 162, 1780–1788. [PubMed] [Google Scholar]
- Wei Y.; Li J.; Chen Z.; Wang F.; Huang W.; Hong Z.; Lin J. Multistage virtual screening and identification of novel HIV-1 protease inhibitors by integrating SVM, shape, pharmacophore and docking methods. Eur. J. Med. Chem. 2015, 101, 409–418. 10.1016/j.ejmech.2015.06.054. [DOI] [PubMed] [Google Scholar]
- Li N.; Ainsworth R. I.; Ding B.; Hou T.; Wang W. Using Hierarchical Virtual Screening To Combat Drug Resistance of the HIV-1 Protease. J. Chem. Inf. Model. 2015, 55, 1400–1412. 10.1021/acs.jcim.5b00056. [DOI] [PubMed] [Google Scholar]
- Potemkin V.; Grishina M. Principles for 3D/4D QSAR classification of drugs. Drug Discovery Today 2008, 13, 952–959. 10.1016/j.drudis.2008.07.006. [DOI] [PubMed] [Google Scholar]
- Deeb O.; Goodarzi M. Exploring QSARs for inhibitory activity of non-peptide HIV-1 protease inhibitors by GA-PLS and GA-SVM. Chem. Biol. Drug Des. 2010, 75, 506–514. 10.1111/j.1747-0285.2010.00953.x. [DOI] [PubMed] [Google Scholar]
- Ali A.; Reddy G. S. K. K.; Nalam M. N. L.; Anjum S. G.; Cao H.; Schiffer C. A.; Rana T. M. Structure-Based Design, Synthesis, and Structure–Activity Relationship Studies of HIV-1 Protease Inhibitors Incorporating Phenyloxazolidinones. J. Med. Chem. 2010, 53, 7699–7708. 10.1021/jm1008743. [DOI] [PMC free article] [PubMed] [Google Scholar]
- https://www.ebi.ac.uk/chembl/ (accessed Oct. 2018).
- CORINA Symphony; Molecular Networks GmbH. https://www.molecular-networks.com (accessed Oct. 2018).
- Yap C. W. PaDEL-descriptor: an open source software to calculate molecular descriptors and fingerprints. J. Comput. Chem. 2011, 32, 1466–1474. 10.1002/jcc.21707. [DOI] [PubMed] [Google Scholar]
- Cortes-Ciriano I.; Bender A.; Malliavin T. E. Comparing the Influence of Simulated Experimental Errors on 12 Machine Learning Algorithms in Bioactivity Modeling Using 12 Diverse Data Sets. J. Chem. Inf. Model. 2015, 55, 1413–1425. 10.1021/acs.jcim.5b00101. [DOI] [PubMed] [Google Scholar]
- Boerstler H.; Figueiredo J. M. Prediction of use of psychiatric services: Application of the CART algorithm. J. Ment. Health Adm. 1991, 18, 27–34. 10.1007/bf02521131. [DOI] [PubMed] [Google Scholar]
- Breiman L. Random forests. Mach. Learn. 2001, 45, 5–32. 10.1023/a:1010933404324. [DOI] [Google Scholar]
- Heikamp K.; Bajorath J. Support vector machines for drug discovery. Expet Opin. Drug Discov. 2014, 9, 93–104. 10.1517/17460441.2014.866943. [DOI] [PubMed] [Google Scholar]
- Hinton G.; Deng L.; Yu D.; Dahl G.; Mohamed A.-r.; Jaitly N.; Senior A.; Vanhoucke V.; Nguyen P.; Sainath T.; Kingsbury B. Deep Neural Networks for Acoustic Modeling in Speech Recognition: The Shared Views of Four Research Groups. IEEE Signal Process. Mag. 2012, 29, 82–97. 10.1109/msp.2012.2205597. [DOI] [Google Scholar]
- Kawamura Y.; Takasaki S.; Mizokami M. Using decision tree learning to predict the responsiveness of hepatitis C patients to drug treatment. FEBS Open Bio 2012, 2, 98–102. 10.1016/j.fob.2012.04.007. [DOI] [PMC free article] [PubMed] [Google Scholar]
- Ma J.; Sheridan R. P.; Liaw A.; Dahl G. E.; Svetnik V. Deep Neural Nets as a Method for Quantitative Structure-Activity Relationships. J. Chem. Inf. Model. 2015, 55, 263–274. 10.1021/ci500747n. [DOI] [PubMed] [Google Scholar]
- https://arxiv.org/abs/1212.5701 (accessed Oct. 2018).
- Fang J.; Yang R.; Gao L.; Yang S.; Pang X.; Li C.; He Y.; Liu A.-L.; Du G.-H. Consensus models for CDK5 inhibitors in silico and their application to inhibitor discovery. Mol. Divers. 2015, 19, 149–162. 10.1007/s11030-014-9561-3. [DOI] [PubMed] [Google Scholar]
- DUD. http://dud.docking.org/ (accessed Oct. 2018).
- Ghosh A. K.; Rao K. V.; Nyalapatla P. R.; et al. Design of Highly Potent, Dual-Acting and Central-Nervous-System-Penetrating HIV-1 Protease Inhibitors with Excellent Potency against Multidrug-Resistant HIV-1 Variants. ChemMedChem 2018, 13, 803–815. 10.1002/cmdc.201700824. [DOI] [PMC free article] [PubMed] [Google Scholar]
- Amin S. A.; Adhikari N.; Bhargava S.; et al. Structural exploration of hydroxyethylamines as HIV-1 protease inhibitors: new features identified. SAR QSAR Environ. Res. 2018, 29, 385–408. 10.1080/1062936x.2018.1447511. [DOI] [PubMed] [Google Scholar]
- Bungard C. J.; Williams P. D.; Schulz J.; et al. Design and Synthesis of Piperazine Sulfonamide Cores Leading to Highly Potent HIV-1 Protease Inhibitors. ACS Med. Chem. Lett. 2017, 8, 1292–1297. 10.1021/acsmedchemlett.7b00386. [DOI] [PMC free article] [PubMed] [Google Scholar]
- Ghosh A. K.; Brindisi M.; Nyalapatla P. R.; Takayama J.; et al. Design of novel HIV-1 protease inhibitors incorporating isophthalamide-derived P2-P3 ligands: Synthesis, biological evaluation and X-ray structural studies of inhibitor-HIV-1 protease complex. Bioorg. Med. Chem. 2017, 25, 5114–5127. 10.1016/j.bmc.2017.04.005. [DOI] [PMC free article] [PubMed] [Google Scholar]
- Ghosh A. K.; Osswald H. L.; Glauninger K.; et al. Probing Lipophilic Adamantyl Group as the P1-Ligand for HIV-1 Protease Inhibitors: Design, Synthesis, Protein X-ray Structural Studies, and Biological Evaluation. J. Med. Chem. 2016, 59, 6826–6837. 10.1021/acs.jmedchem.6b00639. [DOI] [PMC free article] [PubMed] [Google Scholar]
- Ghosh A. K.; Martyr C. D.; Kassekert L. A.; Nyalapatla P. R.; Steffey M.; Agniswamy J.; Wang Y.-F.; Weber I. T.; Amano M.; Mitsuya H. Design, Synthesis, Biological Evaluation and X-ray Structural Studies of HIV-1 Protease Inhibitors Containing Substituted Fused-Tetrahydropyranyl Tetrahydrofuran as P2-Ligands. Org. Biomol. Chem. 2015, 13, 11607–11621. 10.1039/c5ob01930c. [DOI] [PMC free article] [PubMed] [Google Scholar]
- Chiummiento L.; Funicello M.; Lupattelli P.; Tramutola F.; Marino-Merlo F. Synthesis and biological evaluation of novel small non-peptidic HIV-1 PIs: The benzothiophene ring as an effective moiety. Bioorg. Med. Chem. Lett 2012, 22, 2948–2950. 10.1016/j.bmcl.2012.02.046. [DOI] [PubMed] [Google Scholar]
- Qiu X.; Zhao G.-D.; Tang L.-Q.; Liu Z.-P. Design and synthesis of highly potent HIV-1 protease inhibitors with novel isosorbide-derived P2 ligands. Bioorg. Med. Chem. Lett 2014, 24, 2465–2468. 10.1016/j.bmcl.2014.04.008. [DOI] [PubMed] [Google Scholar]
- RazaLiu A.; Sham Y. Y.; Vince R. Design and synthesis of sulfoximine based inhibitors for HIV-1 protease. Bioorg. Med. Chem. Lett 2008, 18, 5406–5410. 10.1016/j.bmcl.2008.09.044. [DOI] [PubMed] [Google Scholar]
- Cherkasov A.; Muratov E. N.; Fourches D.; Varnek A.; Baskin I. I.; Cronin M.; Dearden J.; Gramatica P.; Martin Y. C.; Todeschini R.; Consonni V.; Kuz’min V. E.; Cramer R.; Benigni R.; Yang C.; Rathman J.; Terfloth L.; Gasteiger J.; Richard A.; Tropsha A. QSAR Modeling: Where Have You Been? Where Are You Going To?. J. Med. Chem. 2014, 57, 4977–5010. 10.1021/jm4004285. [DOI] [PMC free article] [PubMed] [Google Scholar]
- Srivastava N.; Hinton G.; Krizhevsky A.; Sutskever I.; Salakhutdinov R. Dropout: A Simple Way to Prevent Neural Networks from Overfitting. J. Mach. Learn. Res. 2014, 15, 1929–1958. [Google Scholar]
- Munshi S.; Chen Z.; Li Y.; Olsen D. B.; Fraley M. E.; Hungate R. W.; Kuo L. C. Rapid X-ray diffraction analysis of HIV-1 protease-inhibitor complexes: inhibitor exchange in single crystals of the bound enzyme. Acta Crystallogr., Sect. D: Biol. Crystallogr. 1998, 54, 1053–1060. 10.1107/s0907444998003588. [DOI] [PubMed] [Google Scholar]
Associated Data
This section collects any data citations, data availability statements, or supplementary materials included in this article.