Abstract
Background
B7 homolog 1 (B7-H1) overexpression on tumor cells is an important mechanism of immune evasion in gastric cancer (GC). Elucidation of the regulation of B7-H1 expression is urgently required to guide B7-H1-targeted cancer therapy. Interferon gamma (IFN-γ) is thought to be the main driving force behind B7-H1 expression, and epigenetic factors including histone acetylation are recently linked to the process. Here, we investigated the potential role of histone deacetylase (HDAC) in IFN-γ-induced B7-H1 expression in GC. The effect of Vorinostat (SAHA), a small molecular inhibitor of HDAC, on tumor growth and B7-H1 expression in a mouse GC model was also evaluated.
Results
RNA-seq data from The Cancer Genome Atlas revealed that expression of B7-H1, HDAC1–3, 6–8, and 10 and SIRT1, 3, 5, and 6 was higher, and expression of HDAC5 and SIRT4 was lower in GC compared to that in normal gastric tissues; that HDAC3 and HDAC1 expression level significantly correlated with B7-H1 in GC with a respective r value of 0.42 (p < 0.001) and 0.21 (p < 0.001). HDAC inhibitor (Trichostatin A, SAHA, and sodium butyrate) pretreatment suppressed IFN-γ-induced B7-H1 expression on HGC-27 cells. HDAC1 and HDAC3 gene knockdown had the same effect. SAHA pretreatment or HDAC knockdown resulted in impaired IFN-γ signaling, demonstrated by the reduction of JAK2, p-JAK1, p-JAK2, and p-STAT1 expression and inefficient STAT1 nuclear translocation. Furthermore, SAHA pretreatment compromised IFN-γ-induced upregulation of histone H3 lysine 9 acetylation level in B7-H1 gene promoter. In the grafted mouse GC model, SAHA treatment suppressed tumor growth, inhibited B7-H1 expression, and elevated the percentage of tumor-infiltrating CD8+ T cells.
Conclusion
HDAC is indispensable for IFN-γ-induced B7-H1 in GC. The study suggests the possibility of targeting B7-H1 using small molecular HDAC inhibitors for cancer treatment.
Electronic supplementary material
The online version of this article (10.1186/s13148-018-0589-6) contains supplementary material, which is available to authorized users.
Keywords: Gastric cancer, Immune evasion, B7-H1, HDAC, IFN-γ
Background
Gastric cancer (GC) is one of the most prevalent health threats worldwide, ranking fifth for cancer incidence and third for cancer deaths, with the highest incidence and morbidity occurring in Eastern Asian countries including China, Japan, and South Korea [1, 2]. A hallmark of GC is its escape from immunological surveillance and evasion from immunological targeting [3, 4]. One of the important mechanisms of anti-tumor immunity evasion is that tumor cells overexpress B7 homolog 1 (B7-H1), a checkpoint molecule, which can bind to programmed cell death protein 1 (PD-1) on activated T cell surface to induce T cell apoptosis, anergy, and exhaustion [5–8]. A recent meta-analysis further showed that B7-H1 expression on tumor cells was associated with a poor prognosis of GC patients, indicating a role of B7-H1 in promoting GC progression [9]. The B7-H1 blockade has been demonstrated to be a promising treatment strategy for advanced stage cancer in clinical trials. Anti-B7-H1 monoclonal antibodies elicited durable tumor remission and prolonged survival of selected patients with a broad spectrum of cancer, such as urothelial carcinoma and lung cancer [10–12].
The exact force driving tumor B7-H1 overexpression remains to be determined. Cytokines, including interferon gamma (IFN-γ), tumor necrosis factor alpha (TNF-α), and interleukin 2 (IL-2), as well as dysregulated oncogenic signaling involving mitogen-activated protein kinases (MAPK) and epidermal growth factor receptor (EGFR), are all reported to be contributing factors in vitro, among which IFN-γ is the strongest inducer [13–17]. Based on the close inspection of melanoma specimens, noting that B7-H1 expression was restricted to the colocalized area of tumor cell and lymphocytes, the adaptive resistance mechanism was proposed. In a reciprocal way, IFN-γ secreted by activated effector T cells encountering tumor cells induces a strong expression of B7-H1 on the latter [18].
Epigenetic factors played a role in B7-H1 expression. Trimethylation of lysine 4 on histone H3 (H3K4me3) was enriched in the B7-H1 promoter in pancreatic tumor cells to activate B7-H1 transcription [19]. JQ-1, a specific inhibitor which blocked bromodomain-containing protein 4 (BRD4) binding to the acetylated histones, suppressed the expression of B7-H1, suggesting that histone acetylation took part in B7-H1 regulation [20, 21]. As is known to us, histone acetylation is the result of dynamic equilibrium of histone deacetylase (HDAC) and histone acetyltransferase (HAT) [22]. Of our interest, HDAC is a potential target of therapy in many cancers, and certain HDAC inhibitors (HDACIs) have been applied clinically [23]. Furthermore, HDACIs were shown to have widespread immuno-regulatory functions other than direct cytotoxic effects [24–26].
Herein, we investigated the role of HDAC in IFN-γ-induced B7-H1 expression in GC. We demonstrated that HDAC is indispensable for IFN-γ-induced B7-H1 expression. HDACI impaired IFN-γ signaling and B7-H1 expression. Furthermore, in the mouse model of subcutaneously grafted GC, HDACI treatment downregulated tumor B7-H1 and suppressed tumor growth. Our findings showed that HDAC inhibition is a possible way of targeting B7-H1 in GC.
Methods
Bioinformatics analysis
Differential expression of B7-H1, HDAC1–11 and SIRT1–7 between normal and GC tissues was evaluated using public available RNA-seq data from The Cancer Genome Atlas (TCGA) database through UALCAN portal [27, 28]. Correlation analysis between B7-H1, HDAC-11, and SIRT1–7 expression in GC tissues was performed through GEPIA web server using RNA-seq data from TCGA [29, 30]. Acetylation level of histone H3 lysine 27 (H3K27) in CD274 promoter region on seven cell lines was visualized through UCSC Genome Browser using ChIP-seq data from ENCODE [31–33].
Tissue samples
GC and adjacent tissues were obtained from Union Hospital, Tongji Medical College, Huazhong University of Science and Technology.
Cell culture and treatment
Human GC cell line HGC27 was purchased from Shanghai Cell Bank of Chinese Academy of Science, China. Mouse GC cell line MFC was purchased from Shanghai Zhong Qiao Xin Zhou Biotechnology Corporation, China. Both cells were cultured with RPMI 1640 (Hyclone, USA) supplemented with 10% fetal bovine serum (Gibco, USA), penicillin (100 u/ml), and streptomycin (100 mg/ml) in a humidified condition at 37 °C. Cells were treated with IFN-γ (Peprotech, USA) at different concentrations for indicated duration of time, alone or following the pretreatment of small molecular inhibitors for 8 h. HDACIs used included Vorinostat (SAHA), sodium butyrate, and Trichostatin A (TSA). GLPG0634, fedratinib, fludarabine, and NSC 74589 were used to selectively inhibit Janus kinase 1 (JAK1), JAK2, and signal transducer and activator of transcription 1 (STAT1) and STAT3, respectively. The small molecular inhibitors are all purchased from Apexbio, USA, and were dissolved in DMSO in storage concentration except that sodium butyrate was in the water.
Quantitative RT-PCR
Tissue or cultured cells were lysed using RNAiso plus (Takara, Japan), and total RNA was extracted according to the manufacturer’s instructions. cDNA was synthesized using kit RR036 according to the manufacturer’s instructions (Takara, Japan). qPCR was performed on StepOnePlus™ system using kit RR820 according to the manufacturer’s instructions (Takara, Japan). The following primers were used: human B7-H1 forward: TGGCATTTGCTGAACGCATTT, reverse: TGCAGCCAGGTCTAATTGTTTT; human glyceraldehyde-3-phosphate dehydrogenase (GAPDH) forward: CTGGGCTACACTGAGCACC, reverse: AAGTGGTCGTTGAGGGCAATG; human HDAC1 forward: CTACTACGACGGGGATGTTGG, reverse: GAGTCATGCGGATTCGGTGAG; human HDAC2 forward: ATGGCGTACAGTCAAGGAGG, reverse: TGCGGATTCTATGAGGCTTCA; human HDAC3 forward: CCTGGCATTGACCCATAGCC, reverse: CTCTTGGTGAAGCCTTGCATA; and human JAK2 forward: TCTGGGGAGTATGTTGCAGAA, reverse: AGACATGGTTGGGTGGATACC.
Flow cytometry
For cultured cells, they were trypsin digested and collected after indicated treatment. For resected tumor tissues, they were cut into small pieces and then digested in collagenase I (0.3 mg/ml) at 37 °C for 1 h. The mixture was filtered through a 100-μm strainer to remove undigested tissue blocks. Wash the collected cells using phosphate buffer saline (PBS) containing 1% bovine serum albumin (BSA) (wash buffer) twice. After the final wash, add wash buffer to resuspend cells. Incubate about 1 × 10⁶ cells with 3–5 μl antibody in 100 μl wash buffer at the 4 °C in darkness for 30 min. Wash the cells twice, and perform the analysis on the flow cytometer (BD, USA). The anti-human B7-H1-APC antibody and anti-mouse B7-H1-FITC antibody were purchased from Biolegend, USA.
Western blot
Tissues or cultured cells were lysed on ice using RIPA to extract total protein. After protein concentration determination using the BCA method, total protein was mixed with loading buffer and boiled at 100 °C for 5 min. Sodium dodecyl sulfate-polyacrylamide gel electrophoresis (SDS-PAGE) was performed according to the standard procedures, followed by protein transfer to PVDF membrane. After blocking, the PVDF membrane was incubated in diluted antibody solution at 4 °C overnight. After wash, the membrane was incubated with secondary horseradish peroxidase (HRP)-conjugated antibody at room temperature for 1 h. The membrane was then subjected to chemiluminescence, and the signal was detected by ChemiDoc MP system (BioRad, USA). Quantification was performed using ImageJ. The antibodies for human B7-H1 and GAPDH were purchased from Abcam, USA, and the antibodies for human HDAC1, HDAC2, HDAC3, JAK1, JAK2, STAT1, phosphorylated JAK1 (p-JAK1), p-JAK2, and p-STAT1 were purchased from Cell Signaling Technology, USA.
RNA interference
Small interference RNA (siRNA) targeting human HDAC1, HDAC2, HDAC3, and JAK2 gene were synthesized. The target sequences were as follows: HDAC1: GCCGGTCATGTCCAAAGTAAT; HDAC2: GCTGTGAAGTTAAACCGACAA; HDAC3: GCTTCACCAAGAGTCTTAA; and JAK2: AACTCTATCAGCTACAAGACA. siRNA targeting no specific genes were used as negative control (NC). Cells were cultured in six well plates and were transfected with specific siRNA using Lipo6000 reagent (Beyond, China) according to the manufacturer’s instructions. Thirty-six hours later, cells were harvested and target gene expression was determined using western blot.
Immunofluorescence
Cells growing on cover glasses were fixed using 4% paraformaldehyde. After an immerse wash in PBS, the cell membranes were permeabilized using 0.5% Triton X-100. After blocking with normal goat serum, the cells were incubated with diluted antibody solution at 4 °C overnight. After a wash in PBS, the cells were incubated with diluted secondary PE/CY3-conjugated antibody. After wash, the cells were stained with DAPI. Analyze the signal under a fluorescence microscope (Olympus, Japan).
Chromatin immunoprecipitation
Chromatin immunoprecipitation (ChIP) was performed using a kit purchased from CST (cat. #9002) according to the manufacturer’s instructions. Briefly, to crosslink DNA and proteins, cells were incubated with 1% formaldehyde for 10 min and quenched with the addition of 1.25 M glycine. Cells were washed in PBS and lysed in ChIP lysis buffer. Lysates were digested with the micrococcal nuclease at 37 °C to achieve DNA fragments with a length of approximate 150–900 bp. After the digestion, sonicate the lysate for three sets of 20 s at 20% maximum amplitude to break the nuclear membrane and clarify the lysate by centrifugation. To perform one immunoprecipitation, roughly 100 μl digested lysate from 4 × 10⁶ cells was needed. Add 400 μl ChIP buffer to 100 μl lysate and remove 10 μl diluted lysate as 2% input. For each immunoprecipitation, add 10 μg antibody to the lysate and incubate with rotation at 4 °C overnight. Then, add 30 μl ChIP-grade protein G agarose beads and incubate with rotation at 4°Cfor 2 h. Pellet protein G agarose beads and wash sequentially with low-salt and high-salt wash buffer. Elute DNA from the beads with elution buffer and reverse crosslinks (including the input sample). DNA purification was performed using spin columns. qPCR was performed as mentioned above. Enrichment of DNA for each IP was calculated using percent input method with the following equation:
The following antibody was used in ChIP: anti-H3K9Ac (CST). The following primers located in the B7-H1 promoter region were used, as designed in a previous study (Table 1) [34].
Table 1.
Primers located in the B7-H1 gene promoter region
| Name | Sequence | Location from TSS (bp) |
|---|---|---|
| B7-H1 pro1 | Forward: GGCAAATTCCGTTTGCCTCA | − 1766 |
| Reverse: TCCTCCTAGATGGCCTGGAT | ||
| B7-H1 pro2 | Forward: GCTGGGCCCAAACCCTATT | − 1178 |
| Reverse: TTTGGCAGGAGCATGGAGTT | ||
| B7-H1 pro3 | Forward: CTAGAAGTTCAGCGCGGGAT | − 800 |
| Reverse: GGCCCAAGATGACAGACGAT | ||
| B7-H1 pro4 | Forward: ATGGGTCTGCTGCTGACTTT | − 455 |
| Reverse: GGCGTCCCCCTTTCTGATAA | ||
| B7-H1 pro5 | Forward: GGGGGACGCCTTTCTGATAA | − 364 |
| Reverse: AAGCCAACATCTGAACGCAC | ||
| B7-H1 pro6 | Forward: AGGACGGAGGGTCTCTACAC | + 95 |
| Reverse: ATTGGCTCTACTGCCCCCTA | ||
| B7-H1 pro7 | Forward: GTAGGGAGCGTTGTTCCTCC | + 162 |
| Reverse: GTGTAGAGACCCTCCGTCCT | ||
| B7-H1 pro8 | Forward: TAGGGGGCAGTAGAGCCAAT | + 229 |
| Reverse: CAAAACTGAATCGCGCCTGG |
In vivo analysis
We constructed a syngeneic, immune competent mouse GC model by injecting MFC cells subcutaneously into 615 mice. MFC cell line was originally isolated from a primary forestomach carcinoma of an inbred 615 strain mouse. Five-week-old female 615 mice were purchased from Tianjin Institute of Hematology. 2 × 10⁶ MFC cells were injected subcutaneously into the right inguinal region. Three days after the injection, 12 mice were randomly assigned to the experimental or control group. For the experimental group, SAHA were injected subcutaneously with a daily dose of 20 mg/kg. For the control group, vehicle 6 μl DMSO + 30 μl PEG 300 + 70 μl Tween 80 was used. Measure the mice weight and tumor perpendicular diameters every 3 days. The tumor volume (V) was estimated as follows:
where L and W are the two perpendicular diameters.
Mice were sacrificed 15 days after the first treatment. Tumors were resected and prepared for further flow cytometry analysis.
Statistical analysis
Representative measurement data from three independent experiments were presented as mean ± SEM. For non-repeated measurement data, two-tailed Student’s t test was used for comparison between the two groups. For repeated measurement data, repeated measures analysis of variance was used. p < 0.05 was considered significant. Linear regression was performed to study the possible correlation between enrichment of H3K9Ac and B7-H1 transcription level. GraphPad Prism version 6.0 was used to perform the statistical analyses.
Results
B7-H1 expression was correlated with HDAC expression in GC
The mammalian HDAC family comprises 18 members, which are grouped into 4 classes, based on their homology to yeast deacetylase proteins [35, 36]. Class I HDACs are similar to yeast Rpd3, consisting of HDAC1, 2, 3, and 8, and are expressed ubiquitously and located mainly in the nucleus. Class II HDACs are related to yeast Had1, consisting of HDAC4, 5, 6, 7, 9, and 10, and can shuttle between cytosol and nucleus. Class III HDACs are homologs to yeast Sir2, requiring NAD+ for their activity, including SIRT1–7. HDAC11 is the only member of class IV HDAC, sharing homology with both Rpd3 and Hda1.
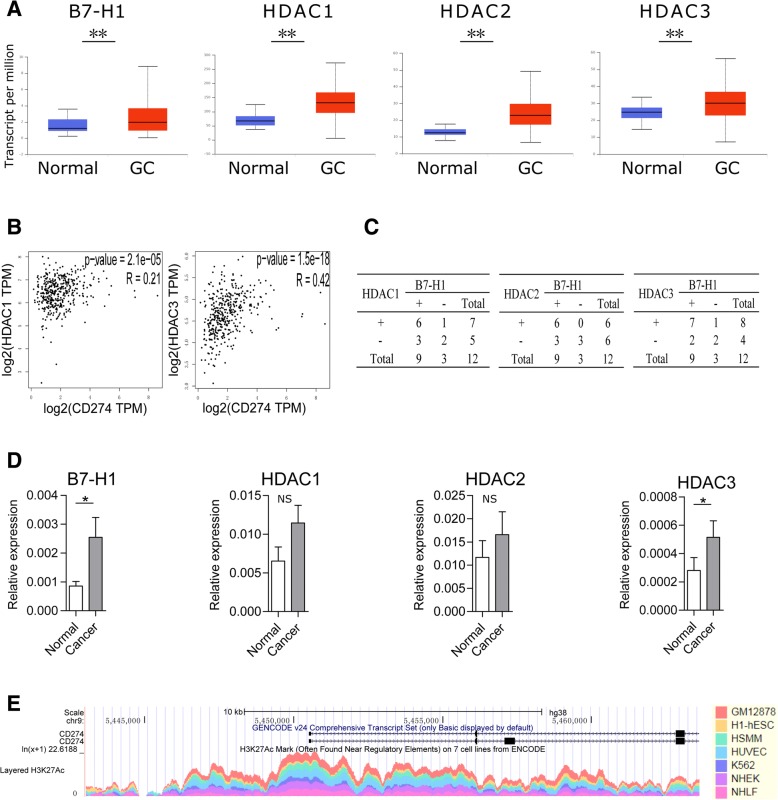
We mined public available database TCGA to examine the differential expression of B7-H1 and HDAC between normal and GC tissues. Analysis of RNA-seq data from 34 normal gastric tissues and 415 primary GC revealed significant upregulation of B7-H1; HDAC1–3, 6–8, and 10; and SIRT1, 3, 5, and 6 and downregulation of HDAC5 and SIRT4 in cancer (Fig. 1a, only data of B7-H1 and HDAC1–3 was presented). Correlation analysis from TCGA data revealed that HDAC3 and HDAC1 were significantly correlated with B7-H1 expression in GC with a respective r value of 0.42 (p < 0.001) and 0.21 (p < 0.001) (Fig. 1b). The results suggested that HDACs, especially HDAC1–3, may have a potential role in B7-H1 regulation. Furthermore, we determined the mRNA and protein expression levels of B7-H1 and HDAC1–3 in 12 GC and adjacent tissues collected from our institution. Western blot results showed that HDAC1, HDAC2, and HDAC3 expression change between cancer, and adjacent tissue was consistent with the B7-H1 level change in 8 (66.7%), 9 (75.0%), and 9 (75.0%) cases, respectively (Fig. 1c, Additional file 1: Figure S1). RT-qPCR results showed that B7-H1 and HDAC3 were significantly upregulated in GC tissues, while HDAC1 and HDAC2 upregulation did not reach statistical significance (Fig. 1d). Acetylation of histone H3 lysine 27 (H3K27Ac) in the gene promoter region is a marker of active gene transcription [37]. Chip-seq data from ENCODE showed that on GM12878, H1-hESC, HSMM, HUVEC, K562, NHEK, and NHLF cell lines, the B7-H1 gene promoter region was abundant with H3K27Ac mark, linking histone acetylation directly to the B7-H1 gene regulation (Fig. 1e). Overall, combined bioinformatics and clinical sample data indicated HDACs, especially HDAC1–3 may have a potential role in B7-H1 expression regulation in GC.
Fig. 1.
B7-H1 expression is correlated with HDAC in GC. a B7-H1 and HDAC1–3 expression was compared between normal gastric tissues (n = 34) and primary GC tissues (n = 415) from RNA-seq data of TCGA. The results were presented in box-and-whisker plots (median values (line), 25th–75th percentiles (box outline) and minimum and maximum values (whiskers)). b Spearman correlation analyses of B7-H1 and HDACs were performed using GC RNA-seq data of TCGA. c B7-H1 and HDAC1–3 protein expression was compared between 12 paired GC tissues and cancer-adjacent tissues collected from our institution. Shown were expression change between each pair of cancer and adjacent tissue. +, expression upregulation in cancer; −, expression downregulation in cancer. d B7-H1 and HDAC1–3 mRNA expression was compared between 12 paired GC tissues (cancer) and tumor-adjacent tissues (normal) collected from our institution. e H3K27Ac level in B7-H1 gene promoter region was assessed in seven cell lines using ChIP-seq data from ENCODE. *p < 0.05, **p < 0.001. NS, not significant
HDAC inhibition reduced IFN-γ-induced B7-H1 expression in GC
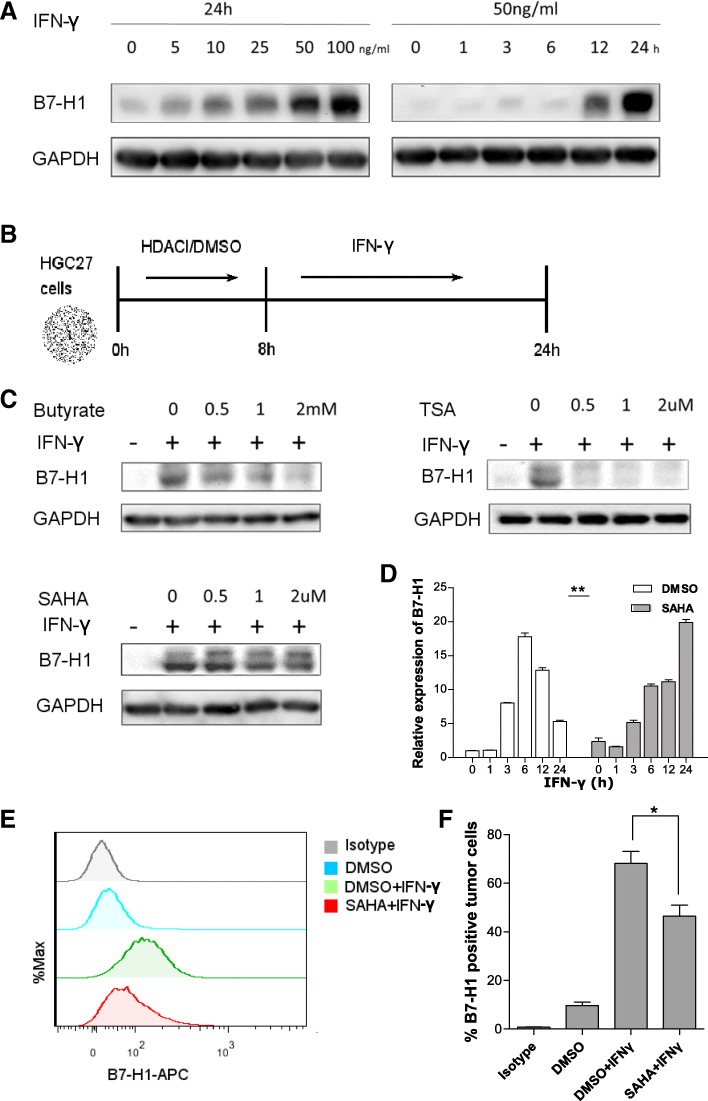
Next, we wondered whether HDAC inhibition had an effect on IFN-γ-induced B7-H1 expression in GC. Firstly, we confirmed that IFN-γ induced strong expression of B7-H1 on GC cells. Under rest state, HGC27 cells showed little or no expression of B7-H1. After treatment with IFN-γ of different concentration for varying length of time, HGC27 cells showed concentration and time-dependent upregulation of B7-H1, reaching the peak expression level with 100 ng/ml IFN-γ stimulation for 24 h (Fig. 2a). We next investigated HDACI’s effect on the B7-H1 induction. Sodium butyrate, TSA, and SAHA are HDACIs with different molecular structures. Pretreatment with HDACI significantly reduced IFN-γ-induced B7-H1 expression (Fig. 2b). To investigate the effect at the transcription level, RT-qPCR was performed (Fig. 2c). The results showed that SAHA treatment alone was able to upregulate basal B7-H1 mRNA expression by about twofolds. However, IFN-γ-induced B7-H1 expression was reduced at 3, 6, and 12 h post-stimulation. Furthermore, the kinetics of B7-H1 mRNA induction was altered. SAHA pretreatment caused a delay of the peak B7-H1 mRNA level from 6 to 24 h after IFN-γ stimulation. As SAHA was only applied for 8 h and then removed prior to IFN-γ stimulation, the altered kinetics of B7-H1 mRNA expression was likely the result of HDAC activity returning. Cell surface expression of B7-H1 is important for its function. Flow cytometry confirmed that cell surface expression of B7-H1 was also reduced (Fig. 2d, e).
Fig. 2.
HDAC inhibition suppressed IFN-γ-induced B7-H1 expression in GC. a HGC27 cells were treated with IFN-γ of 0 to 100 ng/ml for 24 h or of 50 ng/ml for 0 to 24 h before B7-H1 protein expression was determined. b As was shown in the treatment schedule, HGC27 cells were pretreated with either DMSO or different concentrations of HDACI (sodium butyrate, TSA, or SAHA) for 8 h, which was then removed, followed by treatment with 50 ng/ml IFN-γ for 24 h. c HGC27 cells were treated according to the above schedule; then, B7-H1 protein expression was determined. d HGC27 cells were treated according to the above schedule; then, B7-H1 mRNA expression was determined. e, f HGC27 cells were treated according to the above schedule; then, cell surface B7-H1 expression was determined by flow cytometry. c–e Experiments were repeated three times with similar results. *p < 0.05, **p < 0.001
HDAC knockdown suppressed IFN-γ-induced B7-H1 expression in GC
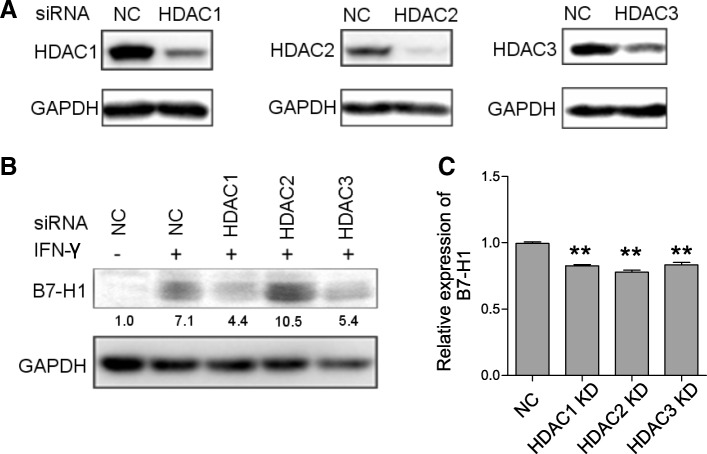
One of the limitations of HDACI used above is that they are not HDAC subclass-specific. To linearize specific HDAC’s role in IFN-γ-induced B7-H1 expression, we performed HDAC gene knockdown. Based on the bioinformatics study, we focused on HDAC1–3. siRNA transfection effectively downregulated the expression of HDAC1–3. Following the knockdown, HGC27 cells were stimulated with IFN-γ for 24 h, and B7-H1 expression was determined. Western blot showed that HDAC1 and HDAC3 knockdown significantly reduced induced B7-H1 expression compared to negative control siRNA transfection, while HDAC2 knockdown had no such effect (Fig. 3a, b). RT-qPCR revealed that HDAC1–3 knockdown all reduced induced B7-H1 mRNA expression (Fig. 3c). The results suggested HDAC1 and HDAC3 had specific roles in regulating IFN-γ-induced B7-H1 in GC.
Fig. 3.
HDAC knockdown suppressed IFN-γ-induced B7-H1 expression in GC. a 36 h after transfection of negative control (NC) or HDAC siRNA, HDAC1, HDAC2, and HDAC3 protein expression in HGC27 cells was determined, respectively. b Following siRNA transfection, HGC27 cells were treated with 50 ng/ml IFN-γ for 24 h. Then, B7-H1 protein expression was determined. c Following siRNA transfection, HGC27 cells were treated with 50 ng/ml IFN-γ for 12 h. Then, B7-H1 mRNA expression were determined. a–c Experiments were repeated three times with similar results. **p < 0.001
SAHA pretreatment or HDAC knockdown impaired early phase IFN-γ signaling through JAK2 downregulation
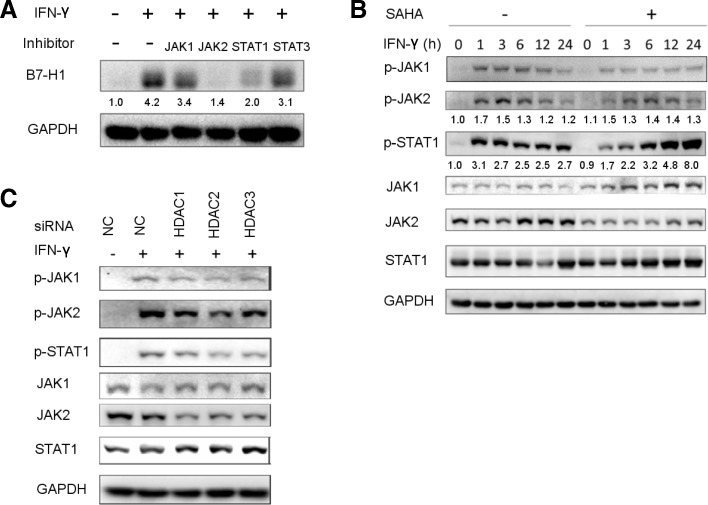
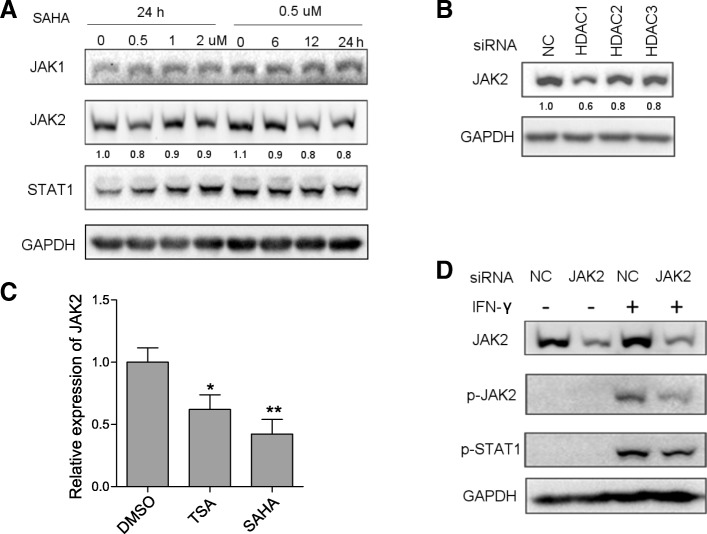
Since IFN-γ-induced gene expression relies on robust signaling transduction, we investigated HDACI’s impact on IFN-γ signaling pathway. The key components of the pathway include JAK1, JAK2, and STAT1, all of which are tyrosine kinases and can be activated through tyrosine phosphorylation. Upon IFN-γ binding to the interferon gamma receptor (IFNGR), JAK1 and JAK2 phosphorylate each other and then they phosphorylate IFNGR1 to allow docking and phosphorylation of STAT1 [38]. Inhibition of JAK2 and STAT1 resulted in reduced IFN-γ-induced B7-H1 expression in HGC27 cells, while a minor effect was observed for JAK1 and STAT3 inhibition (Fig. 4a). Among them, JAK2 inhibition had the strongest effect, almost completely abrogating IFN-γ-induced B7-H1 expression. We further investigated the effects of HDACI on JAK1, JAK2, and STAT1 expression and phosphorylation. SAHA pretreatment significantly reduced the expression level p-JAK1, p-JAK2, and p-STAT1 at 1 h and 3 h post-IFN-γ stimulation (Fig. 4b). Normally, IFN-γ-induced signaling would eventually resolute, and the expression of phosphorylated proteins went back to the pre-stimulation level, which started to happen at 12 h post-stimulation in HGC27 according to our results. Interestingly, SAHA pretreatment caused the persistent relatively high level of p-JAK1, p-JAK2, and p-STAT1 at 12 h and 24 h post-IFN-γ stimulation. The data indicated that SAHA impaired early phase IFN-γ signaling, although it seemed to enhance prolonged signaling. Next, we performed HDAC knockdown followed by IFN-γ stimulation. HDAC1–3 knockdown also reduced the expression of p-JAK1, p-JAK2, and p-STAT1 at 3 h after IFN-γ stimulation (Fig. 4c). Noticeably, SAHA pretreatment and HDAC knockdown reduced JAK2 expression while JAK1 and STAT1 were not affected. To further validate the results, we treated HGAC27 cells with varying concentration of SAHA for a different length of time. We found that SAHA downregulated the JAK2 expression at different concentration and time (Fig. 5a). HDAC, especially HDAC1 knockdown, had the same effect (Fig. 5b). RT-qPCR showed that both TSA and SAHA could downregulate JAK2 mRNA level (Fig. 5c). In light of JAK2’s key role in IFN-γ signaling and its upstream position in the pathway, we hypothesized that JAK2 downregulation was the mechanism behind SAHA or HDAC knockdown’s effect. To support this, JAK2 knockdown downregulated p-JAK2 and p-STAT1 level following IFN-γ stimulation (Fig. 5d). Overall, the results suggested that impairment of IFN-γ signaling caused by HDAC inhibition was mediated by JAK2 downregulation.
Fig. 4.
SAHA pretreatment or HDAC knockdown suppressed the expression of p-JAK1, p-JAK2, and p-STAT1. a HGC27 cells were pretreated with either DMSO or GLPG0634 (5 μM), fedratinib (5 μM), fludarabine (100 μM), and NSC 74589 (200 μM) for 8 h to inhibit JAK1, JAK2, STAT1, and STAT3, respectively, followed by treatment of 50 ng/ml IFN-γ for 24 h. Then, B7-H1 protein expression was determined. b HGC27 cells were treated according to the schedule shown in Fig. 2b; then, the expression of the phosphorylated and total protein of JAK1, JAK2, and STAT1 was determined. c Thirty-six hours after the transfection of negative control (NC) or HDAC siRNA, HGC27 cells were treated with 50 ng/ml IFN-γ for 3 h. Then, the expression of the phosphorylated and total protein of JAK1, JAK2, and STAT1 was determined. a–c Experiments were repeated three times with similar results
Fig. 5.
HDAC inhibition or HDAC knockdown suppressed JAK2 expression. a HGC27 cells were treated with 0–2 μM SAHA for 24 h or with 0.5 μM SAHA for 0–24 h prior to JAK2 protein expression determination. b Thirty-six hours after transfection of NC or HDAC siRNA, JAK2 protein expression in HGC27 cells was determined. c Twenty-four hours after DMSO, SAHA (0.5 μM), or TSA (0.5 μM) treatment, JAK2 mRNA expression in HGC27 cells was determined. d Thirty-six hours after transfection of NC or JAK2 siRNA, HGC27 cells were treated with 50 ng/ml IFN-γ for 3 h. Then JAK2, p-JAK2, and p-STAT1 protein expression were determined. a–d Experiments were repeated three times with similar results. *p < 0.05, **p < 0.001
SAHA pretreatment impaired STAT1 nuclear translocation
Nuclear translocation of STAT1 is an important step of the IFN-γ signal transduction. Following phosphorylation, STAT1 homodimerized and was translocated from the cytoplasm to the nucleus [39]. We investigated the effects of SAHA on the process (Fig. 6). Immunofluorescence staining 1 h and 3 h after IFN-γ stimulation showed that IFN-γ induced efficient STAT1 translocation. However, SAHA pretreatment significantly enhanced the cytoplasm intensity of STAT1, which indicates cytoplasm retention. The results indicated that SAHA impaired IFN-γ-induced STAT1 nuclear translocation.
Fig. 6.
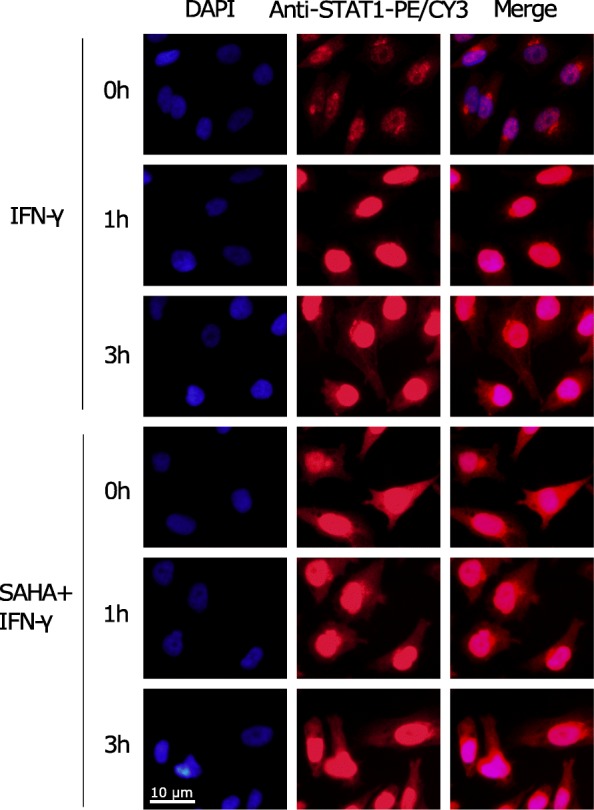
SAHA pretreatment impaired STAT1 nuclear translocation. HGC27 cells were pretreated with either DMSO or 2 μM SAHA for 8 h before stimulation with 50 ng/ml IFN-γ for 1 h or 3 h. Immunofluorescence staining of STAT1 was performed. The experiment was repeated three times with similar results
SAHA pretreatment impaired IFN-γ-induced histone acetylation of B7-H1 gene promoter
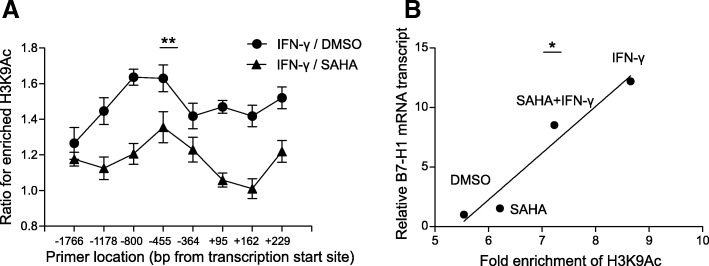
Acetylation of histone and subsequent chromatin remodeling is one of the integral parts for IFN-γ-induced gene transcription [40–42]. STAT1 binding to the GAS sequence recruited HAT and HDAC to induce histone hyperacetylation [43, 44]. We investigated the effect of HADC inhibition on IFN-γ-induced histone acetylation on B7-H1 gene promoter region through ChIP-qPCR assay. Enrichment of H3K9Ac, a marker of active transcription, was upregulated by IFN-γ up to 1.6-folds at − 455 bp from the TSS (Fig. 7a). However, following SAHA pretreatment, IFN-γ only induced an upregulation of 1.3-folds at the same site. The same trend was observed for other sites along the B7-H1 gene regulatory region, ranging from − 1766 to + 229 bp from TSS. Furthermore, we showed that the enrichment of H3K9Ac in the promoter area significantly correlated with B7-H1 level with a r2 of 0.94 (Fig. 7b). The data showed that IFN-γ-induced histone acetylation of B7-H1 gene promoter was inhibited by SAHA.
Fig. 7.
SAHA pretreatment impaired IFN-γ-induced histone acetylation of B7-H1 gene promoter. a HGC27 cells were pretreated with either DMSO or 2 μM SAHA for 8 h before stimulation with 50 ng/ml IFN-γ for 3 h. ChIP was performed using anti-H3K9Ac followed by quantification of immunoprecipitated B7-H1 gene promoter through PCR. H3K9Ac enrichment was determined by the percent input method. IFN-γ-induced upregulation of H3K9Ac was calculated as the ratio of H3K9Ac enrichment at post-stimulation to that at pre-stimulation. b The correlative relationship between enrichment of H3K9Ac at the promoters of B7-H1 gene and relative B7-H1 mRNA transcription in the same cell populations mentioned in A. X-axis stood for the mean value of enrichment of H3K9Ac at all the promoters of B7-H1 gene. Y-axis stood for B7-H1 mRNA expression relative to pre-stimulation level. a, b Experiments were repeated three times. **p < 0.001, *p < 0.05
SAHA inhibited tumor growth and reduced tumor B7-H1 expression in subcutaneously transplanted mouse GC model
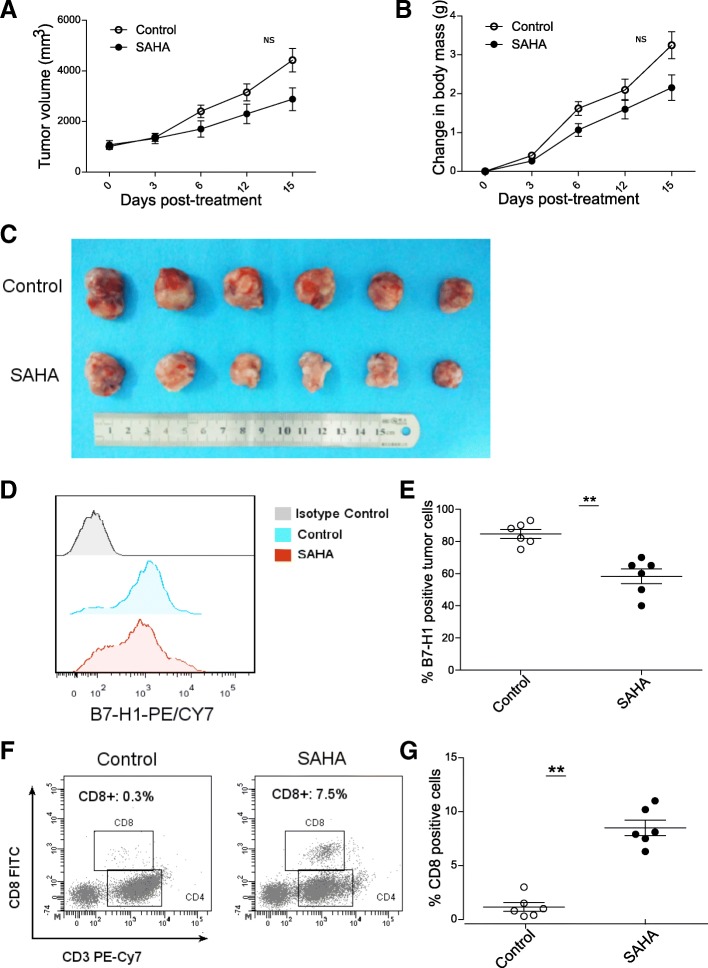
We investigated HDACI’s effect on tumor growth and B7-H1 expression in vivo using the subcutaneously transplanted mouse GC model. A trend of slower tumor growth and smaller tumor size in SAHA group compared to that of the control group was observed (Fig. 8a–c). However, the difference did not reach statistical significance. The percentage of B7-H1-positive tumor cells was also lower in SAHA group (Fig. 8d, e). Considering B7-H1’s role in regulating tumor immunity, we further determined the amount of tumor-infiltrating CD8+ T cells (Fig. 8f, g). A higher percentage of infiltrating CD8+ T cells was observed in tumors in SAHA group than those in the control group.
Fig. 8.
SAHA inhibited tumor growth and suppressed tumor B7-H1 expression in subcutaneously transplanted mouse GC model. a–c SAHA treatment group showed slower tumor growth and smaller tumor size compared to control group. d, e Tumor cell B7-H1 expression was lower in SAHA group than in the control group. f, g The percentage of tumor infiltrated CD8+ tumor cells was higher in the SAHA group than in the control group. Shown in d and f are representative results in one mouse. NS, not significant; **p < 0.001
Discussion
Our study revealed that HDAC is indispensable for the expression of B7-H1 in GC, as HDAC inhibition reduced IFN-γ-induced B7-H1 expression. HDAC has long been deemed as an eligible target in cancer [23]. B7-H1 is the recently defined immune checkpoint, and B7-H1 blockade using monoclonal antibodies showed great potential as a new treatment modality [10]. Thus, our study suggested that HDAC may dictate how robustly cells will respond to the IFN-γ in the tumor microenvironment, raising the possibility of targeting B7-H1 using HDAC inhibitors.
Our results revealed that HDACI impaired early phase IFN-γ signaling by downregulating JAK2. JAK2 is the key upstream component of the IFN-γ signaling pathway, the absence of which led to unresponsiveness to IFN-γ [38, 45, 46]. However, the previous studies reported several distinct mechanisms behind HDACI-elicited impaired IFN-γ signaling. One proposed that HDACI caused STAT1 hyperacetylation, which compromised its phosphorylation and activation [47, 48]. But the results were unable to be repeated by another group [49]. Others reported that HDACI upregulated suppressor of cytokine signaling (SOCS) gene expression, which is responsible for negative feedback regulation of IFN-γ signaling pathway [50, 51]. SOCS can downregulate JAK2 by accelerating its degeneration [52]. We revealed that both JAK2 mRNA and protein expression were decreased by HDACI treatment, which indicated HDAC’s role in transcriptional regulation of JAK2. Our results suggested certain HDACs took part in regulating B7-H1 expression. Recently isoform-selective HDAC inhibitors have been developed [53–55]. Whether they have a role in the more specific and targeted inhibition of B7-H1 than pan-HDAC inhibitors such as SAHA and TSA remains to be determined.
HDACI has been shown to have widespread immuno-regulatory effects. Some reported that HDACI enhanced tumor immunity. It upregulated major histocompatibility complex (MHC) and co-stimulators CD40 and CD86 expression, promoting melanoma cells’ antigen presenting capability [24]. It suppressed regulatory T cells by modulating forkhead box P3 (Foxp3) expression [25, 26]. Furthermore, it upregulated the expression of natural killer group 2 member D (NKG2D) ligands on tumor cells, enhancing NK cell-mediated killing [56]. In contrast, others reported that HADCi repressed tumor immunity. For example, it increased myeloid-derived suppressor cell (MDSC) production [57]. The contradicting conclusions may derive from distinct experiment models and systems involved. From our point of view, HDACI enhanced tumor immunity by suppressing tumor B7-H1 expression in vitro and in vivo. The immuno-regulatory effect makes HDACI exert anti-tumor function independent of its cytotoxic effects. That makes it the ideal candidate for combinatory therapy with anti-B7-H1 to enhance efficacy and limit adverse effects. As a matter of fact, clinical trials evaluating safety and efficacy of combinatory therapy of HDACI and anti-B7-H1 in cancer patients are already on the way [58].
In our study, the observed in vivo tumor inhibition effect of HDACI was modest. There are three possible reasons. One is that the HDACI at the dose we used did not inhibit B7-H1 expression to an optimal level. As was shown in FACS results, relatively high expression of B7-H1 remained on tumors cells. The second is that compared with cell toxicity effects, immunological anti-tumor effects tend to require a longer time to show. In the short observation period, as was used in our study, immunological effects exerted by HDACI probably did not reach its maximal level. Thirdly, gastric cancer is a multifactorial and aggressive tumor. In our study, we focused on the possible immunological aspect of the tumor, while other factors may also have roles in promoting its growth. From our results, we inferred that the immunological effect may play a relatively minor part.
There are several limitations and unaddressed questions in our study. Firstly, HDACI’s inhibition of B7-H1 may be accompanied by other genes’ expression change because of the repression of the entire IFN-γ signaling. Secondly, the effect may be cell type specific. Thirdly, pan-HDACIs were used, and HDAC subtype’s function still needed to be further linearized. Besides, HDACI’s effect on the B7-H1 expression on the tumor-infiltrating immune cell was not examined.
Conclusions
IFN-γ-induced B7-H1 expression in GC cells requires HDAC. Inhibition of HDAC impaired IFN-γ’s ability to induce B7-H1 expression, resulting in reduced tumor growth and increased tumor-infiltrating CD8-positive T cells in mouse subcutaneous model. Mechanistically, inhibition of certain HDAC downregulated the expression of JAK2, the key component of the IFN-γ signaling pathway, which subsequently led to compromised activation of IFN-γ signaling and histone acetylation in B7-H1 gene promoter region. The role of HDAC in the regulation of B7-H1 expression suggests small molecular HDACI as a potential way of targeting B7-H1 in GC.
Additional file
Figure S1. HDAC1–3 expression correlated B7-H1 expression in clinical gastric specimens. (A) B7-H1 and HDAC1–3 expression in 12 paired gastric cancer (C) and adjacent tissues (A) were determined by western blot. (B) After quantification and normalization, the expression change of HDAC1–3 and B7-H1 between each pair of cancer and adjacent tissue was presented. A, the experiment was repeated three times with similar results. (PDF 105 kb)
Acknowledgements
We thank Dr. Zheng Wang and Dr. Ke Wu for their helpful guidance and suggestions for the research.
Funding
This study was supported by the National Key Basic Research Program of China (No. 2015CB5540007), the National Natural Science Foundation of China (No. 81572413), the Foundation of Independent Innovation Fund of Huazhong University of Science and Technology (No.2017KFYXJJ230), and the Natural Science Foundation of Hubei Province (No.2016CFA100 and No. 2017CFB179).
Availability of data and materials
All data generated or analyzed during this study are included in this published article.
Abbreviations
- ChIP
Chromatin immunoprecipitation
- HDAC
Histone deacetylase
- JAK1
Janus kinase 1
- STAT1
Signal transducer and activator of transcription 1
Authors’ contributions
TKX and WGB developed the hypothesis. MXX conducted the bioinformatic analysis. LWZ and ZXX conducted the animal experiment. WT collected the clinical samples. DR performed the cell research work and wrote the article. SL performed the flow cytometry. ZP performed the data analysis. YYP and CWL revised the manuscript. All authors read and approved the final manuscript.
Ethics approval and consent to participate
All participating individuals were informed of the study and provided their written consent. The study protocols were approved by the Ethics Committees of Union Hospital, Tongji Medical College, Huazhong University of Science and Technology. All animal experiments were performed in accordance with the National Institutes of Health Guidelines for the Use of Laboratory Animals. Animal experimental protocols were approved by the Animal Ethics Committee of the Union Hospital, Tongji Medical College, Huazhong University of Science and Technology.
Consent for publication
Not applicable.
Competing interests
The authors declare that they have no competing interests.
Publisher’s Note
Springer Nature remains neutral with regard to jurisdictional claims in published maps and institutional affiliations.
References
- 1.Fitzmaurice C, Allen C, Barber RM, Barregard L, Bhutta ZA, Brenner H, et al. Global, regional, and national cancer incidence, mortality, years of life lost, years lived with disability, and disability-adjusted life-years for 32 cancer groups, 1990 to 2015: a systematic analysis for the Global Burden of Disease Study. JAMA Oncol. 2017;3:524–548. doi: 10.1001/jamaoncol.2017.1747. [DOI] [PMC free article] [PubMed] [Google Scholar]
- 2.Chen W, Zheng R, Baade PD, Zhang S, Zeng H, Bray F, et al. Cancer statistics in China, 2015. CA Cancer J Clin. 2016;66:115–132. doi: 10.3322/caac.21338. [DOI] [PubMed] [Google Scholar]
- 3.Ferrone C, Dranoff G. Dual roles for immunity in gastrointestinal cancers. J Clin Oncol. 2010;28:4045–4051. doi: 10.1200/JCO.2010.27.9992. [DOI] [PMC free article] [PubMed] [Google Scholar]
- 4.Wessler S, Krisch LM, Elmer DP, Aberger F. From inflammation to gastric cancer - the importance of Hedgehog/GLI signaling in Helicobacter pylori-induced chronic inflammatory and neoplastic diseases. Cell Commun Signal. 2017;15:15. doi: 10.1186/s12964-017-0171-4. [DOI] [PMC free article] [PubMed] [Google Scholar]
- 5.Freeman GJ, Long AJ, Iwai Y, Bourque K, Chernova T, Nishimura H, et al. Engagement of the PD-1 immunoinhibitory receptor by a novel B7 family member leads to negative regulation of lymphocyte activation. J Exp Med. 2000;192:1027–1034. doi: 10.1084/jem.192.7.1027. [DOI] [PMC free article] [PubMed] [Google Scholar]
- 6.Dong H, Strome SE, Salomao DR, Tamura H, Hirano F, Flies DB, et al. Tumor-associated B7-H1 promotes T-cell apoptosis: a potential mechanism of immune evasion. Nat Med. 2002;8:793–800. doi: 10.1038/nm730. [DOI] [PubMed] [Google Scholar]
- 7.Keir ME, Butte MJ, Freeman GJ, Sharpe AH. PD-1 and its ligands in tolerance and immunity. Annu Rev Immunol. 2008;26:677–704. doi: 10.1146/annurev.immunol.26.021607.090331. [DOI] [PMC free article] [PubMed] [Google Scholar]
- 8.Barber DL, Wherry EJ, Masopust D, Zhu B, Allison JP, Sharpe AH, et al. Restoring function in exhausted CD8 T cells during chronic viral infection. Nature. 2006;439:682–687. doi: 10.1038/nature04444. [DOI] [PubMed] [Google Scholar]
- 9.Gu L, Chen M, Guo D, Zhu H, Zhang W, Pan J, et al. PD-L1 and gastric cancer prognosis: a systematic review and meta-analysis. PLoS One. 2017;12:e0182692. doi: 10.1371/journal.pone.0182692. [DOI] [PMC free article] [PubMed] [Google Scholar]
- 10.Zou W, Wolchok JD, Chen L. PD-L1 (B7-H1) and PD-1 pathway blockade for cancer therapy: mechanisms, response biomarkers, and combinations. Sci Transl Med. 2016;8:328rv324. doi: 10.1126/scitranslmed.aad7118. [DOI] [PMC free article] [PubMed] [Google Scholar]
- 11.Antonia SJ, Villegas A, Daniel D, Vicente D, Murakami S, Hui R, et al. Durvalumab after chemoradiotherapy in stage III non-small-cell lung cancer. N Engl J Med. 2017;377:1919–1929. doi: 10.1056/NEJMoa1709937. [DOI] [PubMed] [Google Scholar]
- 12.Powles T, O’Donnell PH, Massard C, Arkenau HT, Friedlander TW, Hoimes CJ, et al. Efficacy and safety of durvalumab in locally advanced or metastatic urothelial carcinoma: updated results from a phase 1/2 open-label study. JAMA Oncol. 2017;3:e172411. doi: 10.1001/jamaoncol.2017.2411. [DOI] [PMC free article] [PubMed] [Google Scholar]
- 13.Dong H, Zhu G, Tamada K, Chen L. B7-H1, a third member of the B7 family, co-stimulates T-cell proliferation and interleukin-10 secretion. Nat Med. 1999;5:1365–1369. doi: 10.1038/70932. [DOI] [PubMed] [Google Scholar]
- 14.Li N, Wang J, Zhang N, Zhuang M, Zong Z, Zou J, et al. Cross-talk between TNF-alpha and IFN-gamma signaling in induction of B7-H1 expression in hepatocellular carcinoma cells. Cancer Immunol Immunother. 2018;67:271–283. doi: 10.1007/s00262-017-2086-8. [DOI] [PMC free article] [PubMed] [Google Scholar]
- 15.Sumimoto H, Takano A, Teramoto K, Daigo Y. RAS-mitogen-activated protein kinase signal is required for enhanced PD-L1 expression in human lung cancers. PLoS One. 2016;11:e0166626. doi: 10.1371/journal.pone.0166626. [DOI] [PMC free article] [PubMed] [Google Scholar]
- 16.Okita R, Maeda A, Shimizu K, Nojima Y, Saisho S, Nakata M. PD-L1 overexpression is partially regulated by EGFR/HER2 signaling and associated with poor prognosis in patients with non-small-cell lung cancer. Cancer Immunol Immunother. 2017;66:865–876. doi: 10.1007/s00262-017-1986-y. [DOI] [PMC free article] [PubMed] [Google Scholar]
- 17.Kinter AL, Godbout EJ, McNally JP, Sereti I, Roby GA, O’Shea MA, et al. The common gamma-chain cytokines IL-2, IL-7, IL-15, and IL-21 induce the expression of programmed death-1 and its ligands. J Immunol. 2008;181:6738–6746. doi: 10.4049/jimmunol.181.10.6738. [DOI] [PubMed] [Google Scholar]
- 18.Taube JM, Anders RA, Young GD, Xu H, Sharma R, McMiller TL, et al. Colocalization of inflammatory response with B7-h1 expression in human melanocytic lesions supports an adaptive resistance mechanism of immune escape. Sci Transl Med. 2012;4:127ra137. doi: 10.1126/scitranslmed.3003689. [DOI] [PMC free article] [PubMed] [Google Scholar]
- 19.Lu C, Paschall AV, Shi H, Savage N, Waller JL, Sabbatini ME, et al. The MLL1-H3K4me3 Axis-mediated PD-L1 expression and pancreatic cancer immune evasion. J Natl Cancer Inst. 2017;109(6):djw283. [DOI] [PMC free article] [PubMed]
- 20.Zhu H, Bengsch F, Svoronos N, Rutkowski MR, Bitler BG, Allegrezza MJ, et al. BET bromodomain inhibition promotes anti-tumor immunity by suppressing PD-L1 expression. Cell Rep. 2016;16:2829–2837. doi: 10.1016/j.celrep.2016.08.032. [DOI] [PMC free article] [PubMed] [Google Scholar]
- 21.Hogg SJ, Vervoort SJ, Deswal S, Ott CJ, Li J, Cluse LA, et al. BET-bromodomain inhibitors engage the host immune system and regulate expression of the immune checkpoint ligand PD-L1. Cell Rep. 2017;18:2162–2174. doi: 10.1016/j.celrep.2017.02.011. [DOI] [PMC free article] [PubMed] [Google Scholar]
- 22.Selvi RB, Kundu TK. Reversible acetylation of chromatin: implication in regulation of gene expression, disease and therapeutics. Biotechnol J. 2009;4:375–390. doi: 10.1002/biot.200900032. [DOI] [PubMed] [Google Scholar]
- 23.Eckschlager T, Plch J, Stiborova M, Hrabeta J. Histone deacetylase inhibitors as anticancer drugs. Int J Mol Sci. 2017;18(7):1414-39. [DOI] [PMC free article] [PubMed]
- 24.Khan AN, Gregorie CJ, Tomasi TB. Histone deacetylase inhibitors induce TAP, LMP, Tapasin genes and MHC class I antigen presentation by melanoma cells. Cancer Immunol Immunother. 2008;57:647–654. doi: 10.1007/s00262-007-0402-4. [DOI] [PMC free article] [PubMed] [Google Scholar]
- 25.Shen L, Ciesielski M, Ramakrishnan S, Miles KM, Ellis L, Sotomayor P, et al. Class I histone deacetylase inhibitor entinostat suppresses regulatory T cells and enhances immunotherapies in renal and prostate cancer models. PLoS One. 2012;7:e30815. doi: 10.1371/journal.pone.0030815. [DOI] [PMC free article] [PubMed] [Google Scholar]
- 26.Xiao H, Jiao J, Wang L, O’Brien S, Newick K, Wang LC, et al. HDAC5 controls the functions of Foxp3(+) T-regulatory and CD8(+) T cells. Int J Cancer. 2016;138:2477–2486. doi: 10.1002/ijc.29979. [DOI] [PMC free article] [PubMed] [Google Scholar]
- 27.Chandrashekar DS, Bashel B, Balasubramanya SAH, Creighton CJ, Ponce-Rodriguez I, Chakravarthi B, et al. UALCAN: a portal for facilitating tumor subgroup gene expression and survival analyses. Neoplasia. 2017;19:649–658. doi: 10.1016/j.neo.2017.05.002. [DOI] [PMC free article] [PubMed] [Google Scholar]
- 28.UALCAN . Chandrashekar DS lab, The University of Alabama at Birmingham. 2017. [Google Scholar]
- 29.Tang Z, Li C, Kang B, Gao G, Li C, Zhang Z. GEPIA: a web server for cancer and normal gene expression profiling and interactive analyses. Nucleic Acids Res. 2017;45:W98–w102. doi: 10.1093/nar/gkx247. [DOI] [PMC free article] [PubMed] [Google Scholar]
- 30.Gene Expression Profiling Interactive Analysis . Zhang lab, Peking University. 2017. [Google Scholar]
- 31.Rosenbloom KR, Sloan CA, Malladi VS, Dreszer TR, Learned K, Kirkup VM, et al. ENCODE data in the UCSC Genome Browser: year 5 update. Nucleic Acids Res. 2013;41:D56–D63. doi: 10.1093/nar/gks1172. [DOI] [PMC free article] [PubMed] [Google Scholar]
- 32.Kent WJ, Sugnet CW, Furey TS, Roskin KM, Pringle TH, Zahler AM, et al. The human genome browser at UCSC. Genome Res. 2002;12:996–1006. doi: 10.1101/gr.229102. [DOI] [PMC free article] [PubMed] [Google Scholar]
- 33.The UCSC Genome Browser . Univesity of California Santa Cruze. 2000. [Google Scholar]
- 34.Woods DM, Sodre AL, Villagra A, Sarnaik A, Sotomayor EM, Weber J. HDAC inhibition upregulates PD-1 ligands in melanoma and augments immunotherapy with PD-1 blockade. Cancer Immunol Res. 2015;3:1375–1385. doi: 10.1158/2326-6066.CIR-15-0077-T. [DOI] [PMC free article] [PubMed] [Google Scholar]
- 35.Parbin S, Kar S, Shilpi A, Sengupta D, Deb M, Rath SK, et al. Histone deacetylases: a saga of perturbed acetylation homeostasis in cancer. J Histochem Cytochem. 2014;62:11–33. doi: 10.1369/0022155413506582. [DOI] [PMC free article] [PubMed] [Google Scholar]
- 36.Glozak MA, Seto E. Histone deacetylases and cancer. Oncogene. 2007;26:5420–5432. doi: 10.1038/sj.onc.1210610. [DOI] [PubMed] [Google Scholar]
- 37.Kimura H. Histone modifications for human epigenome analysis. J Hum Genet. 2013;58:439–445. doi: 10.1038/jhg.2013.66. [DOI] [PubMed] [Google Scholar]
- 38.Bach EA, Tanner JW, Marsters S, Ashkenazi A, Aguet M, Shaw AS, et al. Ligand-induced assembly and activation of the gamma interferon receptor in intact cells. Mol Cell Biol. 1996;16:3214–3221. doi: 10.1128/MCB.16.6.3214. [DOI] [PMC free article] [PubMed] [Google Scholar]
- 39.Sekimoto T, Nakajima K, Tachibana T, Hirano T, Yoneda Y. Interferon-gamma-dependent nuclear import of Stat1 is mediated by the GTPase activity of Ran/TC4. J Biol Chem. 1996;271:31017–31020. doi: 10.1074/jbc.271.49.31017. [DOI] [PubMed] [Google Scholar]
- 40.Qiao Y, Giannopoulou EG, Chan CH, Park SH, Gong S, Chen J, et al. Synergistic activation of inflammatory cytokine genes by interferon-gamma-induced chromatin remodeling and toll-like receptor signaling. Immunity. 2013;39:454–469. doi: 10.1016/j.immuni.2013.08.009. [DOI] [PMC free article] [PubMed] [Google Scholar]
- 41.Lang C, Hildebrandt A, Brand F, Opitz L, Dihazi H, Luder CG. Impaired chromatin remodelling at STAT1-regulated promoters leads to global unresponsiveness of Toxoplasma gondii-infected macrophages to IFN-gamma. PLoS Pathog. 2012;8:e1002483. doi: 10.1371/journal.ppat.1002483. [DOI] [PMC free article] [PubMed] [Google Scholar]
- 42.Burke SJ, Goff MR, Lu D, Proud D, Karlstad MD, Collier JJ. Synergistic expression of the CXCL10 gene in response to IL-1beta and IFN-gamma involves NF-kappaB, phosphorylation of STAT1 at Tyr701, and acetylation of histones H3 and H4. J Immunol. 2013;191:323–336. doi: 10.4049/jimmunol.1300344. [DOI] [PubMed] [Google Scholar]
- 43.Bouhet S, Lafont V, Billard E, Gross A, Dornand J. The IFNγ-induced STAT1-CBP/P300 association, required for a normal response to the cytokine, is disrupted in Brucella-infected macrophages. Microb Pathog. 2009;46:88–97. doi: 10.1016/j.micpath.2008.10.011. [DOI] [PubMed] [Google Scholar]
- 44.Wojciak JM, Martinez-Yamout MA, Dyson HJ, Wright PE. Structural basis for recruitment of CBP/p300 coactivators by STAT1 and STAT2 transactivation domains. EMBO J. 2009;28:948–958. doi: 10.1038/emboj.2009.30. [DOI] [PMC free article] [PubMed] [Google Scholar]
- 45.Watling D, Guschin D, Muller M, Silvennoinen O, Witthuhn BA, Quelle FW, et al. Complementation by the protein tyrosine kinase JAK2 of a mutant cell line defective in the interferon-gamma signal transduction pathway. Nature. 1993;366:166–170. doi: 10.1038/366166a0. [DOI] [PubMed] [Google Scholar]
- 46.Stark GR, Darnell JE., Jr The JAK-STAT pathway at twenty. Immunity. 2012;36:503–514. doi: 10.1016/j.immuni.2012.03.013. [DOI] [PMC free article] [PubMed] [Google Scholar]
- 47.Kramer OH, Heinzel T. Phosphorylation-acetylation switch in the regulation of STAT1 signaling. Mol Cell Endocrinol. 2010;315:40–48. doi: 10.1016/j.mce.2009.10.007. [DOI] [PubMed] [Google Scholar]
- 48.Kramer OH, Knauer SK, Greiner G, Jandt E, Reichardt S, Guhrs KH, et al. A phosphorylation-acetylation switch regulates STAT1 signaling. Genes Dev. 2009;23:223–235. doi: 10.1101/gad.479209. [DOI] [PMC free article] [PubMed] [Google Scholar]
- 49.Antunes F, Marg A, Vinkemeier U. STAT1 signaling is not regulated by a phosphorylation-acetylation switch. Mol Cell Biol. 2011;31:3029–3037. doi: 10.1128/MCB.05300-11. [DOI] [PMC free article] [PubMed] [Google Scholar]
- 50.Xiong H, Du W, Zhang YJ, Hong J, Su WY, Tang JT, et al. Trichostatin A, a histone deacetylase inhibitor, suppresses JAK2/STAT3 signaling via inducing the promoter-associated histone acetylation of SOCS1 and SOCS3 in human colorectal cancer cells. Mol Carcinog. 2012;51:174–184. doi: 10.1002/mc.20777. [DOI] [PubMed] [Google Scholar]
- 51.Gao SM, Chen CQ, Wang LY, Hong LL, Wu JB, Dong PH, et al. Histone deacetylases inhibitor sodium butyrate inhibits JAK2/STAT signaling through upregulation of SOCS1 and SOCS3 mediated by HDAC8 inhibition in myeloproliferative neoplasms. Exp Hematol. 2013;41:261–270. doi: 10.1016/j.exphem.2012.10.012. [DOI] [PubMed] [Google Scholar]
- 52.Starr R, Willson TA, Viney EM, Murray LJ, Rayner JR, Jenkins BJ, et al. A family of cytokine-inducible inhibitors of signalling. Nature. 1997;387:917–921. doi: 10.1038/43206. [DOI] [PubMed] [Google Scholar]
- 53.Zhang L, Han Y, Jiang Q, Wang C, Chen X, Li X, et al. Trend of histone deacetylase inhibitors in cancer therapy: isoform selectivity or multitargeted strategy. Med Res Rev. 2015;35:63–84. doi: 10.1002/med.21320. [DOI] [PubMed] [Google Scholar]
- 54.Khabele D. The therapeutic potential of class I selective histone deacetylase inhibitors in ovarian cancer. Front Oncol. 2014;4:111. doi: 10.3389/fonc.2014.00111. [DOI] [PMC free article] [PubMed] [Google Scholar]
- 55.Boumber Y, Younes A, Garcia-Manero G. Mocetinostat (MGCD0103): a review of an isotype-specific histone deacetylase inhibitor. Expert Opin Investig Drugs. 2011;20:823–829. doi: 10.1517/13543784.2011.577737. [DOI] [PMC free article] [PubMed] [Google Scholar]
- 56.Son CH, Keum JH, Yang K, Nam J, Kim MJ, Kim SH, et al. Synergistic enhancement of NK cell-mediated cytotoxicity by combination of histone deacetylase inhibitor and ionizing radiation. Radiat Oncol. 2014;9:49. doi: 10.1186/1748-717X-9-49. [DOI] [PMC free article] [PubMed] [Google Scholar]
- 57.Rosborough BR, Castellaneta A, Natarajan S, Thomson AW, Turnquist HR. Histone deacetylase inhibition facilitates GM-CSF-mediated expansion of myeloid-derived suppressor cells in vitro and in vivo. J Leukoc Biol. 2012;91:701–709. doi: 10.1189/jlb.0311119. [DOI] [PMC free article] [PubMed] [Google Scholar]
- 58.Mazzone R, Zwergel C, Mai A, Valente S. Epi-drugs in combination with immunotherapy: a new avenue to improve anticancer efficacy. Clin Epigenetics. 2017;9:59. doi: 10.1186/s13148-017-0358-y. [DOI] [PMC free article] [PubMed] [Google Scholar]
Associated Data
This section collects any data citations, data availability statements, or supplementary materials included in this article.
Supplementary Materials
Figure S1. HDAC1–3 expression correlated B7-H1 expression in clinical gastric specimens. (A) B7-H1 and HDAC1–3 expression in 12 paired gastric cancer (C) and adjacent tissues (A) were determined by western blot. (B) After quantification and normalization, the expression change of HDAC1–3 and B7-H1 between each pair of cancer and adjacent tissue was presented. A, the experiment was repeated three times with similar results. (PDF 105 kb)
Data Availability Statement
All data generated or analyzed during this study are included in this published article.


