Abstract
Purpose
To develop a frailty index using the Rockwood Accumulation of Deficits approach for the Medicare Health Outcomes Survey (MHOS) and apply it in a subset of older patients with newly diagnosed multiple myeloma.
Methods
Data from 2,692,361 patients without cancer, > 66 years of age, in SEER-MHOS linked databases between 1998 and 2009 were analyzed. A frailty index was constructed, resulting in a 25-item scale; cutoff values were created for individuals classified as frail. This frailty index was then applied to 305 patients with newly diagnosed myeloma in the database to predict overall survival.
Results
In the derivation cohort of patients without cancer, the median age was 74 years and the mean frailty index was 0.23 (standard deviation, 0.17). Among patients without cancer, each 10% increase in frailty index (approximately three to four more deficits) was associated with a 40% increased risk for death (adjusted hazard ratio, 1.397; 95% CI, 1.396 to 1.399; P < .001). In the cohort of patients with newly diagnosed myeloma, the median age was 76 years and the mean frailty index was 0.28 (standard deviation, 0.17). Each 10% increase in frailty index was associated with a 16% increased risk for death (adjusted hazard ratio, 1.159; 95% CI, 1.080 to 1.244; P < .001). Fifty-three percent of patients with multiple myeloma were considered frail. The estimated median overall survival of patients considered frail was 26.8 months, compared with 43.7 months (P = .015) for those who were not.
Conclusion
The MHOS-based frailty index was prognostic for patients with multiple myeloma in predicting overall survival.
INTRODUCTION
Multiple myeloma (MM) is a neoplasm characterized by the clonal proliferation of malignant plasma cells within the bone marrow.1 It accounts for approximately 13% of all hematologic malignancies and 20% of hematologic malignancy–related deaths.2,3 In Western countries, the median age at diagnosis is 70 years, making MM a disease burden for older adults, with 35% to 40% of patients being older than 75 years.4
The introduction of novel therapeutic agents and better supportive care have improved the management of patients with MM, with a substantial benefit in both progression-free survival and overall survival (OS).5 Although there has been improvement in outcomes for older adults, several clinical trials and population-based registries demonstrate that this benefit has been less pronounced in the oldest subgroup of patients age ≥ 75 years,2,6,7 although that gap may be closing.8 The challenge in treating older patients is to accurately identify fit patients who can tolerate more aggressive regimens, providing maximal disease control, while simultaneously identifying frail patients who may develop toxicity with significant morbidity and mortality using those same regimens.
Multiple tools have been developed to help identify and stratify older patients with myeloma. The International Myeloma Working Group proposed a frailty index on the basis of chronological age plus three tools: Katz Activities of Daily Living, the Lawton Instrumental Activities of Daily Living, and the Charlson Comorbidity Index. Patients who were categorized as frail were more likely to experience grade 3 or 4 nonhematologic toxicity of therapy, early discontinuation of treatment, and a shorter OS.9 Another tool, the revised Myeloma Comorbidity Index, is also associated with OS and accounts for several prognostic factors, including chronological age, impaired lung and kidney function, the Karnofsky Performance Status, frailty, and unfavorable cytogenetics.10
Although both of the above tools provide prognostic information, chronological age automatically increases frailty without taking biologic or functional age into account. Rockwood and colleagues11 have proposed the concept of personal biologic age, where an individual’s health status can be quantified as a proportion of ageing-associated deficits that they have incurred. A frailty index on the basis of a deficit-accumulation principle (ie, using information from a substantial number of indicators of an individual’s health) can characterize age-related decline in health more efficiently than chronological age.12 In addition, a frailty index on the basis of the accumulation of deficits has now been shown to be a better predictor of adverse outcomes than chronological age and even some other indices of biologic age.13,14
A deficit-accumulation frailty index (DAFI) can be constructed retrospectively in a data set as long as it contains comprehensive information on a range of variables that can affect the health status of a patient. The items included to generate a DAFI are not fixed, and the particular combination of health deficits used does not affect its utility or applicability, because frailty is interpreted as a loss of redundancy in a complex system.15,16 Although DAFIs have been created and validated in many population cohorts and settings,17-20 it was recently validated in older patients with cancer receiving chemotherapy, where it predicted greater than or equal to grade 3 toxicity, drug discontinuation, and hospitalization, establishing its role in stratification of frailty in an oncology setting.21
In the current study, we used the Rockwood accumulation of deficit approach to develop a frailty index from data collected in the Medicare Health Outcomes Survey (MHOS) and the SEER-MHOS linked database. We then applied this DAFI to patients with newly diagnosed MM older than age 65 years. Our objective was to determine whether the frailty status determined by this index was associated with survival of older patients with MM.
METHODS
Data Source
The data source for this study was the SEER-MHOS linked database. The MHOS, implemented in 1998, annually collects self-reported symptoms, functional status, and health-related quality of life from Medicare beneficiaries who are enrolled in Medicare Advantage health plans. In the SEER-MHOS linked dataset, data from the MHOS are linked to demographics, tumor characteristics, and survival for those with a cancer diagnosis who reside in the coverage area of one of 14 registries participating in the SEER-MHOS linkage. This study was performed under a protocol approved by the Washington University School of Medicine Human Subject Committee.
Participants
At the time of analysis, the SEER-MHOS data release included all participants who completed the initial survey between 1998 and 2009. Subsequent follow-up surveys were available through 2011. All MHOS surveys from participants without a cancer diagnosis and the subset of those with a diagnosis of MM were requested through the SEER-MHOS program. The MHOS surveys have undergone four iterations since 1998, and all four versions were requested.
For this analysis, any survey completed by a participant younger than age 66 years was excluded. Medicare eligibility is required for MHOS participation, and although those younger than 65 years can meet Medicare eligibility for chronic conditions such as renal failure requiring dialysis, the health status of these patients likely does not reflect that of the general older population. In addition, because the health status of patients with MM varies as the disease progresses, only surveys completed within 1 year of MM diagnosis were included.
Development of the frailty index in SEER-MHOS data set of patients without cancer.
For the construction of the DAFI, we followed the standard procedure described by Mitnitski et al.15 Health deficits were included in the DAFI if they were biologically meaningful in representing organ dysfunction associated with chronic conditions, were prevalent in the study population, increase with age but are not universal in older age, and were available throughout all four survey versions used since its initiation in 1998.
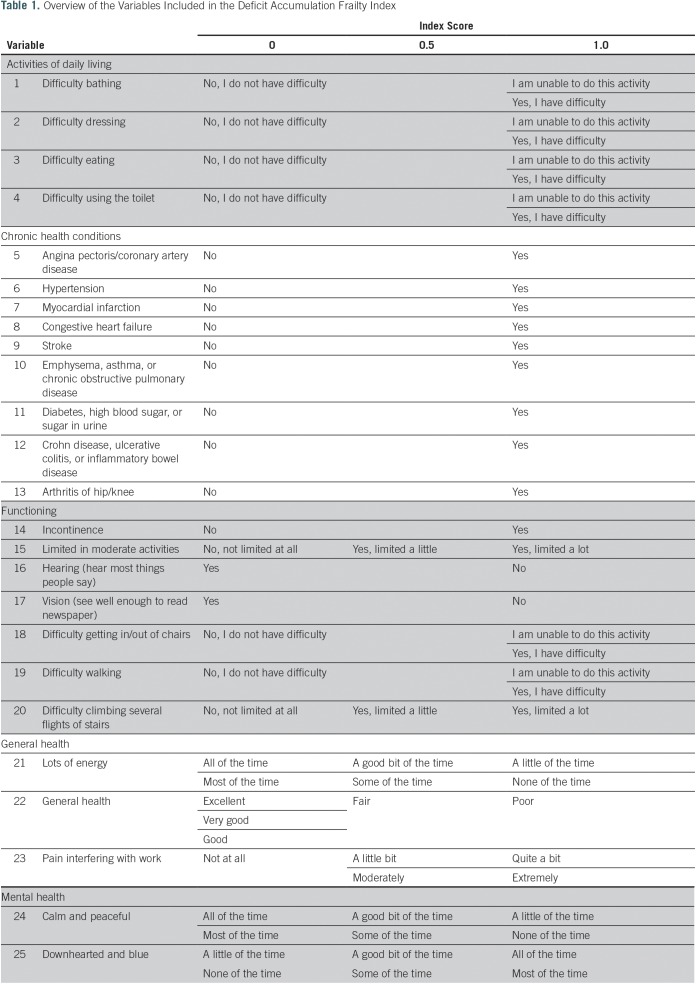
We screened all surveys conducted initially through the SEER-MHOS database. From 132 potential variables, 25 variables were selected on the basis of the above criteria for the creation of the DAFI. A list of excluded variables was screened by experts (the authors) for deficits unexpectedly omitted. The selected variables were from several domains, including activities of daily living, chronic health conditions, functioning, general health, and mental health. The 25 variables included in the final DAFI are detailed in Table 1. The levels of each variable were coded into a numeric score of 1 (present), 0.5 (limited), or 0 (absent). An individual participant’s overall DAFI score was calculated as the sum of all scores on the individual variables obtained by the participant divided by the total potential score on the basis of the number of variables with data entered (Fig 1). Potential DAFI score ranges from 0.0 to 1.0, where 0.0 corresponds to no frail deficits noted. The mean DAFI score was calculated for each year of chronological age from 66 to 110 years old.
Table 1.
Overview of the Variables Included in the Deficit Accumulation Frailty Index
Fig 1.
Calculation of the deficit accumulation frailty index is illustrated (score ranging from 0.0 to 1.0, with 0.0 being no deficits).
The correlation between the DAFI score and chronological age was analyzed using linear regression with age as an independent variable. Predicted DAFI means for each year of age were then calculated using the intercept and β coefficients. The predicted DAFI means were used to create binary cut points (individual’s score exceeds the mean or not relative to participants of the same chronological age) to determine if an individual participant was considered frail, relative to their peers. In other words, the same frailty score may qualify an 80-year-old individual as fit and a 70-year-old as frail, depending on the cutoff for their respective age group.
Application of DAFI in patients with MM.
All patients with newly diagnosed MM older than age 66 years who completed the MHOS survey within 1 year of their initial diagnosis were included. Demographic data were collected; however, there were no additional data available about disease characteristics, such as stage or cytogenetic risk factors. Frailty status for each participant was assigned using the calculated DAFI cutoff from the derivation cohort of patients without cancer in the SEER-MHOS database as outlined above.
For the myeloma population, descriptive statistics, including the mean DAFI and standard deviations (SDs), were calculated for the total study population, age groups, and by sex. Differences between men and women were determined using t statistics. To understand the relationship of the scores to age, the mean DAFI and frailty prevalence were reported for different age cohorts (age 66 to 70, 71 to 75, 76 to 80, and ≥ 81 years).
The association of frailty status and survival was analyzed using Kaplan-Meier curves and log-rank test. OS was defined as the time from survey to death. Univariable and multivariable Cox proportional hazards regression analysis was conducted to study the association between frailty and OS. Hazard ratios (HRs) and 95% CIs were reported for the total population, by age, sex, race, and frailty status. All analyses were performed using SAS Enterprise Guide 5.1.
RESULTS
Cohort of the SEER-MHOS Data Set Patients Without Cancer
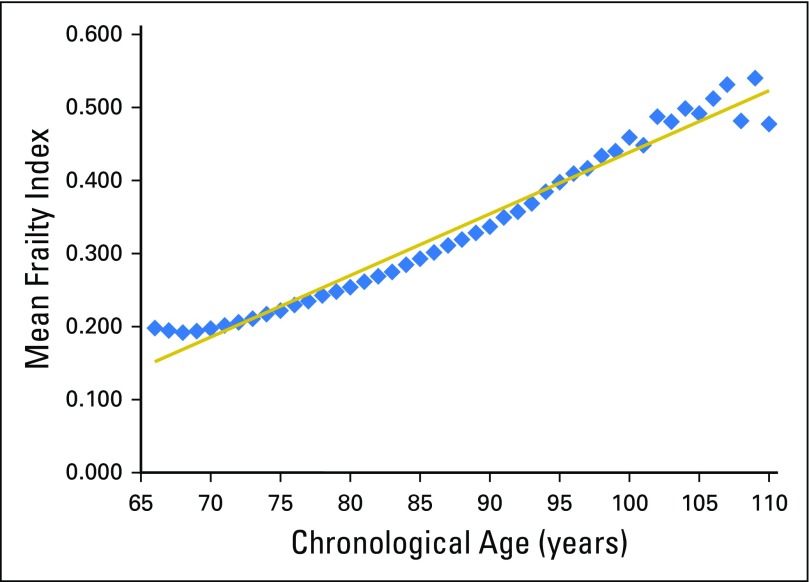
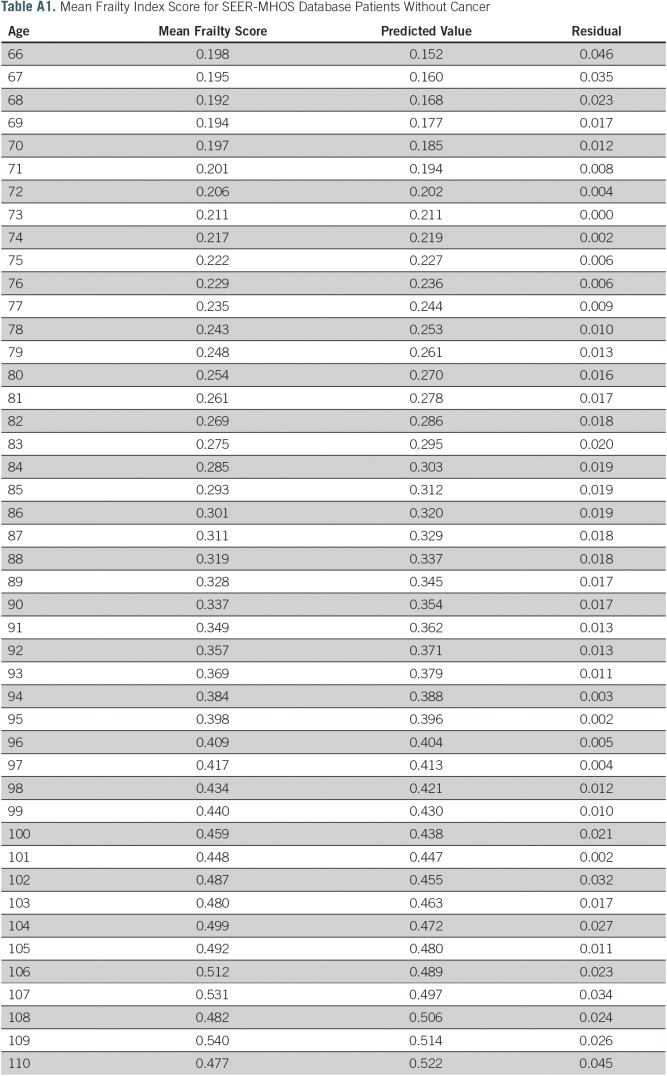
A total of 2,692,361 surveys from MHOS participants without cancer were included in the analysis. The median age was 74 years (range, 66 to 110 years) at time of survey, 60% were women, and 79% were white. The mean frailty score for this derivation cohort was 0.23 (SD, 0.17); however, scores ranged from 0.20 for age 66 years to 0.48 for age 110 years (Appendix Table A1). Mean frailty score was strongly correlated with chronological age (r2 = 0.98; P < .001; Fig 2). For each increase of 1 year, the average change in mean frailty index was +0.00843 (0.026 on a log scale), indicated by the average slope of the deficit accumulation. The index had a right-skewed distribution (skewness value, 0.91). Among patients without cancer, each 10% increase in frailty index (approximately three or four more deficits) was associated with a 40% increased risk for death (adjusted HR [aHR], 1.397; 95% CI, 1.397 to 1.399; P < .001).
Fig 2.
Mean frailty index score by chronologic age of the derivation Medicare Health Outcomes Survey cohort without cancer. Mean frailty score was strongly correlated with chronological age (r2 = 0.98; P < .001). The predicted mean frailty scores ranged from 0.15 for 66-year-olds to 0.52 for 110-year-olds (intercept = −0.40481; β coefficient = 0.00843 per year of age). The mean residual was 0.02.
Cohort of Patients With MM
We identified 1,889 MHOS surveys from 1,229 unique patients with MM in the SEER-MHOS data set from 1998 to 2011. Of these patients, 305 completed the questionnaire within 1 year of the myeloma diagnosis. The median age was 76 years. Seventeen percent of patients were between the ages of 66 and 70 years, 32% were age 71 to 75 years, 25% were age 76 to 80 years, and 26% were age ≥ 81 years at time of survey. In our cohort, 51% were men and 66% were white.
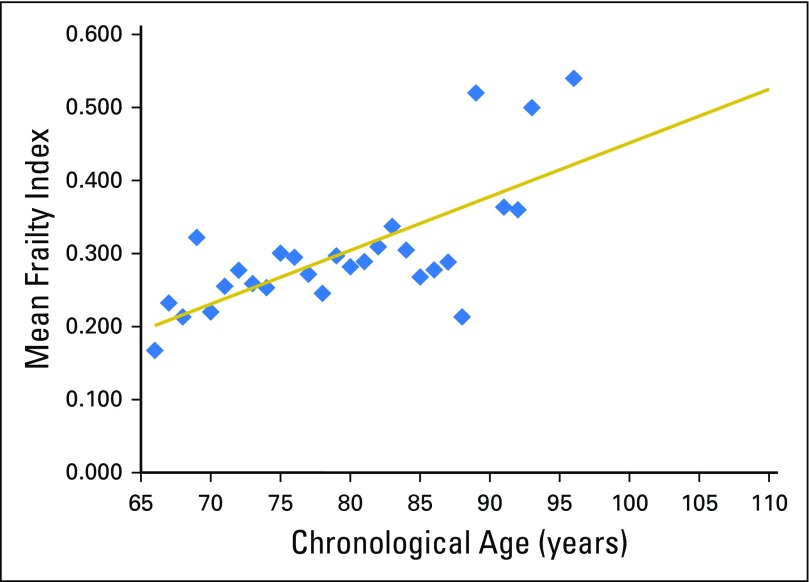
Table 2 shows the mean DAFI scores for the total MM population as well as the score stratified by sex and age group. The mean DAFI score was 0.28, with a median of 0.24 and a range from 0.0 to 0.94. Mean DAFI scores were higher in women (mean, 0.29; SD, 0.17) than in men (mean, 0.26; SD, 0.17), although the difference was not statistically significant (P = .239). Overall, 52% of the patients with myeloma were considered frail (DAFI greater than mean for age in the cohort without cancer), with 50% of men and 55% of women being considered frail (P = .445). Advancing chronological age was only weakly correlated with an increase in deficits (r2 = 0.15; P = .010; Appendix Fig A1). The mean DAFI increased from 0.24 in patients ≤ 70 years old to 0.31 for those ≥ 81 years, but because frail status was calculated respective to others of the same age, the rate of frail status was similar (P = .161).
Table 2.
Frailty Score and Status by Age and Sex for Patients With Multiple Myeloma
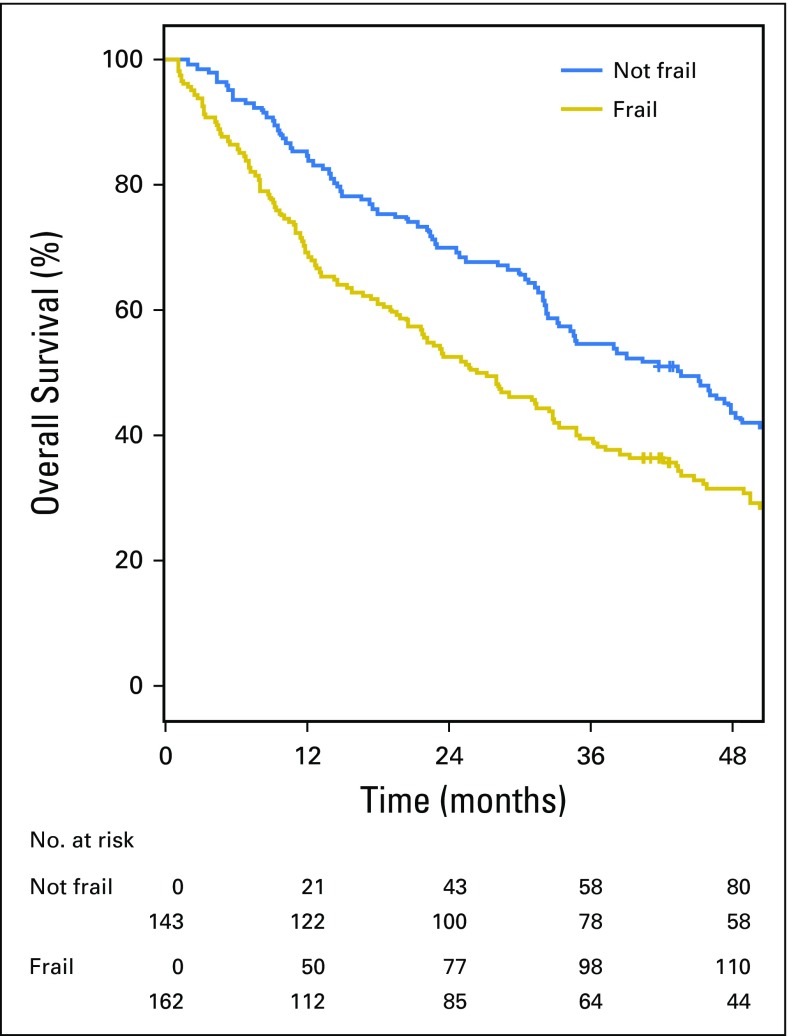
Eighty-three percent of the patients had died at the time of data cutoff. The median follow-up time for the myeloma cohort was 33 months (range, 1 to 196 months). The median OS was 33.0 months (95% CI, 29.1 to 39.0 months; Fig 3). The median OS of patients who were considered frail was 26.8 months (95% CI, 20.6 to 33.0 months) compared with the nonfrail cohort, where OS was 43.7 months (95% CI, 33.2 to 50.4 months; P = .015). Each 10% increase in the DAFI score was associated with a 16% increased risk of death (aHR, 1.16; 95% CI, 1.08 to 1.24; P < .001).
Fig 3.
Kaplan-Meier estimates for overall survival for patients with multiple myeloma according to frailty status as determined by the deficit accumulation approach (P = .015).
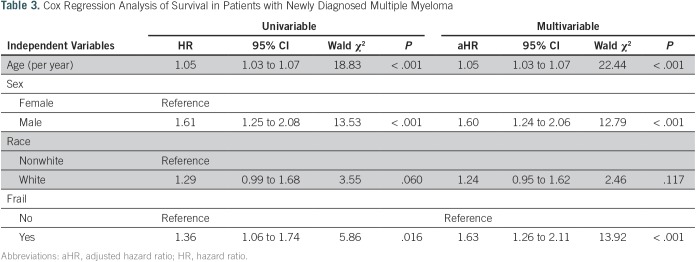
Table 3 shows the HRs for mortality (univariable and multivariable analysis for the total myeloma sample). Age, sex, and frail status were significantly associated with mortality. Race (white v nonwhite) was not significantly associated with mortality. In multivariable analysis, frail status was associated with a 63% increase in risk for death (aHR, 1.63; 95% CI, 1.33 to 2.22; P < .001).
Table 3.
Cox Regression Analysis of Survival in Patients with Newly Diagnosed Multiple Myeloma
DISCUSSION
MM is a disease of older patients, which will continue to increase in prevalence as the population ages. Although novel agents and better supportive care continue to significantly improve survival of older patients with MM, there remain significant challenges in decision making and care planning. There are multiple factors outside of the disease itself that influence the overall tolerability of treatment and long-term outcomes of patients. Increasingly, there is a need to understand these factors to personalize and optimize outcomes for this age cohort. To understand some of these factors, we have successfully constructed a DAFI from a cohort of patients without cancer and have related it to survival in older patients with newly diagnosed MM.
In our derivation cohort, patients without cancer older than 65 years of age were included, and a DAFI using 25 variables was constructed. In the general population, mean DAFI scores derived from similar methods but different data sources and populations vary widely. In a study of community-dwelling individuals age 15 to 103 years, the mean DAFI was 0.068,18 whereas in an acute care setting for individuals older than age 70 years, it is much higher at 0.32.19 In our cohort, the mean DAFI in the MHOS cohort of older adults was intermediate between these extremes at 0.23. Moreover, the average rate of deficit accumulation with age was 0.026 per year (log scale), which is comparable to the rate reported from seven population-based community dwelling samples across four developed countries (0.029 per year on a log scale).22
In our myeloma cohort, the mean DAFI calculated was 0.28, which was similar in both men and women. On the basis of the predicted cutoff, 53% of the individuals were considered frail. Comparatively, using the widely recognized International Myeloma Working Group (IMWG) frailty index (a measure derived from chronological age, functional status, and comorbidities, rather than an accumulation of deficits of phenotypic frailty approach), 30% of 869 clinical trial participants were considered frail.9 However, when the IMWG score was further validated in a community cohort, 48% of the individuals were considered frail.23 In this same cohort, the proportion of patients defined as frail ranged from 12% to 65% when other prognostic scores such as the Charlson Comorbidity Index, Hematopoietic Cell Transplantation Comorbidity Index, and the revised Myeloma Comorbidity Index were applied.23 Studies of other patients with solid organ cancer receiving chemotherapy demonstrate a rate of prefrailty and frailty of 39% and 11%, respectively.21 Overall, the variability in the proportion of individuals categorized as frail in both MM cohorts and other solid cancers reflects the variability in approaches to measuring frailty and determining at what cut point one is categorized as frail.
Although age is often a component of many prognostic scores in myeloma, in our calculation of DAFI, advancing chronological age was only weakly correlated with an increase in deficits and was not associated with an increased likelihood of being considered frail (r2 = 0.15; P = .010). This is in contrast to the cohort without cancer, where chronological age was strongly correlated with DAFI (r2 = 0.98; P < .001). This suggests that, in patients with MM, the prevalence of impairments across domains of function, chronic comorbidities, general health, and mental health are more related to the overall burden of myeloma rather than chronological age alone. This additional emphasizes the need to understand the personal biologic age of this cohort and the accumulating deficits for a given chronological age.
When the DAFI score was used to predict outcomes, frailty was associated with survival. As expected, patients with higher DAFI scores had a shorter survival, and the median OS of frail patients in our cohort was 26.8 months. In comparison, the IMWG frailty score showed an OS ranging between 47% and 57% at 3 years for frail patients when tested in different population settings.23 Similarly, other predictive scores also show a range of OS depending on their definition and cutoff for frailty, ranging between 20% and 62% at 3 years.23
In our myeloma cohort, the status of frailty retained a significant association with overall survival even after controlling for chronological age, emphasizing the difference between chronological and biologic age. Male sex was associated with decreased OS, consistent with previous studies done in older patients.24,25
Limitations of our study include that we only report overall survival and do not report other important outcomes, such as progression-free survival, chemotherapy toxicity, or hospitalization rates. Data on disease-related prognostic risk factors, such as cytogenetics, myeloma stage, and treatment data, are not available in this SEER-MHOS data set, precluding their incorporation in the model. This may have led to the DAFI being more prognostic among the derivation cohort of patients without cancer than among patients with MM, as other disease-related factors affect OS in MM. In addition, another limitation may be the generalizability of our population cohort, because it was derived from patients enrolled in the Medicare Advantage program. Some have argued that enrollment of lower-cost enrollees was incentivized in Medicare Advantage. This may have contributed to selecting participants that are overall lower risk,26 potentially resulting in a lower burden of frailty found in our study than in an unselected population of older adults.
Nevertheless, the DAFI derived from older patients without cancer seems to have clinical applicability, because it provides a summary measure of the vulnerabilities of older individuals as a result of decrease in several domains.27 It also reflects, more importantly, the concept of personal biologic age rather than a fixed chronological age, which will automatically lead to a frail status in myeloma on the basis of some widely used predictive scoring systems.9,10 Because our DAFI created for this study is on the basis of a nationally representative sample of older adults in the United States, the score has the potential to be applied in other studies, in other patient groups and outcomes. Although this DAFI is based on 25 variables in the MHOS data set, the variables selected are easily attainable during most clinical assessments. An online computerized program may further enhance the usability of this score, allowing clinicians to calculate it in real time during patient visits. Additional exploration and validation of our derived DAFI with other population cohorts of patients with MM and in prospective trials will be needed to fully understand and establish its role in optimizing clinical care of older patients.
ACKNOWLEDGMENT
We thank the Applied Research Program, National Cancer Institute; the Office of Research, Development and Information, Centers for Medicare & Medicaid Services; Information Management Services; and the SEER program tumor registries in the creation of the SEER-Medicare Health Outcomes Survey database.
Appendix
Fig A1.
Mean frailty index score by chronologic age of the multiple myeloma cohort. Mean frailty score was only weakly correlated with chronological age (r2 0.15; P < .010). Trend line as shown is the predicted mean frailty scores derived from the non-cancer cohort.
Table A1.
Mean Frailty Index Score for SEER-MHOS Database Patients Without Cancer
Footnotes
Supported by National Cancer Institute Grant No. K12CA167540. The Center for Administrative Data Research is supported in part by the Washington University Institute of Clinical and Translational Sciences Grant No. UL1 TR000448 from the National Center for Advancing Translational Sciences, Agency for Healthcare Research and Quality Grant No. R24 HS19455, and National Cancer Institute Grant No. KM1CA156708.
Presented at the American Society of Clinical Oncology Meeting 2017, Chicago, IL, June 2-6, 2017.
The contents of this study are solely the responsibility of the authors and do not necessarily represent the official view of National Center for Research Resources or the National Institutes of Health. This study used the linked SEER-Medicare Health Outcomes Survey database. The interpretation and reporting of these data are the sole responsibility of the authors.
AUTHOR CONTRIBUTIONS
Conception and design: All authors
Financial support: Tanya M. Wildes
Provision of study material or patients: Tanya M. Wildes, Mark A. Fiala
Collection and assembly of data: Hira S. Mian, Mark A. Fiala
Data analysis and interpretation: Hira S. Mian, Mark A. Fiala
Manuscript writing: All authors
Final approval of manuscript: All authors
Accountable for all aspects of the work: All authors
AUTHORS' DISCLOSURES OF POTENTIAL CONFLICTS OF INTEREST
The following represents disclosure information provided by authors of this manuscript. All relationships are considered compensated. Relationships are self-held unless noted. I = Immediate Family Member, Inst = My Institution. Relationships may not relate to the subject matter of this manuscript. For more information about ASCO's conflict of interest policy, please refer to www.asco.org/rwc or ascopubs.org/jco/site/ifc.
Hira S. Mian
Honoraria: Celgene, Janssen
Consulting or Advisory Role: Amgen, Takeda
Tanya M. Wildes
Honoraria: Carevive Systems
Research Funding: Janssen Oncology (Inst)
Mark A. Fiala
No relationship to disclose
REFERENCES
- 1.Swerdlow SH, Campo E, Harris NL, et al. WHO Classification of Tumours of Haematopoietic and Lymphoid Tissues. Lyon, France: IARC Press; 2008. [Google Scholar]
- 2.Pozzi S, Marcheselli L, Bari A, et al. Survival of multiple myeloma patients in the era of novel therapies confirms the improvement in patients younger than 75 years: A population-based analysis. Br J Haematol. 2013;163:40–46. doi: 10.1111/bjh.12465. [DOI] [PubMed] [Google Scholar]
- 3.Palumbo A, Anderson K. Multiple myeloma. N Engl J Med. 2011;364:1046–1060. doi: 10.1056/NEJMra1011442. [DOI] [PubMed] [Google Scholar]
- 4.Palumbo A, Bringhen S, Ludwig H, et al. Personalized therapy in multiple myeloma according to patient age and vulnerability: A report of the European Myeloma Network (EMN) Blood. 2011;118:4519–4529. doi: 10.1182/blood-2011-06-358812. [DOI] [PubMed] [Google Scholar]
- 5.Kumar SK, Rajkumar SV, Dispenzieri A, et al. Improved survival in multiple myeloma and the impact of novel therapies. Blood. 2008;111:2516–2520. doi: 10.1182/blood-2007-10-116129. [DOI] [PMC free article] [PubMed] [Google Scholar]
- 6.Hulin C, Belch A, Shustik C, et al. Updated outcomes and impact of age with lenalidomide and low-dose dexamethasone or melphalan, prednisone, and thalidomide in the randomized, phase III FIRST trial. J Clin Oncol. 2016;34:3609–3617. doi: 10.1200/JCO.2016.66.7295. [DOI] [PubMed] [Google Scholar]
- 7.Mateos MV, Oriol A, Martínez-López J, et al. Bortezomib, melphalan, and prednisone versus bortezomib, thalidomide, and prednisone as induction therapy followed by maintenance treatment with bortezomib and thalidomide versus bortezomib and prednisone in elderly patients with untreated multiple myeloma: A randomised trial. Lancet Oncol. 2010;11:934–941. doi: 10.1016/S1470-2045(10)70187-X. [DOI] [PubMed] [Google Scholar]
- 8.Kumar SK, Dispenzieri A, Lacy MQ, et al. Continued improvement in survival in multiple myeloma: Changes in early mortality and outcomes in older patients. Leukemia. 2014;28:1122–1128. doi: 10.1038/leu.2013.313. [DOI] [PMC free article] [PubMed] [Google Scholar]
- 9.Palumbo A, Bringhen S, Mateos MV, et al. Geriatric assessment predicts survival and toxicities in elderly myeloma patients: An International Myeloma Working Group report. Blood. 2015;125:2068–2074. doi: 10.1182/blood-2014-12-615187. [DOI] [PMC free article] [PubMed] [Google Scholar]
- 10.Engelhardt M, Domm AS, Dold SM, et al. A concise revised Myeloma Comorbidity Index as a valid prognostic instrument in a large cohort of 801 multiple myeloma patients. Haematologica. 2017;102:910–921. doi: 10.3324/haematol.2016.162693. [DOI] [PMC free article] [PubMed] [Google Scholar]
- 11.Mitnitski AB, Mogilner AJ, Rockwood K. Accumulation of deficits as a proxy measure of aging. Sci World J. 2001;1:323–336. doi: 10.1100/tsw.2001.58. [DOI] [PMC free article] [PubMed] [Google Scholar]
- 12.Kulminski A, Yashin A, Arbeev K, et al. Cumulative index of health disorders as an indicator of aging-associated processes in the elderly: Results from analyses of the National Long Term Care Survey. Mech Ageing Dev. 2007;128:250–258. doi: 10.1016/j.mad.2006.12.004. [DOI] [PMC free article] [PubMed] [Google Scholar]
- 13.Romero-Ortuno R, Kenny RA. The frailty index in Europeans: Association with age and mortality. Age Ageing. 2012;41:684–689. doi: 10.1093/ageing/afs051. [DOI] [PMC free article] [PubMed] [Google Scholar]
- 14.Mitnitski A, Howlett SE, Rockwood K. Heterogeneity of human aging and its assessment. J Gerontol A Biol Sci Med Sci. 2017;72:877–884. doi: 10.1093/gerona/glw089. [DOI] [PMC free article] [PubMed] [Google Scholar]
- 15.Mitnitski AB, Graham JE, Mogilner AJ, et al. Frailty, fitness and late-life mortality in relation to chronological and biological age. BMC Geriatr. 2002;2:1. doi: 10.1186/1471-2318-2-1. [DOI] [PMC free article] [PubMed] [Google Scholar]
- 16.Searle SD, Mitnitski A, Gahbauer EA, et al. A standard procedure for creating a frailty index. BMC Geriatr. 2008;8:24. doi: 10.1186/1471-2318-8-24. [DOI] [PMC free article] [PubMed] [Google Scholar]
- 17.McKenzie K, Ouellette-Kuntz H, Martin L. Using an accumulation of deficits approach to measure frailty in a population of home care users with intellectual and developmental disabilities: An analytical descriptive study. BMC Geriatr. 2015;15:170. doi: 10.1186/s12877-015-0170-5. [DOI] [PMC free article] [PubMed] [Google Scholar]
- 18.Rockwood K, Song X, Mitnitski A. Changes in relative fitness and frailty across the adult lifespan: Evidence from the Canadian National Population Health Survey. CMAJ. 2011;183:E487–E494. doi: 10.1503/cmaj.101271. [DOI] [PMC free article] [PubMed] [Google Scholar]
- 19.Hubbard RE, Peel NM, Samanta M, et al. Derivation of a frailty index from the interRAI acute care instrument. BMC Geriatr. 2015;15:27. doi: 10.1186/s12877-015-0026-z. [DOI] [PMC free article] [PubMed] [Google Scholar]
- 20.Schoufour JD, Mitnitski A, Rockwood K, et al. Development of a frailty index for older people with intellectual disabilities: Results from the HA-ID study. Res Dev Disabil. 2013;34:1541–1555. doi: 10.1016/j.ridd.2013.01.029. [DOI] [PubMed] [Google Scholar]
- 21.Cohen HJ, Smith D, Sun CL, et al. Frailty as determined by a comprehensive geriatric assessment-derived deficit-accumulation index in older patients with cancer who receive chemotherapy. Cancer. 2016;122:3865–3872. doi: 10.1002/cncr.30269. [DOI] [PMC free article] [PubMed] [Google Scholar]
- 22.Rockwood K, Mitnitski A. Frailty in relation to the accumulation of deficits. J Gerontol A Biol Sci Med Sci. 2007;62:722–727. doi: 10.1093/gerona/62.7.722. [DOI] [PubMed] [Google Scholar]
- 23.Engelhardt M, Dold SM, Ihorst G, et al. Geriatric assessment in multiple myeloma patients: Validation of the International Myeloma Working Group (IMWG) score and comparison with other common comorbidity scores. Haematologica. 2016;101:1110–1119. doi: 10.3324/haematol.2016.148189. [DOI] [PMC free article] [PubMed] [Google Scholar]
- 24.Waxman AJ, Mink PJ, Devesa SS, et al. Racial disparities in incidence and outcome in multiple myeloma: A population-based study. Blood. 2010;116:5501–5506. doi: 10.1182/blood-2010-07-298760. [DOI] [PMC free article] [PubMed] [Google Scholar]
- 25.Hoogendijk EO, Theou O, Rockwood K, et al. Development and validation of a frailty index in the Longitudinal Aging Study Amsterdam. Aging Clin Exp Res. 2017;29:927–933. doi: 10.1007/s40520-016-0689-0. [DOI] [PMC free article] [PubMed] [Google Scholar]
- 26.Brown J, Duggan M, Kuziemko I, et al. How does risk selection respond to risk adjustment? New evidence from the Medicare Advantage Program. Am Econ Rev. 2014;104:3335–3364. doi: 10.1257/aer.104.10.3335. [DOI] [PubMed] [Google Scholar]
- 27.Clegg A, Young J, Iliffe S, et al. Frailty in elderly people. Lancet. 2013;381:752–762. doi: 10.1016/S0140-6736(12)62167-9. [DOI] [PMC free article] [PubMed] [Google Scholar]


