Abstract
Liver regeneration after injury occurs in many mammals. Rat liver regenerates after partial hepatectomy over a period of 2 weeks while human liver regeneration takes several months. Notwithstanding this enormous difference in time-scales, with new data from five human live liver transplant donors, we show that a mathematical model of rat liver regeneration can be transferred to human, with all biochemical interactions and signaling unchanged. Only six phenomenological parameters need change, and three of these parameter changes are rescalings of rate constants by the ratio of human lifespan to rat lifespan. Data from three donor subjects with approximately equal resections were used to fit the three parameters and the data from the other two donor subjects was used to independently verify the fit.
Animal model research is primarily conducted in the hope, often fond, of translational impact on human health (Ioannidis, 2012). Indeed, relationships between dynamic functional networks in different species based on their phylogenetic similarity are implied by evolution, inarguably the unifying principle of biology. It is noteworthy that careful analyses of the reliability of most extrapolations from animal models to human exclude mechanistic studies (Ioannidis, 2012), but in any event there are few extant examples of the inter-species extrapolation of mechanistic dynamic models of complex processes. Clearly the appropriate processes to model, with a view to understanding phylogenetic extrapolation in this context, are those that are central to survival in many species and yet are complex enough that a mathematical model provides some insight.
A particularly interesting example is liver regeneration (Fausto, 2001; Fausto et al., 2006; Michalopoulos, 2007; Michalopoulos, 2010). Liver mass recovery after a partial hepatectomy or other insult is a robust homeostatic response to injury that is a paradigmatic example of rapid and controlled cell proliferation in adult mammals. The control of this process is via a complex, highly redundant, network of interactions (Moolten and Bucher, 1967; Ishii et al., 1995; Webber et al., 1998; Rozga, 2002) that has very few absolutely essential factors, and therefore can manage regeneration even when most factors are singly deleted. Liver is a critical organ for human health, and liver transplants have a long history (Francavilla et al., 1988; Strong et al., 1990). Understanding the correct mechanism and timing of liver regeneration after major liver resection or after live liver donation has a very important clinical implication. In fact, liver failure is a life threatening complication of liver resection.
In earlier work, we developed a mathematical model of rat liver regeneration (Furchtgott et al., 2009) that incorporates the main aspects of the signaling involved and reproduces known phenomenology. In brief, our present model of liver regeneration in rat is based on the concept of a metabolic load per hepatocyte. As liver mass recovery after a hepatectomy is more accurately characterized as controlled hyperplasia rather than regeneration, spatial patterning cues do not play a major role, and to a first approximation we model this proliferation as a spatially homogeneous process. However, the regeneration of hepatocytes after a toxic insult is not homogeneous and the cell orientation and polarity during regeneration have been modeled (Hohme et al., 2007). Liver resection leads to an increase in this metabolic load, as fewer hepatocytes are available to carry out their requisite functions. In our model, this increase in metabolic load per hepatocyte in turn drives the expression of cytokines and growth factors (GFs) that initiate the extracellular matrix (ECM) degradation and cell proliferation that ultimately lead to liver mass recovery. Immediate early response genes, such as insulin-like GF-binding protein 1, insulin induced gene 1, IL-1 receptor, and p2l, are activated in a signaling cascade through STAT3 that drives quiescent hepatocytes to the primed state. GFs then act on primed cells to enable proliferation. The proliferation is brought to an end when the proliferation of hepatocytes has reduced the metabolic load per hepatocyte sufficiently, allowing the ECM to reform, rendering proliferating cells quiescent. This basic set of biochemical processes is depicted in Figure 1. Each process modeled is regarded as a collection of redundant signaling pathways, not simply as the activity of a single cytokine or GF.
Fig. 1.
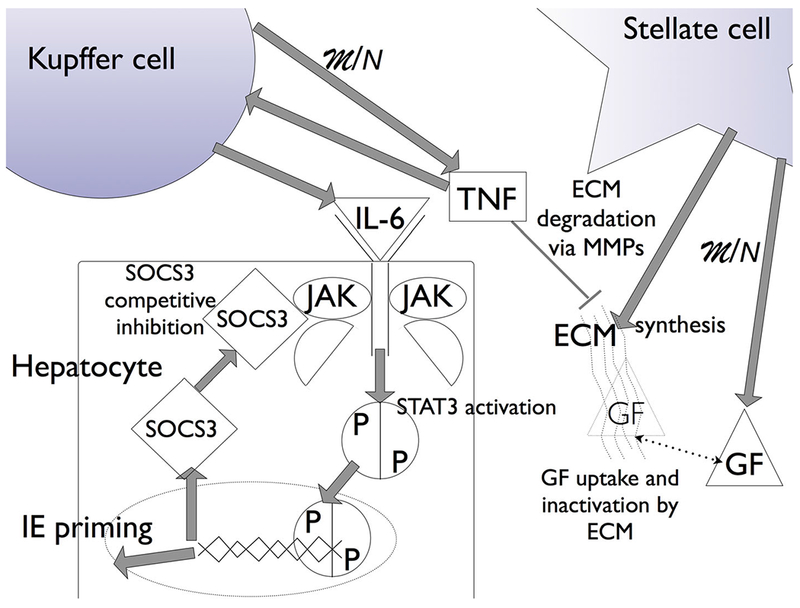
Liver regeneration biochemistry in the model. The increase in metabolic load (M) due to a reduction in hepatocyte number (N) drives hepatocyte growth factor (GF) expression and tumor necrosis factor (TNF) expression, from stellate and Kupffer cells, respectively. TNF initiates the degradation of the ECM via matrix metalloproteinases (MMPs) and the expression of cytokines (IL-6) that initiate janus kinase (JAK) signaling through STAT3 activation. STAT3 translocation into the nucleus leads to the expression of suppressor of cytokine signaling 3 (SOCS3), and the expression of immediate early genes (IE) that signal quiescent hepatocytes to enter a primed state. The competitive binding of SOCS3 to JAK leads to suppression of STAT3 signaling, providing an activating pulse. GF drives primed cells to a proliferating state. As the metabolic load decreases due to the increase in hepatocyte number, TNF concentration decreases and the ECM reforms, and GF uptake by the ECM leads to a cessation in primed cells moving to proliferation. The ECM reforming also drives proliferating cells to quiescence, bringing liver regeneration to a halt.
The capacity of hepatocytes to function normally while they proliferate is a central feature of the rat model. The proliferative potential of rat hepatocytes is undiminished by the increase in metabolic load per hepatocyte due to the resection. While the biochemistry was modeled with rate constants mostly obtained from the literature (Furchtgott et al., 2009), a few phenomenological parameters governing the rate of progression through the cell cycle, Figure 2, were determined by a fit to known qualitative observations in the literature for rat liver regeneration.
Fig. 2.
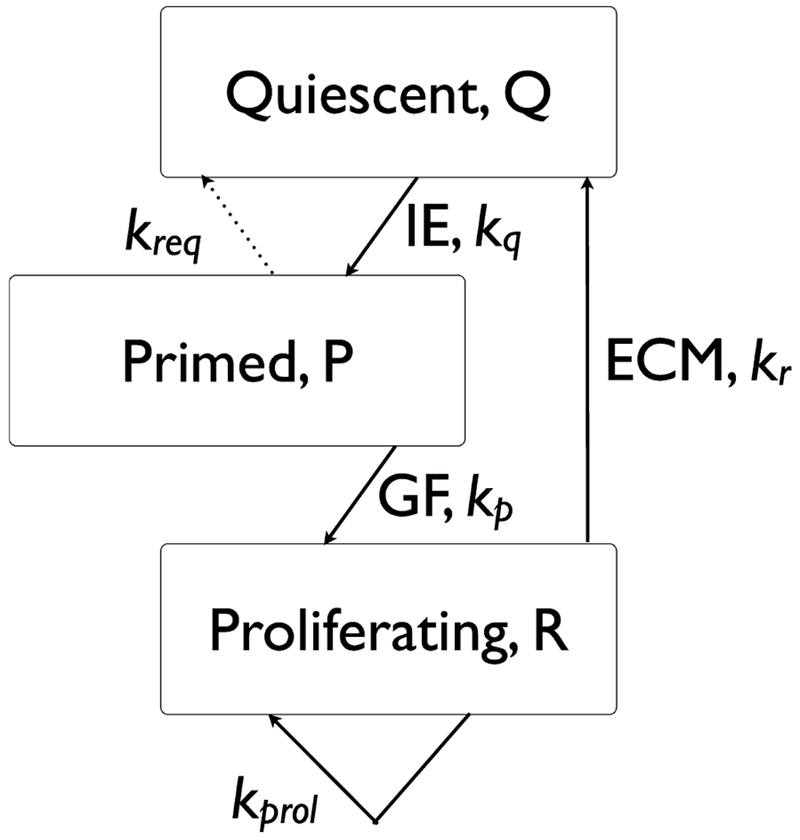
Liver regeneration cell cycle. The total fraction of cells (relative to the original cell number prior to donation) is N = Q + P + R. As noted, the priming step for Quiescent (Q) cells depends on the expression of immediate early genes (IE) and the progression from primed (P) to proliferating (R) depends on growth factors (GF). The cessation of proliferation depends on the reappearance of the extracellular matrix (ECM).
As noted above, cell cycle progression is independent of the resected fraction of liver in rat, which is incorporated into the model as the resection independence of the rate constants (proliferation rate kprol, requiescence rate kreq, primed-to-proliferating rate kp, priming rate kq, and quiescence rate kr) indicated in Figure 2. For larger resections, the response of certain cytokines and GFs is stronger, and this leads to a quicker recovery than for smaller resections, but the rates governing progression through the cell cycle are independent of the resection, and depend only on the concentrations of relevant cytokines and GFs. This leads to the well-known phenomenon that recovery of liver mass for a large resection is quicker than the recovery from a smaller resection, though of course these observations apply to specific fractions that are dictated by the relative sizes of the lobes that can be resected.
Liver regeneration in human is considerably slower than in rat, scaling approximately the same as the ratio of lifespans in the two species, by a factor of about 20. Is this due to changes in the signaling biochemistry or can it be explained in terms of changes in cell cycle parameters? Is there a fundamental difference in hepatocyte cell cycle control in the two species? This is the specific question we address. From our larger perspective of predictive extrapolation from animal models, we shall show how the availability of a mathematical model for a process in one species sheds light on the possible key differentiating characteristics of the same process in another species.
Materials and Methods
Subject selection
Upon approval by the Institutional Review Board of Thomas Jefferson University (TJU), we retrospectively collected and shared data between two Institutions on five consecutive live donor liver transplant pairs (donor and recipient). Donors and recipients underwent complete pre-operative work-up as per our protocol, currently in place at TJU, and were found to be suitable candidate for live liver donation and transplant. The donor group was composed of four female and one male; whereas the recipient group counted three males and two females. The mean age in the recipient group was 46, and 32 in the donor. Four out of five donors donated the right lobe of the liver, and one the left.
Imaging
Pre-operatively the donor’s work-up included a 3-D CTA of the abdomen and pelvis with calculation of the total liver volume and the volumes of the right and the left lobe of the liver. The calculation was obtained with volumetric software consisting in drawing a line in the actual CT imaging on the surface of the right and the left lobe of the liver. The area identified was then elaborated and transformed into volume. Two-millimeter thick × 1 mm overlapping axial images are created from the portal venous phase (to facilitate identification of venous structures). The images are loaded into a dedicated workstation (Extended Brilliance workspace V3.5.0.2254, Koninklijke Philips Electronics N.V., Eindhoven, The Netherlands). The margin of the entire liver is identified and traced using axial, sagittal and coronal images, and the selected region is colorized and confirmed by the CT technologist to be an appropriate selection. Then, the workstation calculates the volume of the colorized areas and the volume in cubic centimeters is displayed and an image made and recorded. The margin of each segment or lobe is marked and colorized in a similar manner to create volumes of the right and left lobes or specific segments as required. Each volume is recorded for review by the surgeon.
Surgical procedure
The donor and the recipient operation was carried on in the usual fashion as previously described (Strong et al., 1990).
Modeling
The rat model consists of two interacting modules, the molecular interactions and the phenomenological cell cycle. The molecular interactions are described in Figure 1 and the equations are as follows:
All parameters in the model are described in detail in Furchtgott et al. (2009). The rat phenomenological cell cycle module (Fig. 2) is driven by concentrations of immediate early genes ([IE]) and [GF] as follows:
The human model has the same molecular module as the rat model. The changes in the human phenomenological cell cycle module relative to the rat model are detailed in Table 1.
TABLE 1.
Parameter changes from rat to human
| Parameter | Rat | Change in human | Human | Rat parameters/24 |
|---|---|---|---|---|
| kreq | 0.1 | kreq | 0.00417 | 0.00417 |
| kprol | 0.02 | kprol | 0.00833 | 0.00833 |
| kapop | 0.1 | kapop | 0.00417 | 0.00417 |
| kr | 0.054 | kr | 0.00618 | 0.00225 |
| kq | 0.0070 | kq | 0.000877 | 0.000292 |
| kp | 0.0044 | kp | 0.00891 | 0.000183 |
Parameters are described in detail in Furchtgott et al. (2009). The phenomenological parameters kprol, kreq, and kapop are the rates of proliferation, requiescence, and apoptosis, respectively. These three parameters were not fit, merely adjusted by a factor of 24 to account for the difference in lifespan between rats and humans. Phenomenological parameters kr, kq, and kp are the rates of progression out of the proliferating, quiescent and primed cell states. These three parameters with fit using data from subjects 1, 3, and 5. Values adjusted from rats (Rat Parameters/24) are given for comparison for both all human parameters.
The mathematical analysis was carried out using Matlab (Mathworks, Natick, MA).
Results
Liver volume recovery
All five donors showed liver mass recovery as ascertained by CT scans and volumetric analysis as shown in Table 2.
TABLE 2.
Liver donor pre- and post-operative data
| Donor Subject# | Pre-operative total liver volume (cm3) | Remaining fraction of liver post-operation | Lobe removed | Days post-operation | CT liver volume days post-operation (cm3) | Fraction of original liver volume |
|---|---|---|---|---|---|---|
| 1 | 1399.9 | 0.387 | Right | 87 | 1071.5 | 0.765 |
| 2 | 1728.3 | 0.308 | Right | 83 | 1089.2 | 0.630 |
| 3 | 1420.8 | 0.374 | Right | 83 | 1153.5 | 0.812 |
| 4 | 1815.2 | 0.641 | Left | 81 | 1533 | 0.845 |
| 5 | 1335 | 0.353 | Right | 83 | 1303.9 | 0.977 |
Liver volume fraction of donor subjects before hepatectomy, fraction of original liver volume remaining, and CT measured liver volume approximately 80 days post-hepatectomy.
Modification of rat liver regeneration model
We reasoned that the process of liver regeneration is common to many mammals so changes in the rat liver regeneration model to make it predictive of human liver regeneration are likely to be phenomenological parameters that embody multiple signaling pathways. These parameters are indicated in Figure 2. The altered parameter values are shown in Table 1. Only three parameters were fit to donor subjects 1, 3, and 5 which had approximately the same resection, leaving 37% of the initial liver volume on average. These parameters were kp, kq, and kr, and they were fit using the least squares Levenberg–Marquardt algorithm. Subjects 2 and 4 were not used in adjusting the parameters and acted as “independent” data against which to validate the fitted data. The other phenomenological parameters, kprol and kreq were rescaled by dividing them by 24. We also note that the apoptosis rate, kapop = 0.1, in the rat model is not a critical parameter because the rat liver regenerates so quickly. In human, kapop needs to be much smaller because the rate of recovery is much slower. We also rescaled kapop by dividing by 24 to reduce it appropriately. With these modifications to the rat model, we could fit the human data and predict time courses for cytokines, GFs and the fractions of cells in quiescent, primed, or proliferating states.
Early phase of cytokine and GF dynamics
As shown in Figure 1, the metabolic load (M) per hepatocyte drives expression of tumor necrosis factor (TNF) and GFs. Figures 3–5 show model predictions for cytokines, GFs and IE genes during the first 10 h post-resection. Concentrations are in units such that the equilibrium concentration in quiescent hepatocytes is 1. All the predictions are derived from parameter values that lead to matching the data in Table 2.
Fig. 3.
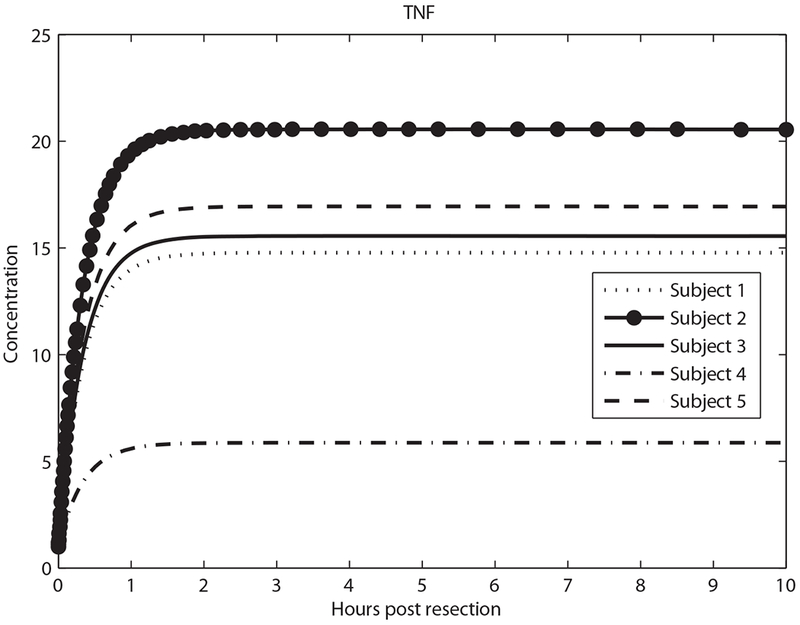
Predicted tumor necrosis factor (TNF) concentration in the first 10 h.
Fig. 5.
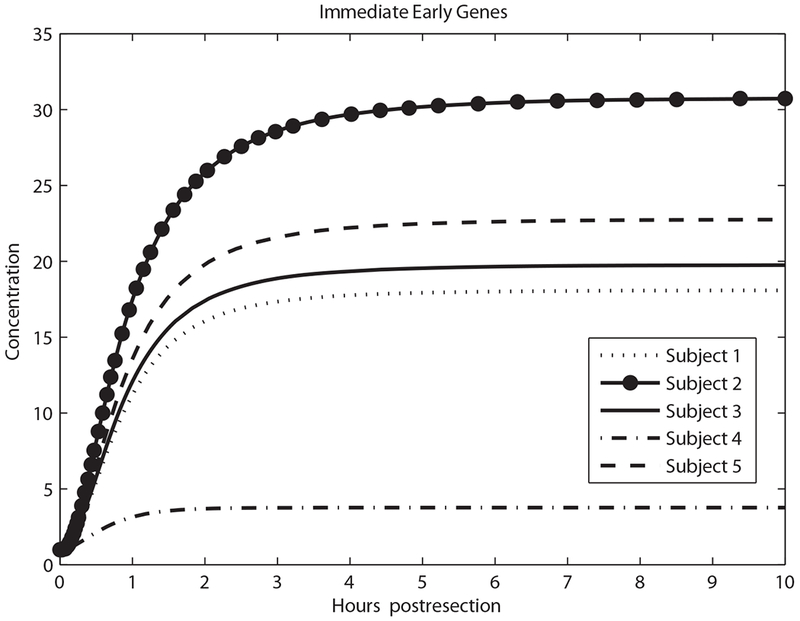
Predicted immediate early genes concentration in the first 10 h.
Early quiescent, primed, and proliferating fraction dynamics
Driven by changes in cytokines and GFs, quiescent hepatocytes progress to primed and proliferating states, shown in Figures 6 and 7. Figure 7 shows the smallest fraction of proliferating cells for Subject 4 who had the smallest resection, and the largest fraction in Subject 2 (the largest resection).
Fig. 6.
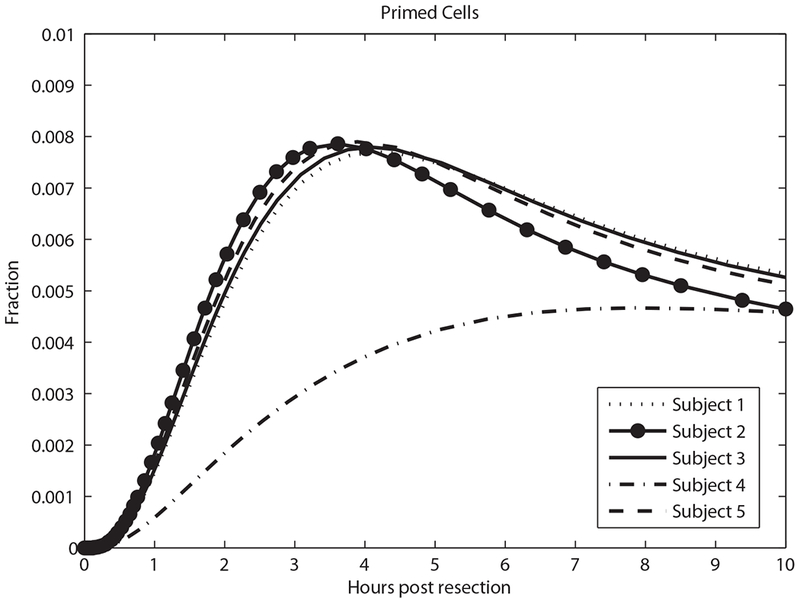
Predicted primed cell fraction in the first 10 h.
Fig. 7.
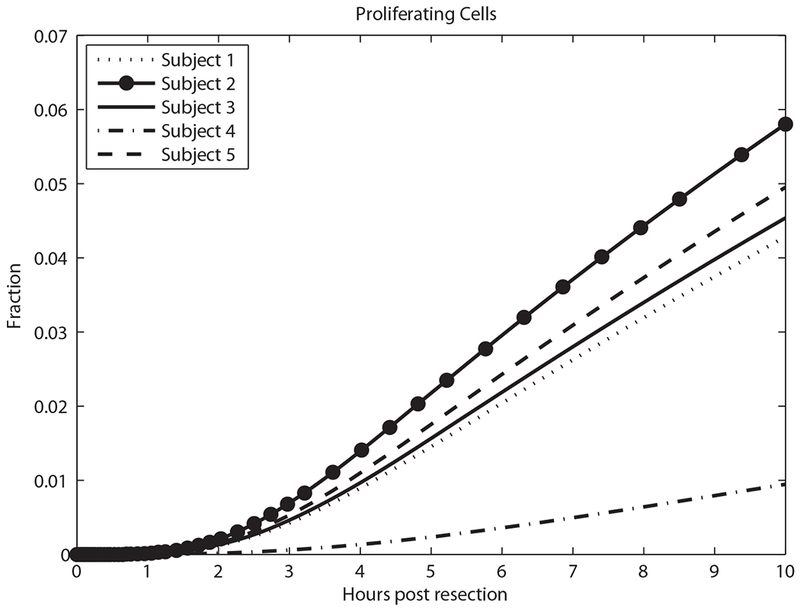
Predicted proliferating cell fraction in the first 10 h.
Liver mass dynamics
The predicted recovery of liver mass closely parallels the reformation of the ECM (data not shown), as expected from Figure 2. Figure 8 shows a comparison between predicted and measured liver volumes.
Fig. 8.
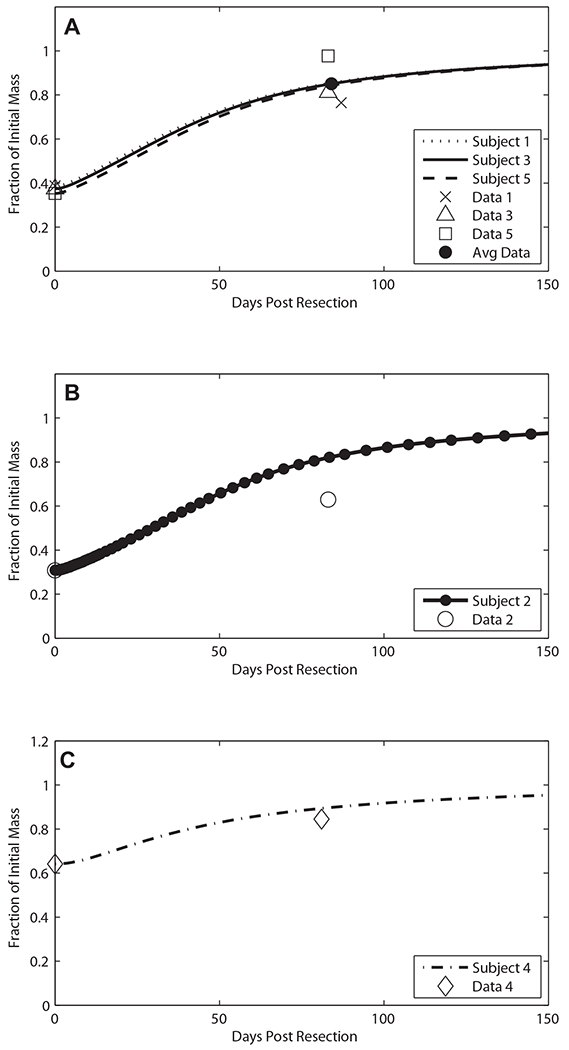
Predicted donor liver mass recovery compared to CT volumetric data. Subjects with similar resections (approx. 63% hepatectomy) were used in fitting the three parameters kr, kq, and kp. (A) The individual resections are graphed in comparison to the individual donors’ data. Donor subjects 2 (B) and 4 (C) were not used in fitting and acted as independent tests of the model after fitting.
Discussion
The regeneration of rat liver after a partial hepatectomy is a rapid process and takes place over a period of weeks. In human, live donor recovery data show that liver mass recovery takes about a year. The difference in time scale is striking, and it is difficult to see how the biochemical signaling pathways controlling regeneration could be the same in rat and human. Nevertheless, we found that no change in biochemical signaling was necessary to transfer the rat regeneration model to human. However, an important qualitative change appears to be necessary in the rat liver model to fit human live donor liver regeneration data: the human model requires that the cell cycle in human hepatocytes is slowed compared to the rat model by a ratio approximately the ratio of the lifespan of the two species.
We recognize several important limitations to the model presented. The model is based on the hypothesis that metabolic load drives liver regeneration. This is only one hypothesis among many for liver regeneration. Though we present predictions for chemokines and GFs, in this retrospective pilot study we did not have data on these, nor on proteins that might affect recovery, such asfollistatin oractivin, which have been shown to affect liver regeneration in rats (Endo et al., 2006). Future studies might investigate the concentrations of these molecules to better model the liver regeneration. Our model only takes into consideration the donor, and not the recipient. There are factors such as age which affect the risks and complications, at least in a size dependent resection (Dayangac et al., 2011). We do not consider age given the few subjects we had, nor do we consider gender or ethnicity. Yet even without these additional parameters, we were able to translate a rat model to human data. We recognize that the model was developed from only five subjects. We deliberately chose to fit the three parameters using three patients with similar initial remaining liver volumes of about 37%. The other three parameters were adapted to account for the approximate ratio of the lifespan of humans and rats. The two subjects (subjects 2 and 4) that we did not use to develop the model had different initial liver volumes of 30% and 64% after transplantation. While the resulting fit is not perfect and there was not enough data to provide significant statistical tests with the “independent” subjects, it is worth noting that these two separate subjects were the ones used as test cases to investigate if the fitted model could predict recovery, which it did. This suggests that given more data the model could prove to be a novel and accurate predictor of minimal liver mass needed by the live donor to prevent liver failure after surgery.
The model can serve as a good predictor for estimating the time to recovery in the donors in live liver transplants. Different liver volume measuring techniques, including 2D-CT, 3D-CT, or Harada et al.’s (2004) equation, have their associated uncertainties. Our dynamic model can translate the volume uncertainty from these techniques to a temporal uncertainty in the range of days for the liver to attain a specified percentage of its original volume. Table 3 demonstrates how the aforementioned liver volume measuring techniques and their associated errors (Harada et al., 2004) can lead to different ranges of days post-resection to reach 75% of the original total liver volume after 65% of the liver has been removed. In addition, our model predicts cytokine interactions and their effects on the liver remnant during post-resection regeneration. It is conceivable that a direct modulation of these cytokines during the most critical time of liver regeneration, which can be predicted with our model (data not shown), might favor regeneration and avoid liver failure, liver dialysis, liver transplantation and/or mortality following major liver resections.
TABLE 3.
Comparison of predicted donor recovery to 75% total liver volume for 65% hepatectomy across three measuring techniques: 2D-CT, 3D-CT, and Harada et al.’s (2004) equation
| Measurement method | Error ratio (%) | Range of donor’s liver volume fraction remaining post-operation | Donor time to reach 75% of original liver volume |
|---|---|---|---|
| 2D-CT | 16.3 | 0.2929–0.4070 | 56–70 |
| 3D-CT | 13.5 | 0.3027–0.3972 | 56–68 |
| Harada’s equation | 10.8 | 0.3122–0.3878 | 55–67 |
The remaining fraction of the recipient donor was considered to be 0.35 and was increased or decreased depending on the technique. The reported error ratios in the actual liver volume transplanted are 16.3%, 13.5%, and 10.8% for 2D-CT, 3D-CT, and Harada et al.’s equation, respectively (Harada et al., 2004). The mean time for a ”perfect” measurement was computed with the fraction of 0.35 and was found to be approximately 50 days. A range of days for liver volume to reach 75% of its original volume where the starting fraction was computed by fractioninitial = 0.35 ± 0.35 × (error ratio).
The larger point that we make here is the direct, predictive, and transparent extrapolation of a model developed in one species to a model adapted to another species, which may be unexpected in light of common perceptions (Ioannidis, 2012). Our example provides a concrete route for effecting such a transfer, showing that this extrapolation is possible with changes that are transparent and understandable. We suggest that the mechanisms that are likely to be modified are the effective processes summarizing sets of signaling events. An important aspect of the process we have modeled is its near universality in mammals. This ubiquity may be a reason for the success of model extrapolation in this example.
A limitation of our results is that we developed this transfer of the rat model with five human subjects. Additional human data, particularly with measurements of circulating cytokines and GFs during recovery, and with a few more intermediate time points during liver mass recovery, would lead to a refined model with more predictive value. We must also take into account the error in the measurement of the post-operative liver volumes considering the fact reported liver volumes may be different from actual liver volumes by a factor of 13% using 3D-CT techniques (Harada etal., 2004). We did not attempt to fit recipient data because the dysfunctions that led to transplants and post-operative immune system suppression make recipient data more heterogeneous. Therefore, modeling recipient liver mass requires many subjects.
Our model was not intended to be descriptive of every factor and cytokine present in the process of liver regeneration. Indeed, its simplicity is the reason for its utility. A model incorporating more variables would be overly complex given the available data, and would have a low likelihood in a Bayesian model selection analysis. While the development of mathematical models for animal data is not trivial, the payoff for translational medicine in human is potentially enormous.
Fig. 4.
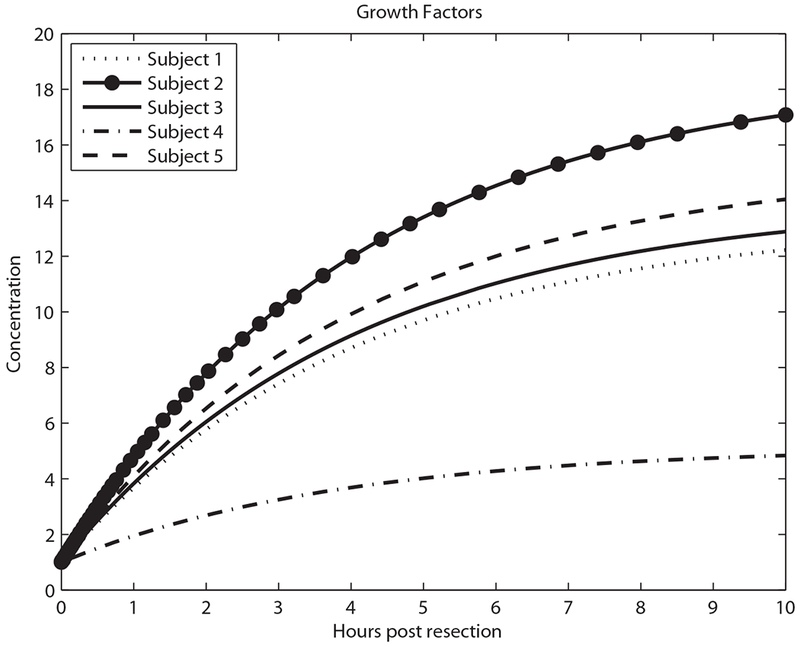
Predicted growth factor concentration in the first 10 h.
Acknowledgments
We would like to thank Jan Hoek and Carson Chow for helpful discussions. This work was supported in part by the Intramural Research Program of the National Institutes of Health, NIDDK.
Contract grant sponsor: National Institutes of Health, NIDDK.
Abbreviations:
- GF
growth factor
- TNF
tumor necrosis factor
- ECM
extracellular matrix
- MMPs
matrix metalloproteinases
- JAK
janus kinase
- SOCS3
suppressor of cytokine signaling
- IE
immediate early genes
Footnotes
The authors of this manuscript have no conflicts of interest to disclose.
Literature Cited
- Dayangac M, Taner CB, Yaprak O, Demirbas T, Balci D, Duran C, Yuzer Y, Tokat Y. 2011. Utilization of elderly donors in living donor liver transplantation: When more is less? Liver Transpl 17:548–555. [DOI] [PubMed] [Google Scholar]
- Endo D, Maku-Uchi M, Kojima I. 2006. Activin or follistatin: Which is more beneficial to support liver regeneration after massive hepatectomy? Endocr J 53:73–78. [DOI] [PubMed] [Google Scholar]
- Fausto N 2001. Liver regeneration: From laboratory to clinic. Liver Transpl 7:835–844. [DOI] [PubMed] [Google Scholar]
- Fausto N, Campbell JS, Riehle KJ. 2006. Liver regeneration. Hepatology 43:S45–S53. [DOI] [PubMed] [Google Scholar]
- Francavilla A, Ove P, Polimeno L, Coetzee M, Makowka L, Barone M, Van Thiel DH, Starzl TE. 1988. Regulation of liver size and regeneration: Importance in liver transplantation. Transplant Proc 20:494–497. [PMC free article] [PubMed] [Google Scholar]
- Furchtgott LA, Chow CC, Periwal V. 2009. A model of liver regeneration. Biophys J 96:3926–3935. [DOI] [PMC free article] [PubMed] [Google Scholar]
- Harada N, Shimada M, Yoshizumi T, Suehiro T, Soejima Y, Maehara Y. 2004. A simple and accurate formula to estimate left hepatic graft volume in living-donor adult liver transplantation. Transplantation 77:1571–1575. [DOI] [PubMed] [Google Scholar]
- Hohme S, Hengstler JG, Brulport M, Schafer M, Bauer A, Gebhardt R, Drasdo D. 2007. Mathematical modeling of liver regeneration after intoxication with CCl4. Chem Biol Interact 168:74–93. [DOI] [PubMed] [Google Scholar]
- Ioannidis JP. 2012. Extrapolating from animals to humans. Sci Transl Med 4:ps15. [DOI] [PubMed] [Google Scholar]
- Ishii T, Sato M, Sudo K, Suzuki M, Nakai H, Hishida T, Niwa T, Umezu K, Yuassa S. 1995. Hepatocyte growth factor stimulates liver regeneration and elevates blood protein level in normal and partial hepatectomized rats. J Biochem 117:1105–1112. [DOI] [PubMed] [Google Scholar]
- Michalopoulos GK. 2007. Liver regeneration. J Cell Physiol 213:286–300. [DOI] [PMC free article] [PubMed] [Google Scholar]
- Michalopoulos GK. 2010. Liver regeneration after partial hepatectomy: Critical analysis of mechanistic dilemmas. Am J Pathol 176:2–12. [DOI] [PMC free article] [PubMed] [Google Scholar]
- Moolten FL, Bucher NLR. 1967. Regeneration of rat liver: Transfer of humoral agent by cross circulation. Science 158:272–274. [DOI] [PubMed] [Google Scholar]
- Rozga J 2002. Hepatocyte proliferation in health and in liver failure. Med Sci Monit 8:RA32–RA38. [PubMed] [Google Scholar]
- Strong RW, Lynch SV, Ong TH, Masunami H, Koido Y, Balderson GA. 1990. Successful liver transplantation from a living donor to her son. N Engl J Med 322:1505–1507. [DOI] [PubMed] [Google Scholar]
- Webber EM, Bruix J, Pierce RH, Fausto N. 1998. Tumor necrosis factor primes hepatocytes for DNA replication in the rat. Hepatology 28:1226–1234. [DOI] [PubMed] [Google Scholar]


