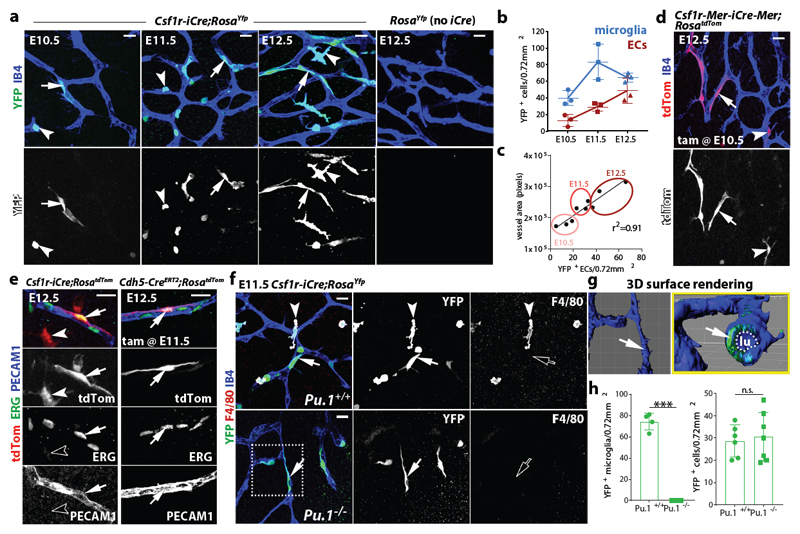
Fig. 1. Csf1r-iCre lineage tracing identifies ECs in developing brain vasculature.
(a-c) Csf1r-iCre;RosaYfp hindbrains of the indicated gestational stages. (a) Wholemount labelling for YFP and IB4; (b) YFP+ IB4+ single cells (microglia) and YFP+ IB4+ vessel-bound cells (putative ECs) per 0.72 mm2, mean ± SD; (c) positive correlation between YFP+ putative EC number and vessel area (r2, coefficient of determination; goodness of fit, P < 0.01); each data point represents one hindbrain, n = 3 hindbrains for each group.
(d,e) E12.5 hindbrains of the indicated genotypes, wholemount labelled with the indicated markers and shown including tdTom fluorescence; Csf1r-Mer-iCre-Mer;RosatdTom (d) was tamoxifen-induced on E10.5 and Cdh5-CreERT2;RosatdTom (e) on E11.5; n = 3 hindbrains for each genotype.
(f-h) Csf1r-iCre;RosaYfp E11.5 hindbrains on a Pu.1+/+ versus Pu.1-/- background, labelled for YFP and F4/80 together with IB4. The boxed area in (f) was 3D surface rendered and is shown in (g) en face and as a lateral view starting at the plane indicated by the yellow line; the vascular lumen (lu) is outlined. (h) YFP+ microglia (Pu.1+/+ n = 4; Pu.1-/- n = 3) and ECs (Pu.1+/+ n = 6; Pu.1-/- n = 7), mean ± SD; each data point represents one hindbrain; n.s., non-significant; ***P < 0.0001 (two-tailed unpaired t-test).
Symbols: Microglia and ECs are indicated with arrowheads and arrows, respectively. Solid and clear symbols indicate the presence or absence of marker expression, respectively.
Scale bars: 20 µm (a,d,f), 50 µm (e).

