Abstract
We used diffusion tensor magnetic resonance imaging (DTI) to reveal the extent of genetic effects on brain fiber microstructure, based on tensor-derived measures, in 22 pairs of monozygotic (MZ) twins and 23 pairs of dizygotic (DZ) twins (90 scans). After Log-Euclidean denoising to remove rank-deficient tensors, DTI volumes were fluidly registered by high-dimensional mapping of co-registered MP-RAGE scans to a geometrically-centered mean neuroanatomical template. After tensor reorientation using the strain of the 3D fluid transformation, we computed two widely-used scalar measures of fiber integrity: the fractional anisotropy (FA), and geodesic anisotropy (GA), which measures the geodesic distance between tensors in the symmetric positive-definite tensor manifold. Spatial maps of intraclass correlations (r) between MZ and DZ twins were compared to compute maps of Falconer’s heritability statistics, i.e. the proportion of population variance explainable by genetic differences among individuals. Cumulative distribution plots (CDF) of effect sizes showed that the manifold measure, GA, marginally outperformed the Euclidean measure, FA, in detecting genetic correlations. While maps were relatively noisy, the CDFs showed promise for detecting genetic influences on brain fiber integrity as the current sample expands.
1. INTRODUCTION
Diffusion tensor (DT) MR images can measure water diffusion in tissue, providing vital information on fiber connectivity and composition in the healthy and diseased brain. Simple scalar measures, derived from the diffusion tensor, such as the trace or mean diffusivity, can adequately describe isotropic water diffusion, which only occurs in brain regions such as the cerebrospinal fluid. In the white matter, myelinated fibers resist diffusion orthogonal to the local dominant fiber orientation, and diffusion occurs preferentially along local fiber tracts. In clinical research, white matter fiber integrity is commonly assessed by determining how strongly diffusion is directionally constrained. Of the directional diffusion measures, fractional anisotropy (FA), computed from the DT eigenvalues, and is widely used in neuroscientific studies. FA is generally reduced in diseases that affect fiber integrity (e.g., Alzheimer’s disease), and may be used to map disease effects on white matter. A related scalar measure, the Geodesic Anisotropy (GA) [3], has recently been developed as an alternative to FA. GA measures the distance of a diffusion tensor to the nearest isotropic tensor, computed intrinsically on the manifold of positive-definite symmetric diffusion tensors. Here we used maps of FA versus GA to characterize microstructural differences and similarities in a DTI database from 90 healthy young adult twins.
While variations in DTI signals across subjects are the subject of intensive investigation, there is a need to discover which fiber characteristics are genetically influenced, and ultimately which genes influence fiber integrity. A first step in this quest is to determine (1) which DTI measures are genetically influenced; and (2) what is the relative proportion of genetic versus environmental control over fiber characteristics in different brain regions. Both of these questions can be answered, in principle, using DTI scans of twins. A practical benefit of knowing where DTI signals are genetically controlled is to determine the added power of a discordance design to isolate disease-specific features, in which patients are compared with healthy family members, rather than with unrelated control subjects. To our knowledge, only one study [9] has examined genetic influences on DTI, and found that the proportion of genetic and environmental control varied regionally, for the fractional anisotropy of the corpus callosum. Here we extended this approach to create initial steps towards 3D maps of genetic influences on DTI signals, evaluating which measures, FA or GA, gives greater effect size for detecting genetic influences. The answer to this question depends on (1) empirical factors such as the noise in each channel of the matrix-valued signals, and (2) mathematical factors such as the correct combination of the tensor components using statistics on associated Lie groups such as the symmetric tensor manifold. Both FA and GA have been proposed as fiber integrity measures in clinical studies, so it is valuable to know how much genetic factors determine the normal population variability in these measures.
Twin studies using conventional MRI [9,10] have found that several aspects of brain morphometry are under strong genetic control, including cortical thickness and regional gray and white matter volumes. To our knowledge, no 3D maps have been published that visualize genetic influences on diffusion profiles or fiber anisotropy using DTI.
Here we use DTI-derived maps of FA and GA to compute maps of the intraclass correlation (r) of MZ and DZ twins at each voxel. This enables us to assess genetic effects on white matter microstructure, from the correlations in different types of twins, visualizing the profile of genetic influences in 3D.
2. METHODS
2.1. Subject description and image acquisition
3D structural brain MRI scans and DT-MRI scans were acquired from 90 subjects: 22 pairs of monozygotic twins (MZ; 20 males/24 females; 25.1±1.5SD years old) and 23 pairs of dizygotic twins (DZ; all same-sex pairs; 20 males/26 females; 23.5±2.2 years) on a 4T Bruker Medspec MRI scanner with an optimized diffusion tensor sequence [4]. Imaging parameters were: 21 axial slices (5 mm thick), FOV = 23 cm, TR/TE 6090/91.7 ms, 0.5 mm gap, with a 128×100 acquisition matrix. 30 directional gradients were applied: three scans with no diffusion sensitization (i.e., T2-weighted images) and 27 diffusion-weighted images for which gradient directions were evenly distributed on the hemisphere [7]. The reconstruction matrix was 128×128, yielding a 1.8×1.8 mm2 in-plane resolution. Total scan time was 3.05 minutes.
2.2. Image Preprocessing and Registration
3D structural MR images were automatically skull-stripped using the Brain Surface Extraction software (BSE) [10] followed by manual editing. The masked image was registered via 9-parameter linear transformation to a high resolution single-subject brain template image, the Colin27 template, using the FLIRT software [6]. A Minimal Deformation Target (MDT) image was generated from the 90 subjects using nonlinear registration, and each 3D structural image was warped to the MDT using a 3D fluid registration that allows large-deformation diffeomorphic mappings [4,8]. Jacobian matrices were obtained from the resulting deformation fields.
Diffusion Tensors (3×3 positive symmetric matrices) were computed from DICOM DT-MR images and smoothed using Log-Euclidean tensor denoising to eliminate singular, negative definite, or rank-deficient tensors, using MedINRIA (http://www.sop.inria.fr/asclepios/software/MedINRIA). The To eliminate extracerebral tissues, a diagonal component image (Dxx) was manually stripped of nonbrain tissues, yielding a binary brain extraction mask (cerebellum included). Masked images were registered by 9-parameter transformation to the corresponding 3D structural images in the standard template space using FLIRT software [6].
2.3. Handling orientation information
Transformation parameters from affine and nonlinear registrations were used to rotationally reorient the tensors at each voxel [1] to ensure that the multidimensional tensor orientations remained consistent with the anatomy after image transformation [1,11]. Two separate methods were used to compute the tensor rotations. First, the finite Strain (FS) method was applied using the transformation matrix M resulting from the affine registration. A preservation of principal direction (PPD) algorithm was then applied to the higher-order transformation, as in [1] and [12].
More precisely, to find the rotational component Rr, of the affine transformation, we used
| (1) |
Reorientation components for the nonlinear transformation (Rn) were computed using the Jacobian matrix (J) from the fluid registration step for the MP-RAGE MR images. The principal orientation of the primary (e1) and secondary (e2) eigenvectors were computed from the DT images, as in [2]:
| (2) |
2.4. Scalar statistics in the Log-Euclidean space
Positive definite Diffusion Tensors do not form a vector space under the usual operations of matrix addition and scalar multiplication. Figure 1 illustrates the ‘Log-Euclidean framework’ [2], which has been proposed to simplify computations for positive definite tensor statistics. In this framework, the tensor manifold is projected to its tangent plane at the origin, where standard vector space statistics can be used [2, 8]. A typical measure of diffusion anisotropy is the fractional anisotropy (FA),
| (3) |
with . FA, however, is an extrinsic measure on the manifold of symmetric positive definite tensors. Geodesic anisotropy (GA) is derived from the tensor manifold metric [3]. Here, we used GA computed in the Log-Euclidean metric [8] as an alternative scalar measure to compare with FA. GA, in our work, is defined as:
| (4) |
With .
Figure 1.
(a) shows the diffusion tensor at one voxel, represented using an ellipsoidal shape; colors denote distances of boundary points to the origin, indicating relative rates of diffusion in each direction. The ellipsoid’s axes indicate the 3 orthogonal eigenvectors, whose length is given by the corresponding eigenvalues. Positive definite symmetric tensors [ellipses in (b)] lie in a non-linear manifold in R6. Because symmetric, positive definite matrices are constrained to have positive eigenvalues, not all values in R6 can be used to generate their 6 independent components. The allowable sets of components form a curved connected submanifold of R6. The green curve (b) indicates the geodesic distance between tensors in this manifold, and the olive colored dotted line shows the Euclidean distance between tensors. The dotted line is not a correct measure of the distance between tensors as it does not lie in the manifold. The bottom panel (b) illustrates tensors in the Log-Euclidean framework, where the symmetric positive definite matrices of the DT form a vector space. Different groups of tensors (here represented in different colors) may then be statistically compared using multivariate tests or with univariate tests on geodesic distance measures [11], [6].
FA is based on a simple comparison of the tensor eigenvalues. GA, however, measures the deviation of the tensor from the “nearest” isotropic tensor in the associated Log-Euclidean metric. GA may be seen as the geodesic distance on the tangent plane at the origin of the tensor manifold. Figure 1 illustrates the difference between the geodesic (intrinsic) distance (green solid line on the manifold) and the Euclidean (extrinsic) distance (olive colored dotted line). We renormalized GA by applying the hyperbolic tangent transformation to the GA values (tGA) as in [3], to create maps with a comparable range to the FA.
2.5. Statistical analysis of structural models for twins
Voxelwise FA and GA values were computed for all 90 fluidly registered tensor images. The intraclass correlation (r) can be used to quantify similarity in paired data, such as the twin data here. Intraclass correlations for the MZ group (rMZ) and for the DZ group (rDZ) were computed at each voxel for both FA and GA. To compute the proportion of the variance in the FA (and GA) values attributable to genetic differences among individuals, we used a measure known as Falconer’s heritability estimate [5]:
| (5) |
This parameter, which is expected to vary across brain regions and for different DTI measures, allows inferences to be made about how much of the population variance is attributable to genetic factors, as opposed to that due to environmental factors (e.g., nutrition, in utero environment) and measurement errors or inter-subject registration errors.
3. RESULTS
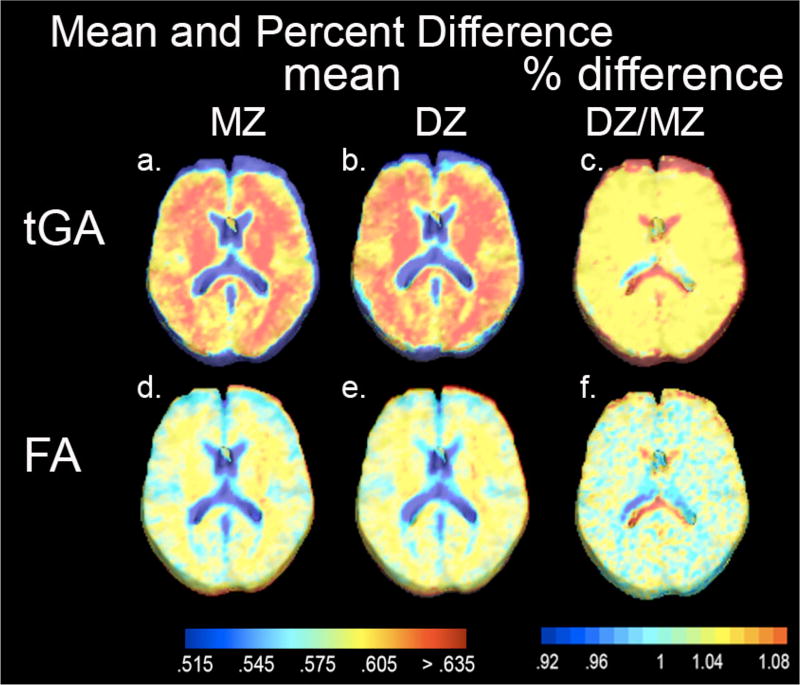
Figure 2 shows mean maps of FA and tGA maps for all 44 MZ subjects and for all 46 DZ subjects. The ratio of the DZ to MZ group means (DZ/MZ) for each scalar measure was close to 1. As is necessary in twin studies, the mean values for these parameters was very similar within groups of different zygosities.
Figure 2.
(a) shows mean tGA images for all 44 MZ twins and (b) for all 46 DZ twins. (d) and (e) show mean FA image for twins of each zygosity. (c) and (f) show the ratio of the mean values for each measure, between DZ and MZ groups. Mean values for each zygosity are within a few percent of each other, as is required in a twin study (which relies on correlations within each group; Fig. 3,4).
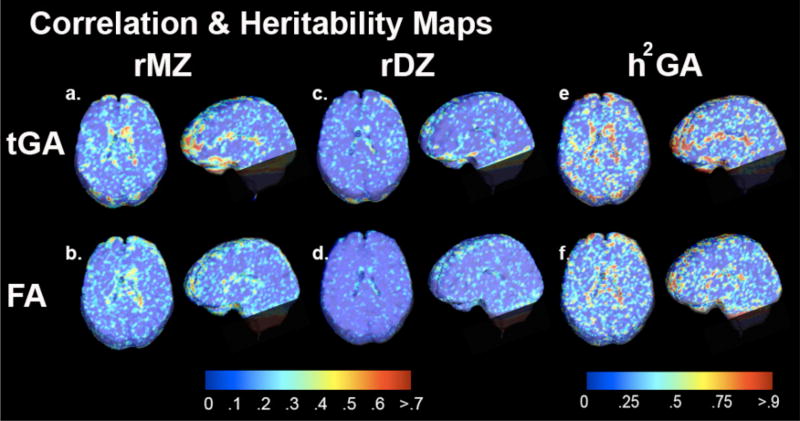
To examine the intra-pair variance within each of the groups, Figures 3a and 3c show intraclass correlation (r) maps between MZ pairs and DZ pairs computed from tGA. Figure 3b and 3d display maps of correlations between MZ pairs and DZ pairs computed from the FA. Although the ventricles, corpus callosum and some anterior temporal regions show higher resemblance among MZs compared to DZ in maps from both FAs and tGAs, all maps are extremely noisy. Falconer’s heritability estimate, computed at each voxel, is also shown in Figure 3. Heritability maps for both tGA and FA show that the fiber characteristics in the corpus callosum and some anterior temporal regions may be heritable, as shown in Figure 3e and 3f. This is not unreasonable, as these are also heavily myelinated white matter tracts with highest FA (and GA). Heritable regions are slightly more extensive for tGA (3e) than FA (3f), but both maps are very noisy.
Figure 3.
(a)–(d): Intraclass correlation (ICC) maps for tGA and FA in MZ and DZ twins. ICC maps for MZ (a,b) suggest numerically greater intra-pair similarity than DZ pairs (c,d). ICC maps derived from tGA (1 and c) have marginally greater effect sizes than those from FA (b and d; see Fig. 5). (e,f) show heritability maps from tGA and from FA.
Figures 4a–d show significance value maps for these correlations, based on the computed r values; significance was assigned using a non-parametric permutation test at each voxel for both FA and GA. Correlation is the strongest in the corpus callosum and some of anterior temporal regions.
Figure 4.
shows non-parametric permutation based p-values at each voxel, based on r values for tGA and FA for MZ and DZ groups. Maps based on tGA (a,b) show slightly better detection power than FA (c,d); all maps are somewhat noisy.
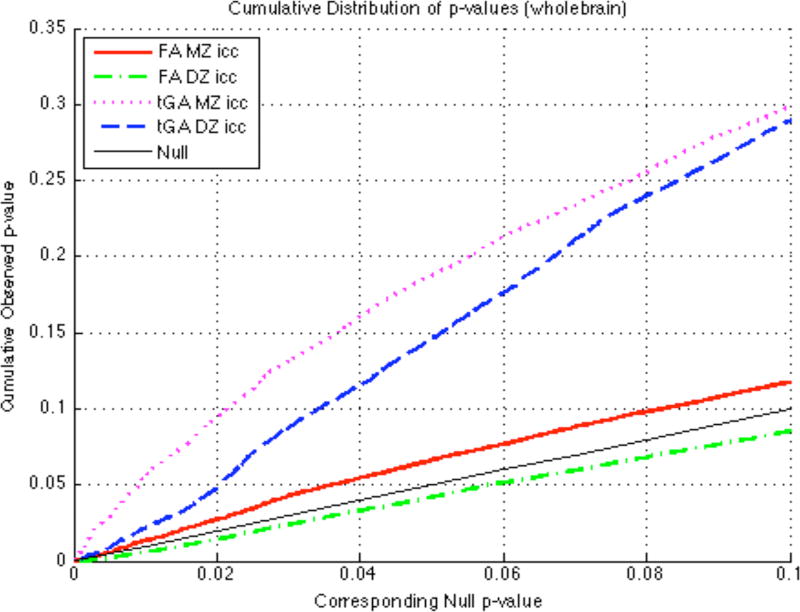
Cumulative distribution functions (CDFs; Fig. 5) show p-values for the FA and tGA statistics in each twin group. The solid line, for comparison, indicates the null distribution, which would represent a complete lack of correlation between twins. The difference between the null distribution and the empirical CDF curve reflects the distribution of voxels with different significance levels, which may be considered as a measure of the effect size in maps thresholded at different levels. As expected, statistics from the GA yielded significance CDFs with sleeper slopes at the origin than those for FA, which is a simpler, Euclidean, anisotropy measure. The GA may help detect genetic effects with higher power than the FA as the effect size in the MZ correlation map is marginally higher.
Figure 5.
Cumulative distribution plots of p-values. Each graph shows a CDF plot for the significance of correlations, for FA and tGA, and for MZ and DZ groups. Compared with the null distribution (solid diagonal line), GA shows higher effect sizes, perhaps because it accounts for the tensor manifold structure in computing differences and similarities between tensors. As expected from the proportion of shared genes, effect sizes for similarities are marginally greater in identical than fraternal twins.
5. DISCUSSION
Here we introduced an algorithmic pipeline to map genetic influences on fiber diffusion anisotropy in twins, using 3D fluid registration, Log-Euclidean mappings, and voxel-based quantitative genetics. The rather low signal-to-noise in the statistical maps, even with N=90 subjects, likely results from (1) the small variance in FA and GA in healthy young subjects, (2) possibly higher environmental (nongenetic) influences; and (3) registration errors across subjects, which is inevitable as no perfect homology exists between fiber paths across subjects. In 90 twins, GA slightly outperformed FA for detecting twin correlations, although effect sizes were rather weak (correlations occurring at around 4-6 times the chance level for GA in MZ twins, which would not satisfy false discovery rate criteria for overall significance). This sample will expand ten-fold to 1150 subjects over 5 years, suggesting that power may be sufficient to improve the CDFs (Fig. 5) and create heritability maps for fiber parameters.
References
- 1.Alexander DC, Pierpaoli C, Basser PJ, Gee JC. Spatial transformations of diffusion tensor magnetic resonance. IEEE-TMI. 2001;20:1131–1139. doi: 10.1109/42.963816. [DOI] [PubMed] [Google Scholar]
- 2.Arsigny V, Fillard P, Pennec X, Ayache N. Fast and simple calculus on tensors in the log-Euclidean framework. Int Conf Med Image Comput Comput Assist Interv. 2005;8:115–22. doi: 10.1007/11566465_15. MICCAI. [DOI] [PubMed] [Google Scholar]
- 3.Batchelor P, Moakher M, Atkinson D, Calamante F, Connelly A. A rigorous framework for diffusion tensor calculus. Magn Reson Med. 2005;53:221–225. doi: 10.1002/mrm.20334. [DOI] [PubMed] [Google Scholar]
- 4.Christensen G, Rabbitt R, Miller M. Deformable templates using large deformation kinematics. IEEE Trans. Image Process. 1996;5:1435–1447. doi: 10.1109/83.536892. [DOI] [PubMed] [Google Scholar]
- 5.Falconer DS. Introduction to Quantitative Genetics. 2. Longman; 1981. [Google Scholar]
- 6.Jenkinson M, Smith S. A global optimisation method for robust affine registration of brain images. Med Image Anal. 2001;5:143–56. doi: 10.1016/s1361-8415(01)00036-6. [DOI] [PubMed] [Google Scholar]
- 7.Jones DK, Horsfield MA, Simmons A. Optimal strategies for measuring diffusion in anisotropic systems by magnetic resonance imaging. Magn Reson Med. 1999;42:515–25. [PubMed] [Google Scholar]
- 8.Lepore N, Brun C, Chiang MC, Chou Y, Dutton RA, Hayashi KM, Lopez OL, Aizenstein HJ, Toga AW, Becker JT, Thompson P. Multivariate statistics of Jacobian matrices in Tensor Based Morphometry and their application to HIV/AIDS. MICCAI. 20062006 doi: 10.1007/11866565_24. [DOI] [PubMed] [Google Scholar]
- 9.Pfefferbaum A, Sullivan EV, Carmelli D. Genetic regulation of regional microstructure of the corpus callosum in late life. Neuroreport. 2001;12:1677–81. doi: 10.1097/00001756-200106130-00032. [DOI] [PubMed] [Google Scholar]
- 10.Shattuck DW, Leahy RM. BrainSuite: an automated cortical surface identification tool. Medical Image Analysis. 2001;8(202):129–141. doi: 10.1016/s1361-8415(02)00054-3. [DOI] [PubMed] [Google Scholar]
- 11.Thompson PM, Cannon TD, Narr KL, van Erp T, Poutanen VP, Huttunen M, Lonnqvist J, Standertskjold-Nordenstam CG, Kaprio J, Khaledy M, Dail R, Zoumalan CI, Toga AW. Genetic influences on brain structure. Nat Neurosci. 2001;4:1253–8. doi: 10.1038/nn758. [DOI] [PubMed] [Google Scholar]
- 12.Zhang H, Yushkevich PA, Alexader DC, Gee JC. Deformable registration of diffusion tensor MR images with explicit orientation optimization. Medical Image Analysis. 2006;10:764–785. doi: 10.1016/j.media.2006.06.004. [DOI] [PubMed] [Google Scholar]


