

Abstract
Recent advances in additive manufacturing technology now enable fused filament fabrication (FFF) of Polyetheretherketone (PEEK). A standardized lumbar fusion cage design was 3D printed with different speeds of the print head nozzle to investigate whether 3D printed PEEK cages exhibit sufficient material properties for lumbar fusion applications. It was observed that the compressive and shear strength of the 3D printed cages were 63-71% of the machined cages, whereas the torsion strength was 92%. Printing speed is an important printing parameter for 3D printed PEEK, which resulted in up to 20% porosity at the highest speed of 3000 mm/min, leading to reduced cage strength. Printing speeds below 1500 mm/min can be chosen as the optimal printing speed for this printer to reduce the printing time while maintaining strength. The crystallinity of printed PEEK did not differ significantly from as-machined PEEK cages from extruded rods, indicating that the processing provides similar microstructure.
I. INTRODUCTION
Additive Manufacturing (AM), more commonly known as three-dimensional (3D) printing, has emerged as a new frontier for medical device manufacturing1. Although relatively new, AM has already been used to fabricate medical devices and surgical instruments from a range of metallic and polymeric materials1–6. Spinal surgery is one of the therapeutic areas in which there has been early interest in AM. Additive manufacturing techniques, including fused filament fabrication (FFF) and selective laser sintering (SLS), have been successfully used to manufacture spinal implants7, 8, including spinal cages9–11.
Spinal cages are load bearing surgical implants commonly used to stabilize the spine and to treat back pain resulting from degenerative disc disease and spondylolisthesis12, 13. Figueroa et al.11 manufactured spinal cages via FFF with Acrylonitrile Butadiene Styrene (ABS) and polycarbonate (PC). Cavazos et al.9 also investigated the viability of several design concepts in 3D printed intervertebral lumbar cages based on PC. Previous studies investigated design concepts for lumbar cages to establish technical feasibility of FFF with PC and ABS. However, these relatively low processing temperature polymers have limited mechanical properties compared to polyetheretherketone (PEEK) and no prior history of clinical use in this application14. The recent advances of FFF techniques to include high processing temperature polymers, including PEEK, motivated our research group to examine spinal cages produced with this novel manufacturing technique.
PEEK has been used for intervertebral lumbar cages since the 1990s. PEEK is biocompatible, provides durability and strength, and has an elastic modulus comparable to cortical bone15. Most importantly, PEEK is radiolucent, enabling surgeons to monitor positioning and bone ingrowth. However, PEEK’s hydrophobicity inhibits direct bone apposition, which may result in unsatisfactory outcomes of fusion16. Furthermore, PEEK biomaterials are costly. Challenging designs of PEEK cages do not allow for traditional manufacturing methods such as injection molding. Hence, they currently need to be machined from bulk PEEK which results in material loss of approximately 64%. As a result, there has been interest in new technologies such as AM to manufacture PEEK implants, including cages, to improve their integration with bone as well as to minimize the amount of material lost during processing.
Prior to the development of commercially available FFF machines for PEEK, SLS was the primary AM processing route for polyketones such as PEEK17, 18. SLS processing of PEEK is complicated by particle morphology and size distribution. In addition to the complexity of powder production and handling, SLS equipment is costly and generates gaseous laser sintering powder material waste17, 19. Lastly, residual powder, which is un-sintered is not reusable, and is thus be considered as waste. These limitations have fueled both commercial and academic interest in FFF of PEEK as an alternative to SLS. Yet, relatively few studies discuss FFF of PEEK19–22. Wu et al19 developed a PEEK 3D printing system and defined optimal heated bed and print head nozzle temperatures for FFF of PEEK. Vaezi et al.20 later compared a syringe-based extrusion system and FFF for PEEK to manufacture porous structures. Rahman et al.21 on the other hand, investigated the mechanical properties of dog-bone PEEK specimen printed via FFF. Finally, Cicala et al.22 used FFF in a survey of high-temperature engineering polymers including PEEK.
Thus far, spinal cages have been 3D printed via FFF out of several low-temperature polymers, such as PC and ABS, but not PEEK. Although FFF has been shown to be feasible for PEEK, previous research has not focused on specific clinical applications with structural load bearing demands. Accordingly, we sought to address the following research questions: (1) How much of the machined PEEK cages’ strength can be achieved with 3D printed PEEK cages via FFF? (2) What is the optimum printing speed for PEEK spinal cages and how does it affect the strength of printed cages? (3) How are the micro structure and crystallinity affected by FFF compared to machined PEEK cages?
II. MATERIALS AND METHODS
A. Materials & FFF process
Medical grade PEEK used in this study was obtained in two forms; 25-mm diameter extruded rod and an experimental 1.75-mm diameter filament developed from PEEK OPTIMA™ LT1 (Invibio Biomaterial Solutions Ltd., Thornton Cleveleys, UK). LT1 is the most widely used grade of PEEK for implant applications, with a melt flow index of 3.4 and molecular weight of 115,00023. It has a reported melting temperature of ~343°C and glass transition temperature of ~145°C with a crystallization peak of ~160°C24.
The lumbar cage design used in this study was developed as a reference for ASTM interlaboratory studies (Fig. 1 (a))25. The STL file of the cage was created from a 3D model drafted using commercially available software (SolidWorks 2016). Simplify 3D software (available commercially) was used to digitally slice the samples and create the g-code. A batch of six cages was printed on the heated bed. Three-mm temporary support structures were generated in the holes of both sides of the cages to ensure the horizontal cage struts did not collapse during printing (Fig. 1 (b)). In addition, to increase the adhesion between the print object and the print bed, brims were added to the cages (Fig. 1 (c)). These support structures were subsequently trimmed from the cages after printing and before any mechanical or physical property testing.
FIG. 1.

The CAD drawing (a) shows the design parameters for the cage used in this study. A batch of six cages was created with support structures on the heated bed (b) and g-code was created after the addition of the brims around the cages (c) on the Simplify 3D software.
The professional 3D printer used in this study was the Indmatec HPP 155/Gen 2, (Apium Additive Technologies GmbH, Karhlsruhe, Germany) which was designed specifically for PEEK FFF additive manufacturing (Fig 2 (a)). It has a print volume of 155 × 155 × 155 mm and the printing environment is thermally isolated inside an insulated build chamber. The nozzle diameter for the extruder was 0.4 mm. To increase the adhesion between the cages and the heated bed further, one layer of Dimafix® (DIMA 3D Printers) solution was applied onto the heated bed prior to printing.
FIG. 2.

Machined cages (a-right) were manufactured from PEEK OPTIMA LT1 rod and FFF cages (a-left) were printed with the filament of PEEK OPTIMA LT1 and a customized PEEK printer (b).
Printing conditions were kept same for the all cohorts (Table 1), except for the printhead (extruder) nozzle X/Y axis movement speed, also referred as “printing speed.” Four printed cohorts were fabricated with 1000, 1500, 2000 and 3000 mm/min printing speeds using the PEEK OPTIMA™ LT1 filament (Fig. 2 (b)). The printing time and the filament usage for FFF cohorts were recorded (Table 2). In addition to the printed cohorts, control samples were machined from the PEEK OPTIMA™ LT1 extruded rod (Fig. 2 (b)).
TABLE I.
Printing Settings for FFF cages
| Extruder | Infill | ||
|---|---|---|---|
| Nozzle Diameter (mm) | 0.4 | Internal Fill Pattern | Rectilinear |
| Extrusion Multiplier | 0.98 | External Fill Pattern | Rectilinear |
| Retraction Distance (mm) | 0.55 | Interior Fill Percentage | 100% |
| Retraction Speed (mm/min) | 1800 | Outline Overlap | 50% |
| Layer | Infill Extrusion Width | 90% | |
| 1st Layer Height (mm) | 0.1 | Minimum Infill Length (mm) | 5 |
| Top Solid Layers | 3 | Support | |
| Bottom Solid Layer | 3 | Support Infill Percentage | 30% |
| Outline Shells | 3 | Print Support Every (layers) | 1 |
| 1st Layer Height | 180% | Temperature | |
| 1st Layer Width | 100% | Bed Temperature (⁰C) | 100 |
| 1st Layer Speed | 30% | Nozzle Temperature (⁰C) | 390–410 |
| Additions (skirt/brim) | Other | ||
| Skirt Layers | 1 | Z Axis Movement Speed (mm/min) | 1000 |
| Skirt Offset from Part (mm) | 0 | Filament Diameter (mm) | 1.75 |
| Skirt Outlines | 15% | ||
TABLE II.
Manufacturing time and cage weight of cohorts depending on the manufacturing method.
| Cohorts | Cage Weight (g) | Time per Cage (min) | ||
|---|---|---|---|---|
| Mean | Standard deviation | |||
| Printed with (mm/min) | 1000 | 1.56 | 0.008 | 62.8 |
| 1500 | 1.50 | 0.009 | 40.3 | |
| 2000 | 1.49 | 0.011 | 33.7 | |
| 3000 | 1.27 | 0.022 | 20.4 | |
| Machined | 1.44 | 0.018 | 17 | |
B. Mechanical Testing
Five samples from each cohort were tested under compression, compression-shear and torsion according to the ASTM F207726 and in accordance with ISO 17025 quality system requirements27. Tests were conducted on a MTS Mini Bionix 858 system (MTS Systems Corporation, Eden Prairie, MN) equipped with calibrated load and displacement sensors. The load cell capacity was 15 kN for compression and shear tests and the strain rate was chosen as 25 mm/min (as per ASTM F207726). The cell capacity for torque was 100 N-m and torsion tests were conducted at 60 °/min. Load-displacement and torque-angle curves were plotted from the data. Stiffness, ultimate displacement/angle and ultimate load/torque values were calculated from the curves using a custom script in MATLAB 2016b, using the recommendations in ASTM F207726 as a guide.
C. Imaging
Prior to testing, three cages from each cohort were micro-CT scanned at 10 μm isotropic resolution using a Scanco μCT 80 (Scanco Medical, Switzerland). Both ends of the cage design, where it was solid cuboid, were defined as the regions of interest to obtain porosity measurements per cage. A control volume (5×5×2 mm3; limited by the standardized cage design) was created for the porosity calculations. Two control volume measurements were taken from the designated regions per cage to compare the average porosity and the pore size between the cohorts (n=6 per cohort). The histogram of the grayscale values (which correspond with densities) resulting from the micro-CT scans appeared as two clear peaks (one for the PEEK cages, and the other for empty space (i.e. air). The threshold chosen for the segmentation threshold was the halfway point between the two peaks. Evaluations were conducted via Scanco software (Scanco Medical, Switzerland) on the control volumes. The evaluation for porosity percentage provided “Solid Volume/Total Volume” values. The porosity percentage of the control volumes were calculated using the Equation 2.
| (2) |
Moreover, the outcome from the evaluations for average pore size is a volume-based thickness. The software uses a volume-based local thickness algorithm which was introduced by Hildebrand and Rüegsegger28. After mechanical testing, the fracture surfaces of printed cohorts were imaged using light microscopy to view the crack morphology of different cohorts under the same loading condition. Crack and layer width were also calculated from the light microscopy images of the compression samples. Furthermore, detailed surface micrographs of printed cohorts were taken to analyze the porosity and the structure of the surface via scanning electron microscopy (SEM). Prior to SEM, cages were sputtered with platinum and palladium to achieve a conductive surface.
D. Level of crystallinity
X-ray diffraction (XRD) and Fourier transmission infrared spectroscopy (FTIR) were used to determine the degree of crystallinity of PEEK cages. Wide-angle x-ray scattering (WAXS) was determined as the scattering technique for XRD. For WAXS, two cohorts were created as top and bottom from printed cages according to the location where the samples were obtained. Three samples per cohort were evaluated. 1 mm thick samples were used for WAXS analysis. An internal plate was used to collect diffracted X-ray at a distance of 82 mm from the sample for 60 minutes. The internal plate was then read using the RAXIA software to determine the diffraction pattern by plotting 2 theta (2θ) versus intensity. MagicPlot software was used to fit Gaussian distributions and determine the area of the curve to each crystalline peak. The degree of crystallinity was calculated using the Equation 1.
| (1) |
FTIR samples for printed cohorts were prepared from the body of the cages after dividing the cages into two to avoid any contamination of printing bed-PEEK adhesion material, whereas surface was used for machined cohort (n=9-14). FTIR measurements were collected with a Nicolet Continuum (Thermo Electron Corporation, Waltham, MA) and parameters used were based on ASTM F277829. Crystallinity from FTIR data was also calculated using the crystallinity index and the equation provided in ASTM F277828 using a custom script in MATLAB 2016b.
E. Statistics
Distributions of data were first inspected for normality using the Shapiro-Wilk W test. Normal data sets were analyzed via ANOVA with a post-hoc Dunnett’s Test (pairwise ranking with a control (machined cages)). Kruskal Wallis Test with a post-hoc Steel Test (pairwise ranking with a control (machined cages)) was conducted for comparisons with non-normal data sets. The control group was designated as machined cages cohort. In addition, bivariate correlations analysis was performed using the Pearson Correlation on the normal data sets, and with Spearman’s Correlation on the non-normal data sets. Since, the cracks were analyzed only on the printed cages, there was not a control group. For crack and layer width measurements, Kruskal Wallis Test with a post-hoc Dunn with Bonferroni correction was conducted for comparisons. Statistical analyses were performed using commercially available statistical software (JMP 11.0; Cary, NC) with α=0.05.
III. RESULTS
A. Mechanical Testing
The stiffness of the printed cages achieved between 74-92% of the machined cages’ stiffness depending on the loading condition (Table 3). Under compressive loading, cages printed with the slowest speed (1000 mm/min) were able to provide 91.6% of machined cages stiffness and we did not observe a difference between the stiffnesses of the printed cages (p=0.25). Bivariate analysis of speed versus stiffness showed that stiffness decreased significantly when the printing speed increased (Pearson Correlation Coefficient (PCC) = −0.58, p<0.01). Finally, machined cages were significantly stiffer than printed cohorts with 1500, 2000 and 3000 mm/min (p<0.001, 0.002, and <0.001; mean difference=2486, 1935, and 2643 N, respectively).
TABLE III.
Metrics calculated in this study.
| Cohorts | Machined | Printed with Speeds (mm/min) | ||||||||
|---|---|---|---|---|---|---|---|---|---|---|
| 1000 | 1500 | 2000 | 3000 | |||||||
| Mean | Standard deviation | Mean | Standard deviation | Mean | Standard deviation | Mean | Standard deviation | Mean | Standard deviation | |
| Compression | ||||||||||
| Stiffness (N/mm) | 10184 | 1108 | 9324 | 333 | 7698 | 1151 | 8249 | 296 | 7541 | 304 |
| Ultimate Force (N) | 14229 | 335 | 8964 | 304 | 8336 | 1044 | 7949 | 559 | 7856 | 167 |
| Ultimate Displacement (mm) | 3.12 | 0.419 | 1.43 | 0.175 | 1.55 | 0.848 | 1.51 | 0.182 | 1.63 | 0.054 |
| Compression - Shear | ||||||||||
| Stiffness (N/mm) | 1123 | 94 | 929 | 114 | 953 | 308 | 976 | 106 | 854 | 178 |
| Ultimate Force (N) | 2140 | 195 | 971 | 243 | 1511 | 540 | 862 | 131 | 906 | 206 |
| Ultimate Displacement (mm) | 3.06 | 0.668 | 2. 23 | 0. 303 | 2.89 | 1.07 | 1.70 | 0.811 | 1.81 | 0.843 |
| Torsion | ||||||||||
| Stiffness (Nm/deg) | 2.26 | 0.262 | 1.37 | 0.373 | 1.50 | 0.238 | 1.16 | 0.159 | 1.15 | 0.164 |
| Ultimate Moment (Nm) | 11.7 | 0.193 | 11.2 | 0.559 | 11.3 | 0.348 | 10.5 | 0.895 | 10.2 | 0.502 |
| Ultimate displacement (deg) | 18.8 | 5.40 | 16.3 | 4.16 | 15.5 | 3.13 | 16.7 | 2.40 | 16.1 | 2.11 |
| LM Measurements | ||||||||||
| Crack width (microns) | N/A | N/A | 87.5 | 13.7 | 51.8 | 24.3 | 71.2 | 36.0 | 87.3 | 61.3 |
| Layer width (microns) | N/A | N/A | 96.1 | 27.5 | 110 | 17.8 | 112 | 12.7 | 130 | 25.5 |
| Porosity | ||||||||||
| Porosity percentage (%) | 0 | 0 | 1.88 | 1.12 | 3.82 | 0.89 | 2.99 | 0.92 | 19.6 | 2.70 |
| Average pore size (microns) | 0 | 0 | 97.0 | 32.5 | 116 | 25.3 | 80.6 | 17.9 | 135 | 22.5 |
| Crystallinity | ||||||||||
| XRD (%) | 48.5 | 0.95 | 49.5 | 4.32 | 47.9 | 4.26 | 48.6 | 3.38 | 49.1 | 3.13 |
| FTIR (%) | 20.0 | 0.700 | 19.7 | 0.735 | 20.3 | 0.301 | 20.3 | 0.602 | 20.2 | 0.394 |
Under compressive-shear loading, we did not detect a difference in stiffness between printed cohorts and the machined cohort (p = 0.37). Printed cages showed similar stiffness compared to the machined cages and they were able to provide up to 87% stiffness of the machined cages. Printing speed did not significantly affect the stiffness of printed cohorts when compressive-shear loading was applied (PCC = −0.18; p = 0.47).
Under torsional loading, the printed cohort with 1500 mm/min was able to reach 67% of machined cages’ stiffness. However, machined cages were significantly stiffer than all printed cohorts (p=0.04 for all tests; mean difference= 888, 757, 1103 and 1114 N.mm/°; for the cohorts printed with 1000, 1500, 2000 and 3000 mm/min, respectively). The decrement in printed cohorts’ torsional stiffness due to printing speed increment was not significant (Rho = −0.37; p = 0.11).
In addition to the stiffness, ultimate load/moment and ultimate displacement were compared among cohorts (compression, shear, or torsion, Fig. 3). Under compressive loading, slowest printed cages were able to provide 63% ultimate strength of the machined cages (Fig. 3(a)). However, machined cages’ ultimate load was significantly higher than all printed cohorts (p=0.04 for all the comparisons; mean difference=5336, 5964, 6351, and 6443 N, for the cohorts printed with 1000, 1500, 2000, and 3000 mm/min, respectively). Bivariate analysis revealed that printing speed was inversely correlated with the ultimate load (Rho = −0.61, p=0.005).
FIG. 3.
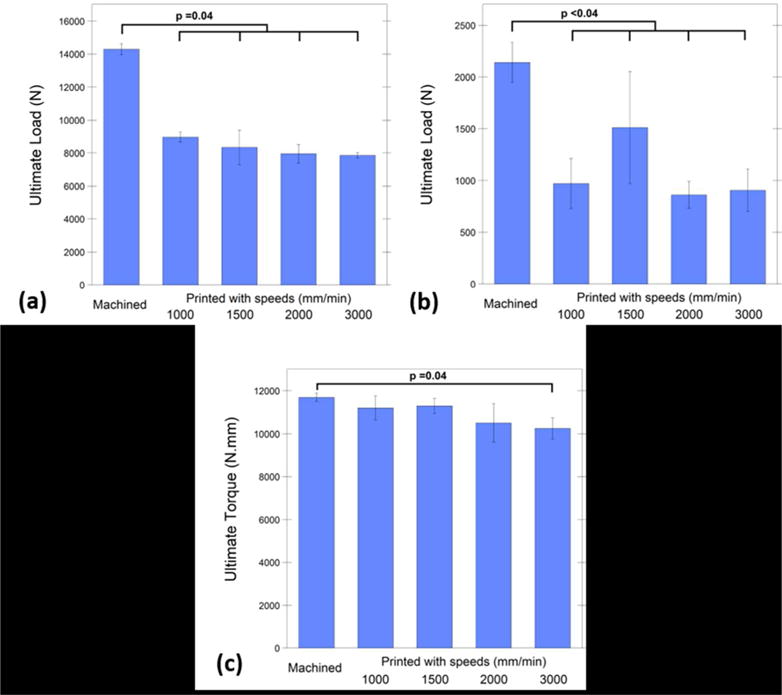
Under compressive loading, slowest printed cages were able to provide 63% ultimate strength of the machined cages (a), under compressive-shear loading, the cohort printed with 1500 mm/min speed showed 71% ultimate load of the machined cages, however they were both significantly lower than machined cages (b). Under torsional loading, cohorts printed with 1000, 1500, and 2000 mm/min showed comparable (92% on average) ultimate moment with the machined cages and with no significant differences (c).
When compressive-shear load was applied to the cages, the cohort printed with 1500 mm/min speed showed 71% ultimate load of the machined cages, however it was significantly lower (p=0.03; mean difference=629 N; Fig. 3(b)). Additionally, machined cages showed significantly higher ultimate load than the other printed cohorts (p<0.001 for all tests; mean difference=1169, 1279, and 1235 N for the cohorts printed with 1000, 2000, and 3000 mm/min, respectively).). There was no correlation in ultimate load printing speed under shear (PCC=−0.24, p>0.19).
Under torsional loading, cohorts printed with 1000, 1500, and 2000 mm/min showed comparable ultimate moment with the machined cages and with no significant differences (p = 0.18, 0.27, and 0.39, respectively; Fig. 3(c)). Machined cages ultimate moment was only higher than the fastest cohort (3000 mm/min) (p=0.04 and mean difference= 1448 N.mm). Bivariate analysis verified that the ultimate moment reached under torsional loading was negatively correlated with the printing speed (Rho = −0.60; p=0.005).
When ultimate displacement was compared between cohorts under compression, machined cohort was displaced significantly more until it reached to the ultimate load compared to printed cohorts with 1000, 2000, and 3000 mm/min (p=0.04 for all tests; mean difference= 1.69, 1.61, and 1.49 mm). The only significant difference detected was between printed cohort with 1500 mm/min and machined cohort (p=0.12 and mean difference=1.57 mm). And there was not a significant correlation between printing speed and ultimate displacement (Rho=0.35 and p=0.5).
Printed cohorts demonstrated similar ultimate displacement under compression-shear force compared to the machined cages (p=0.08). Additionally, printing speed was not correlated with ultimate displacement under shear force (PCC = −0.31; p=0.199). Similarly, printed cohorts’ angular displacement was not significantly different than machined cages (PCC = 0.02; p=0.94). No significant difference was observed between the printed cohorts’ displacement under torsional load (p=0.66) and no correlation was detected between the angular displacement of the cohorts and the printing speed (p=0.94).
B. Imaging
Based on the micro-CT scans, printed cohorts exhibited, on average, between 2-20% porosity (Fig. 4(a)). There was a strong correlation between the printing speed and the porosity of the printed cages (PCC = 0.88; p<0.001). As expected, there were no detectable pores (mean porosity=0%) for machined cages, which was significantly lower than printed cages (p=0.01 for all tests; mean difference=1.88%, 3.82%, 2.99%, and 19.6%, for printed cohorts with 1000, 1500, 2000, and 3000 mm/min respectively).
FIG. 4.

Porosity in cohorts. Increasing the printing speed increased the porosity of printed cages significantly (a). Mean porosity difference was 18% between the slowest printed (1000 mm/min) (c) and the fastest printed cohort (3000 mm/min) (d). Average pore sizes of printed cohorts were between 80-135 microns and there was not a significant correlation between printing speed and average pore size (b).
The average pore sizes ranged between 81-135 μm wide for all printed cohorts (Fig. 4(b)). We did not observe a correlation between the printing speed and average pore size (PCC = 0.37; p = 0.08). The average pore size for machined cages was 0 μm and was significantly lower than all the printed cohorts (p=0.01 for all tests; mean difference=97, 116, 81, and 135 μm for printed cohorts with 1000, 1500, 2000, and 3000 mm/min, respectively).
SEM images were used to visualize the pore structures on the cage surface (Fig. 5). It was observed from the SEM images that the printed cohorts had unfused layers which might be associated with weaker points for crack initiation (Figure 6). The fracture surface morphology was the same for all printed cohorts under the same loading condition (Fig. 7). Under compression and shear, the cracks were observed parallel with the layers. On the other hand, under torsional loading, the crack started parallel with the layers and then changed the direction and became perpendicular to the layers.
FIG. 5.

Although average pore size did not significantly increase by increasing the printing speed, porosity was observed in all FFF cages (e) printed with 1000 (a), 1500 (b), 2000 (c) and 3000 (d) mm/min speed. However, both average pore size and porosity percentage of machined cages were not detected from micro-CT 3D scans (f).
FIG. 6.

Partial fusion of the layers (a) and unfused layers (b) both observed in a surface (a). Additional porosity might be caused by external factors such as nozzle removal from the print surface (c).
FIG. 7.

Under compressive (a-b) and shear loading (c) conditions the cracks were aligned parallel with the layers. However, under the torsional loading condition, the crack initiated along the printed layers it continued perpendicular to the printed layers (d).
Additionally, the layer and crack width were calculated and analyzed (Fig. 8 and Table 3). Bivariate analysis indicated that the layer width increased significantly when the printing speed was increased (Rho=0.46 and p<0.0001). Fastest printed (3000 mm/min) cohort’s layers were significantly wider than the other printed groups (p<0.001 for all tests; mean difference=34.2, 19.9, and 18.37 μm for printed cohorts with 1000, 1500, and 2000 mm/min, respectively). Moreover, the slowest printed (1000 mm/min) cohort’s layer width was significantly smaller than the cohorts printed with 1500 and 2000 mm/min (p<0.03 and mean difference=14.3 and 15.8 μm, respectively).
FIG. 8.

Crack and layer width were measured from printed cohorts after compression testing (a). Increasing the printing speed caused a greater layer width (b), however crack width was not significantly correlated with the print speed (c).
For crack width, on the other hand, there was no significant correlation due to speed increment (SCC= −0.12, p=0.39). Nevertheless, the slowest printed (1000 mm/min) cohort’s crack width was significantly higher than cohorts printed with 1500 and 2000 mm/min (p<0.0001 and 0.04 and mean difference=35.7 and 16.25 μm, respectively). Finally, the fastest (3000 mm/min) printed cohort demonstrated significantly higher crack width than the 1500 mm/min group (p=0.009 and mean difference=35.5 μm).
C. Level of crystallinity
Both FTIR and XRD confirmed that crystallinity did not depend on the manufacturing method in PEEK cages. There was no significant difference detected between the printed cohorts and machined cohort crystallinity calculated via FTIR, (mean crystallinity ~20%; p=0.49, 0.98, 0.74, and 0.98 for printed cohorts with 1000, 1500, 2000, and 3000 mm/min, respectively, Table 3). Additionally, we did not observe a correlation between the printing speed and the crystallinity measured using FTIR (PCC=0.12 and p=0.46). Similarly, XRD also did not show any significant differences between the printed and machined cohorts (p=0.97, 1.0, 1.0, and 1.0 for printed cohorts with 1000, 1500, 2000, and 3000 mm/min, respectively). The average crystallinity calculated via WAXS was approximately 49% (Table 3). Similar to FTIR, there was not a correlation detected between the printing speed and the crystallinity measured using XRD (PCC=0.001 and p=0.996). There was no significant difference in crystallinity was detected between the top and bottom locations reference to the heated bed of the printed cohorts via WAXS (p=0.68).
IV. DISCUSSION
We present here a detailed structure-property investigation of FFF PEEK structural, load-bearing implants developed using a commercially available printer. The 3D printed PEEK cages via FFF achieved between 63-92% strength of machined PEEK cages under different loading conditions. We would like to emphasize that these findings were obtained with “as printed” cages, without any subsequent post-processing such as annealing. The results of this study suggest that the optimum printing speed for FFF PEEK cages in the present configuration is between 1000 and 1500 mm/min. Our findings were explained by porosity of the cages, as documented by Micro-CT evaluations and SEM images. We did not observe an association between the cage properties and crystallinity as a function of printing speed, further supporting the concept that print defects at the microscale, rather than crystalline morphology, are likely responsible for the differences between the FFF and machined PEEK cages.
Previous studies of FFF PEEK have shown mechanical property differences of FFF compared to other manufacturing methods21. Cicala et al.22 conducted tensile loading on PEEK dog-bone specimen 3D printed by FFF and showed that FFF PEEK’s tensile strength was 77% of the injection molded PEEK. Similarly, Rahman et al.21 provided a range of injection molded PEEK’s tensile strength, where their FFF PEEK results performed from 33 to 97%. As an another AM method, PEEK manufactured via SLS was referred to have lower strength than injected molded PEEK as well17. Berretta et al.18 tested the tensile strength of their dog-bone PEEK specimen produced by SLS, which were around 60% of the PEEK’s tensile strength30.
While taking the reported decrease caused by FFF from the literature into consideration, it must be noted that our results are applied on the spinal cages tested under compressive loading conditions rather than tension. Mechanical properties of FFF PEEK cages were compared as reference to machined cages results which were within the reproducibility limit of ASTM standards25. FFF cages exhibited a compressive strength of ~8 kN, which is less than the machined PEEK cages but in excess of the load expected for cages under in vivo loading31. The compressive strength of human thoracolumbar vertebrae ranges from about 2000 N for specimens having low bone density and small cross-sectional areas to about 8000 N for specimens having high bone density and large cross-sectional areas32. Similarly, Wilke et al.33 measured in vivo lumbar disc pressure in common activities which was between 180-4140 N. Although the compressive-shear and torsional strength were lower for FFF cages than machined cages, they were above the axial compression-shear and rotation limits defined for a spinal unit34.
The difference in mechanical properties between FFF versus machined PEEK cages can be explained, at least in part, both by the layer adhesion and porosity of the printed cages. Crack visualization indicated the importance of the layer adhesion for FFF cages. This strengthens the idea of layer to layer intersection line being the stress point, since the cracks observed along with the layers.
Micro-CT scanning was previously designated for characterization of porosity in parts printed via FFF35. In our study, FFF cages’ (printed with slowest speed) average porosity calculated from micro-CT scans of control volume was 2%. Often the cause of porosity is explained by the entrapped micro-air bubbles in the filament and voids which became pores during the FFF process20. Vaezi et al.20 stated that high level of porosity (38%) played a role in reduction of mechanical properties for their porous PEEK samples and showed that even printing with 100% infill they encountered 14% porosity of FFF PEEK samples. Cicala et al.22 also emphasized the need of optimization for FFF PEEK by decreasing pore formation during the printing process.
The reason why slower speeds were suggested for FFF of PEEK is the association between printing speed and porosity. The printing speed had a great impact on the printed cages’ porosity such that it increased the porosity from 2-4% (slower speeds) to 20% (fastest speed).
Considering the fact that the printhead’s movement pattern remains the same regardless of the printing speed, increasing the print head’s speed redundantly might have caused an imperfect filament to filament bonding, which could increase the porosity and cause an overall reduction in mechanical properties. In the same manner, Vaezi et al.20 associated the porosity found in PEEK samples with 100% infill with the formation of air gap between deposited filaments within layers. Additionally, it was emphasized by the previous studies that the influence of filament-to-filament bonding is more crucial than the strength of filament itself for 3D printed parts via FFF36, 37. Thus, in addition to diminishing entrapped micro-bubbles in filament prior to printing, a good filament-to-filament bonding must be considered to reach the optimum structural integrity under load.
Furthermore, it was confirmed that FFF process did not influence cages’ crystallinity. It is well known that the crystallinity of PEEK has a sufficient influence in it’s the mechanical properties38. FFF process did not change the crystallinity of PEEK cages compared to extruded rod, which were in accordance with the literature39, 40.
Several limitations to the current study can be acknowledged here. The printing speeds used in this study are applicable to this printer and extruder configuration, and changes in this configuration may impact the porosity in a different manner than observed here. In the current study, cages were also tested “as printed”, without any post-processing such as annealing which will be investigated in future research. Finally, mechanical strength of the cages was evaluated under static loading conditions. Thus, future studies should investigate fatigue behavior of printed cages compared to machined cages.
V. CONCLUSIONS
The results suggest that without any additional influence on 3D printing such as ambient parameter control or post processing, FFF 3D printed cages are already able to provide sufficient strength for lumbar cage applications. It also indicates the importance of printing parameters such as printing speed to avoid porosity which may improve the mechanical properties of printed cages. Our findings are important steps towards evaluating this novel 3D printing manufacturing technique for PEEK implants.
Acknowledgments
This study was supported by NIH-R01 AR069119. We would like to thank Invibio for donating the medical grade PEEK derived filament and extruded rod stock used in the experiment. We would also like to thank Apium for their helpful advice and fruitful discussions.
References
- 1.Tack P, Victor J, Gemmel P, Annemans L. 3D-printing techniques in a medical setting: a systematic literature review. Biomed Eng Online. 2016;15(1):115. doi: 10.1186/s12938-016-0236-4. [DOI] [PMC free article] [PubMed] [Google Scholar]
- 2.Eltorai AE, Nguyen E, Daniels AH. Three-Dimensional Printing in Orthopedic Surgery. Orthopedics. 2015;38(11):684. doi: 10.3928/01477447-20151016-05. [DOI] [PubMed] [Google Scholar]
- 3.Gibbs DM, Vaezi M, Yang S, Oreffo RO. Hope versus hype: what can additive manufacturing realistically offer trauma and orthopedic surgery? Regen Med. 2014;9(4):535. doi: 10.2217/rme.14.20. [DOI] [PubMed] [Google Scholar]
- 4.Martelli N, Serrano C, van den Brink H, Pineau J, Prognon P, Borget I, El Batti S. Advantages and disadvantages of 3-dimensional printing in surgery: A systematic review. Surgery. 2016;159(6):1485. doi: 10.1016/j.surg.2015.12.017. [DOI] [PubMed] [Google Scholar]
- 5.Provaggi E, Leong JJH, Kalaskar DM. Applications of 3D printing in the management of severe spinal conditions. Proc Inst Mech Eng H. 2017;231(6):471. doi: 10.1177/0954411916667761. [DOI] [PubMed] [Google Scholar]
- 6.Ventola CL. Medical Applications for 3D Printing: Current and Projected Uses. P t. 2014;39(10):704. [PMC free article] [PubMed] [Google Scholar]
- 7.Janusz D, Konstanty S, Roman G, Adrian M. Rapid prototyping in the intervertebral implant design process. Rapid Prototyping Journal. 2015;21(6):735. [Google Scholar]
- 8.de Neal B, van der André M. Patient-specific intervertebral disc implants using rapid manufacturing technology. Rapid Prototyping Journal. 2013;19(2):126. [Google Scholar]
- 9.Figueroa-Cavazos JO, Flores-Villalba E, Diaz-Elizondo JA, Martinez-Romero O, Rodriguez CA, Siller HR. Design Concepts of Polycarbonate-Based Intervertebral Lumbar Cages: Finite Element Analysis and Compression Testing. Appl Bionics Biomech 2016. 2016:7149182. doi: 10.1155/2016/7149182. [DOI] [PMC free article] [PubMed] [Google Scholar]
- 10.Serra T, Capelli C, Toumpaniari R, Orriss IR, Leong JJ, Dalgarno K, Kalaskar DM. Design and fabrication of 3D-printed anatomically shaped lumbar cage for intervertebral disc (IVD) degeneration treatment. Biofabrication. 2016;8(3):035001. doi: 10.1088/1758-5090/8/3/035001. [DOI] [PubMed] [Google Scholar]
- 11.Figueroa O, Rodríguez CA, Siller H, Martinez-Romero O, Flores-Villalba E, Díaz-Elizondo J, Ramírez R. Lumbar cage design concepts based on additive manufacturing. Researchgate. 2014;603 doi: 10.1201/b15961-110. [DOI] [Google Scholar]
- 12.McGilvray KC, Waldorff EI, Easley J, Seim HB, Zhang N, Linovitz RJ, Ryaby JT, Puttlitz CM. Evaluation of a polyetheretherketone (PEEK) titanium composite interbody spacer in an ovine lumbar interbody fusion model: biomechanical, microcomputed tomographic, and histologic analyses. Spine J. 2017 doi: 10.1016/j.spinee.2017.06.034. [DOI] [PubMed] [Google Scholar]
- 13.Asil K, Yaldiz C. Retrospective Comparison of Radiological and Clinical Outcomes of PLIF and TLIF Techniques in Patients Who Underwent Lumbar Spinal Posterior Stabilization. Medicine (Baltimore) 2016;95(17) doi: 10.1097/MD.0000000000003235. [DOI] [PMC free article] [PubMed] [Google Scholar]
- 14.Bartolo PJdS, Lemos ACSd, Pereira AMH, Mateus AJDS, Ramos C, Santos CD, Oliveira D, Pinto E, Craveiro F, Bartolo HMCdRTG, Almeida HdA, Sousa I, Matias JM, Durao L, Gaspar M, Alves NMF, Carreira P, Ferreira T, Marques T. High Value Manufacturing: Advanced Research in Virtual and Rapid Prototyping; Proceedings of the 6th International Conference on Advanced Research; Leiria, Portugal. 1–5 October, 2013; Leira, Portugal: CRC Press, Inc.; 2013. [Google Scholar]
- 15.Vadapalli S, Sairyo K, Goel VK, Robon M, Biyani A, Khandha A, Ebraheim NA. Biomechanical rationale for using polyetheretherketone (PEEK) spacers for lumbar interbody fusion-A finite element study. Spine. 2006;31(26):E992. doi: 10.1097/01.brs.0000250177.84168.ba. [DOI] [PubMed] [Google Scholar]
- 16.Duncan JW, Bailey RA. An analysis of fusion cage migration in unilateral and bilateral fixation with transforaminal lumbar interbody fusion. European Spine Journal. 2013;22(2):439. doi: 10.1007/s00586-012-2458-x. [DOI] [PMC free article] [PubMed] [Google Scholar]
- 17.Schmidt M, Pohle D, Rechtenwald T. Selective Laser Sintering of PEEK. CIRP Annals. 2007;56(1):205. [Google Scholar]
- 18.Berretta S, Evans KE, Ghita O. Processability of PEEK, a new polymer for High Temperature Laser Sintering (HT-LS) European Polymer Journal. 2015;68(Supplement C):243. [Google Scholar]
- 19.Wu WZ, Geng P, Zhao J, Zhang Y, Rosen DW, Zhang HB. Manufacture and thermal deformation analysis of semicrystalline polymer polyether ether ketone by 3D printing. Materials Research Innovations. 2014;18(sup5):S5. [Google Scholar]
- 20.Vaezi M, Yang S. Extrusion-based additive manufacturing of PEEK for biomedical applications. Virtual and Physical Prototyping. 2015;10(3):123. [Google Scholar]
- 21.Rahman KM, Letcher T, Reese R. Mechanical Properties of Additively Manufactured PEEK Components Using Fused Filament Fabrication(57359) 2015 V02AT02A009. [Google Scholar]
- 22.Cicala G, Latteri A, Del Curto B, Lo Russo A, Recca G, Fare S. Engineering thermoplastics for additive manufacturing: a critical perspective with experimental evidence to support functional applications. J Appl Biomater Funct Mater. 2017;15(1):0. doi: 10.5301/jabfm.5000343. [DOI] [PubMed] [Google Scholar]
- 23.Kurtz SM. PEEK Biomaterials Handbook. William Andrew Publishing; Oxford, UK: 2012. Chapter 2 - Synthesis and Processing of PEEK for Surgical Implants; p. 9. [Google Scholar]
- 24.Green S, Schlegel J. Medical Implant Applications. Lancashire, UK: 2001. A Polyaryletherketone Biomaterial for use. [Google Scholar]
- 25.Research Report: F04-1014, Interlaboratory Study to Establish Precision Statements for ASTM F2077. West Conshohocken, PA: 2014. [Google Scholar]
- 26.ASTM F2077-17. Test Methods For Intervertebral Body Fusion Devices. ASTM International; West Conshohocken, PA: 2017. [Google Scholar]
- 27.ISO/IEC 17025:2005. General requirements for the competence of testing and calibration laboratories International Organization for Standardization. Geneva, Switzerland: 2017. [Google Scholar]
- 28.H T, R P. A new method for the model-independent assessment of thickness in three-dimensional images. Journal of Microscopy. 1997;185(1):67. [Google Scholar]
- 29.ASTM F2778-09(2015) Standard Test Method for Measurement of Percent Crystallinity of Polyetheretherketone (PEEK) Polymers by Means of Specular Reflectance Fourier Transform Infrared Spectroscopy (R-FTIR) ASTM International; West Conshohocken, PA: 2015. https://doi.org/10.1520/F2778-09R15 [Google Scholar]
- 30.Victrex. victrex_tds_450g. Lancashire, UK: 2018. [Google Scholar]
- 31.White AA, Panjabi MM. Clinical biomechanics of the spine. Lippincott; Philadelphia, PA: 1978. [Google Scholar]
- 32.Keaveny TM, Buckley JM. Spine Technology Handbook. Academic Press; Burlington, MA: 2006. Chapter 4 - Biomechanics of Vertebral Bone; p. 63. [Google Scholar]
- 33.Wilke HJ, Neef P, Caimi M, Hoogland T, Claes LE. New in vivo measurements of pressures in the intervertebral disc in daily life. Spine. 1999;24(8):755. doi: 10.1097/00007632-199904150-00005. [DOI] [PubMed] [Google Scholar]
- 34.Melkerson M, Kirkpatrick J, Griffith S. Spinal Implants: Are We Evaluating Them Appropriately? ASTM International; West Conshohocken, PA: 2003. [Google Scholar]
- 35.Chen RK, Lo TT, Chen L, Shih AJ. Nano-CT Characterization of Structural Voids and Air Bubbles in Fused Deposition Modeling for Additive Manufacturing(56826) 2015 V001T02A071. [Google Scholar]
- 36.Rybachuk M, Alice Mauger C, Fiedler T, Öchsner A. Anisotropic mechanical properties of fused deposition modeled parts fabricated by using acrylonitrile butadiene styrene polymer, in. Journal of Polymer Engineering. 2017;699 doi: 10.1515/polyeng-2016-0263. [DOI] [Google Scholar]
- 37.Sung-Hoon A, Michael M, Dan O, Shad R, Paul KW. Anisotropic material properties of fused deposition modeling ABS. Rapid Prototyping Journal. 2002;8(4):248. [Google Scholar]
- 38.Sobieraj MC, Rimnac CM. PEEK Biomaterials Handbook. William Andrew Publishing; Oxford, UK: 2012. Chapter 5 - Fracture, Fatigue, and Notch Behavior of PEEK A2 - Kurtz, Steven M; p. 61. [Google Scholar]
- 39.Jaekel D, Medel FJ, Kurtz SM. Validation of crystallinity measurements of medical grade PEEK using specular reflectance FTIR-microscopy. ANTEC. 2009:2511. [Google Scholar]
- 40.Jaekel DJ, MacDonald DW, Kurtz SM. Characterization of PEEK biomaterials using the small punch test. J Mech Behav Biomed Mater. 2011;4(7):1275. doi: 10.1016/j.jmbbm.2011.04.014. [DOI] [PubMed] [Google Scholar]