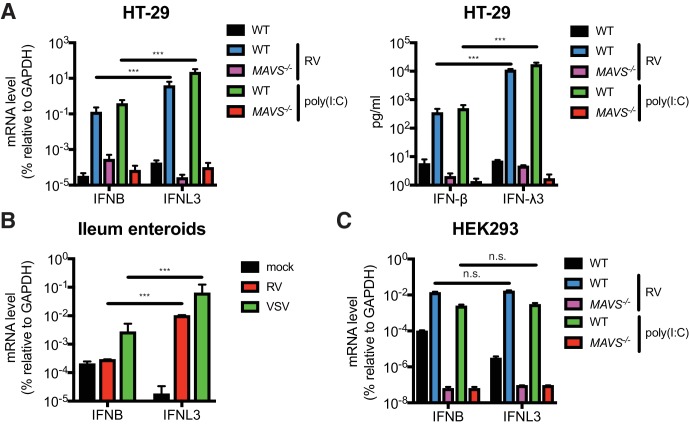
Figure 1. IECs predominantly produce type III IFN in response to RNA PAMP.
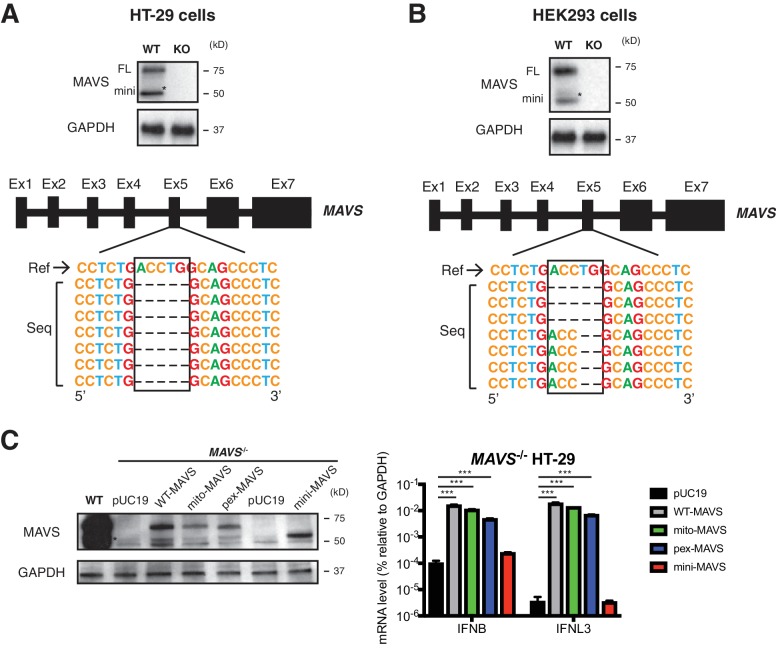
(A) WT and MAVS-/- HT-29 cells were stimulated with low molecular weight (LMW) poly (I:C) (200 ng/ml) or infected with the simian RV RRV strain (MOI = 1) for 24 hr. Expression of IFN-β and IFN-λ mRNA was measured by RT-qPCR and normalized to GAPDH expression. The supernatant of infected cells was harvested and IFN protein secretion was measured by ELISA. Clonal MAVS knockout was confirmed by western blot and Sanger sequencing. See Figure 1—figure supplement 1 for genomic sequences and Supplementary file 2 for sgRNA sequences. (B) Human intestinal enteroids were infected with VSV-GFP (MOI = 5) or the human RV WI61 strain (MOI = 5) for 16 hr. Expression of IFN-β and IFN-λ expression was measured by RT-qPCR and normalized to that of GAPDH. (C) WT and MAVS-/- HEK293 cells were stimulated with LMW poly (I:C) (200 ng/ml) or infected with RRV (MOI = 1) for 24 hr. Expression of IFN-β and IFN-λ expression was measured by RT-qPCR and normalized to that of GAPDH. For all figures, experiments were repeated at least three times with similar results. Data are represented as mean ± SEM. Statistical significance is determined by Student’s t test (*p≤0.05; **p≤0.01; ***p≤0.001).


