Abstract
Purpose
Uneven flow distribution in patients with Fontan circulation is suspected to lead to complications. 4D flow MRI offers evaluation using time-resolved pathlines; however, the potential error is not well understood. The aim of this study was to systematically assess variability in flow distribution caused by well-known sources of error.
Methods
4D flow MRI was acquired in 14 patients with Fontan circulation. Flow distribution was quantified by the % of caval venous flow pathlines reaching the left and right pulmonary arteries. Impact of data acquisition and data processing uncertainties were investigated by 1) probabilistic 4D blood flow tracking at varying noise levels; 2) down-sampling to mimic acquisition at different spatial resolutions; 3) pathline calculation with and without eddy current correction and; 4) varied segmentation of the Fontan geometry to mimic analysis errors.
Results
Averaged among the cohort, uncertainties accounted for flow distribution errors from noise ≤3.2%, low spatial resolution ≤2.3–3.8%, eddy currents ≤6.4% and inaccurate segmentation ≤3.9–9.1% (dilation and erosion, respectively). In a worst case scenario (maximum additive errors for all 4 sources) flow distribution errors were as high as 22.5%.
Conclusion
Inaccuracies related to postprocessing (segmentation, eddy currents) resulted in the largest potential error (≤15.5% combined) while errors related to data acquisition (noise, low spatial resolution) had a lower impact (≤5.5%–7.0% combined). While it is unlikely that these errors will be additive or affect the identification of severe asymmetry, these results illustrate the importance of eddy current correction and accurate segmentation to minimize Fontan flow distribution errors.
Keywords: Fontan circulation, congenital heart disease, 4D flow MRI, flow distribution, velocity noise, background phase errors, segmentation, probabilistic tracking, uncertainty
Introduction
Congenital heart disease (CHD) is the most common birth defect, affecting 0.9% of all live births (1). Single ventricle physiology is one of the most severe forms of CHD. These patients are born with only one fully functioning ventricle (e.g. hypoplastic heart syndrome, tricuspid atresia, double inlet left ventricle) and typically undergo multiple palliative vascular surgical procedures to achieve the Fontan circulation (2,3): venous return from the upper and lower body, i.e. superior vena cava (SVC) flow and inferior vena cava (IVC) flow, is routed directly to the lungs via connections with the left and right pulmonary arteries (LPA, RPA). Despite surgical success, it is unclear why some patients develop “failing Fontan” (impaired cardiac output, oxygen saturation, exercise capacity) while others remain asymptomatic (4). In this context, uneven distribution of venous return from the lower body (i.e. via the IVC) to the LPA and RPA is suspected to cause pulmonary arteriovenous malformations, leading to negative outcomes (5–10). Specifically, IVC blood carries a “hepatic factor” produced in the liver, hypothesized to protect against the development of complications in the lung vasculature. Malformations tend to form in the lungs when hepatic venous blood flow has been excluded from the pulmonary circulation (e.g. after the Glenn or Kawashima procedure) and tend to resolve after the re-inclusion of hepatic venous flow (i.e. after Fontan completion surgery). Recent studies (11–13) have shown that 4D flow MRI is uniquely suited to study this complex disease and to quantify uneven flow distribution asymmetry (% flow to LPA or RPA) at the Fontan connection. However, previous 4D flow MRI studies have assessed Fontan flow distribution using blood flow visualization based on time-resolved 3D pathlines and did not account for underlying inaccuracies associated with data acquisition and postprocessing as summarized in Table 1.
Table 1.
Summary of Potential Error Sources in flow distribution quantification
| Potential Sources of Error | Source Type | Primary Error Type* | Potential Impact | How feasible is it to test with the data at our center as of May 2018? |
|---|---|---|---|---|
| low spatial resolution | technical | accuracy | unknown | feasible: down-sample the high resolution datasets to see the effects |
| low temporal resolution | technical | accuracy | temporal blurring of pathlines | not feasible: this would require acquiring high-temporal resolution data |
| measurement noise | technical | precision | unknown | feasible: add random noise to the velocity datasets to evaluate the effects of noise |
| background phase errors | technical | accuracy | pathlines trajectory error | feasible: simulate background phase error and test the effects on flow distribution |
|
| ||||
| patient “bulk” motion | physiologic | accuracy | unknown | not feasible: this is highly patient and scan specific, requires repeat scanning |
| respiratory motion | physiologic | accuracy | unknown | |
| heart rate variability | physiologic | accuracy | likely low | |
|
| ||||
| inter-observer variability | analysis | precision | low due to automated nature of quantification | feasible: previously found to have good agreement (13) |
| intra-observer variability | analysis | accuracy | likely low | feasible: but due to the highly automated nature of quantification, this is not a key study to perform |
| Fontan segmentation | analysis | accuracy | unknown | feasible: test the effects of segmentation by dilating/eroding the existing segmentations |
Note, the term “accuracy” relates to errors resulting in a systematic bias while “precision” relates to random effects, e.g. from noise (31).
The purpose of the study was to systematically assess the effects of noise and other potential error sources on the quantification of flow distribution measurements in patients with Fontan circulation. Recently, a new approach utilizing probabilistic 4D blood flow tracking (14,15) has been presented that directly integrates local estimates of velocity noise into the analysis to report the level of statistical accuracy in flow visualization. In addition to noise-related uncertainties, we selected error sources (see Table 1) that had an unknown impact on Fontan flow distribution and were feasible to test with the given data (i.e. low spatial resolution, background phase errors (16) and Fontan segmentation). We hypothesized that 4D flow MRI can be reliably employed to quantify Fontan flow distribution even with these potential errors taken into account.
Methods
Theory
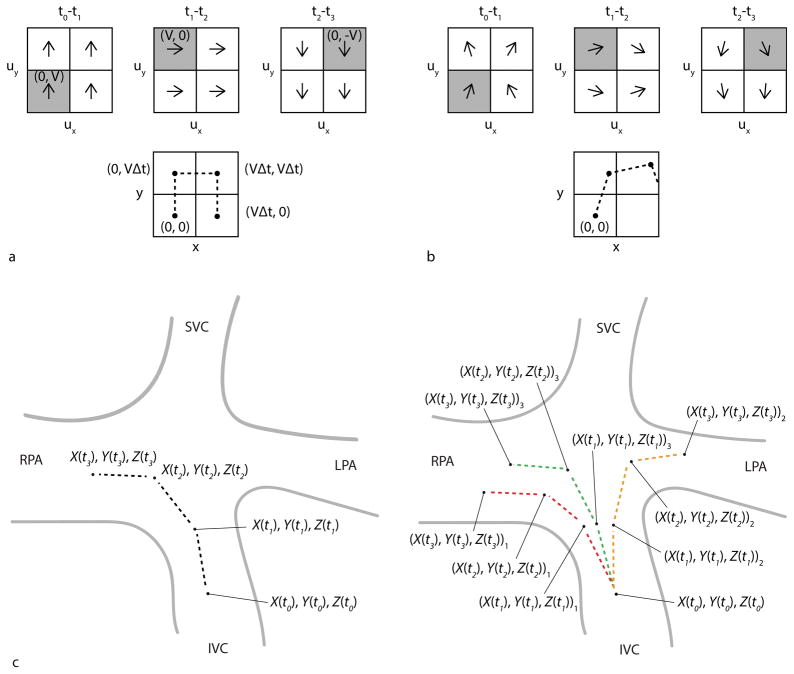
Pathlines are time-resolved particle traces that display the spatial trajectory (X, Y, Z) of an emitted virtual mass-less particle in a time-resolved 3D velocity vector field (ux, uy,uz) as it flows along at time t (Figure 1a). The change in the position of the particle over some time interval Δt is described as (17)
Figure 1.
Particle trace pathlines. a) Idealized pathline calculation. Top: Simplified 2D velocity field (ux, uy) with constant velocity magnitude V and changing velocity direction for 3 successive time-frames, t0-t1, t1-t2 and t2-t3, in a region containing 4 voxels. Bottom: A time-resolved pathline is emitted from location (X(t0), Y(t0)) = (0, 0) where ux (X(t0) = 0, Y(t0)=0, t0-t1) = 0 and uy (X(t0) = 0, Y(t0)=0, t0-t1) = V. This results in particle motion to (0, VΔt) where Δt is the time between frames. Thus at t1 the particle has traversed to location (X(t1), Y(t1)) = (0, VΔt) where ux (X(t1) = 0,Y(t1) = VΔt, t1-t2) = V and uy (X(t1) = 0,Y(t1) = VΔt, t1-t2)= 0. Stepping through each time-frame, the resulting pathline trajectory (X(t), Y(t)) is shown by the dashed line. Note the voxels of the velocity field used to determine the pathline trajectory for each time-frame are shaded gray. b) Noise added to the velocity field generates a probabilistic pathline from the same emitter location. c) Schematic illustration of probabilistic flow tracking approach in Fontan circulation for one emitter point (X(t0), Y(t0), Z(t0)). Left: The dashed lines represent the pathline trajectory for 3 successive time-frames. When velocity noise is not considered, there is only one possible flow pathway from this emitter point. Right: To see the effects of varying local measurement uncertainty, random time-varying velocity noise is added to the velocity data field for three repeat trajectory calculations (experiments), i=1 to Nexp = 3, using a Monte Carlo simulation approach. For the same emitter point, multiple probabilistic pathlines are thus generated (i.e. the red, orange and green dashed lines are the pathlines generated from experiments 1, 2 and 3, respectively). The resulting locations are labeled as (X(t), Y(t), Z(t))i corresponding to the location at time t during experiment number i.
| (1) |
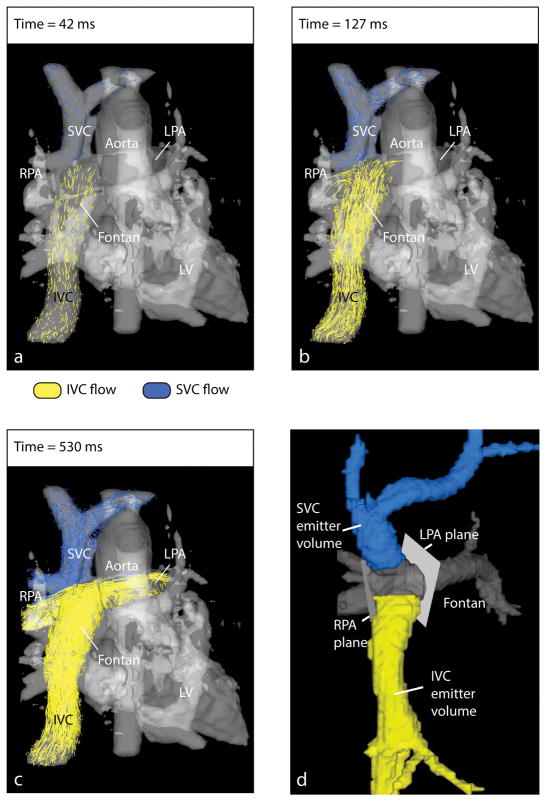
where the velocity components ux, uy and uz are determined by the position (X(t), Y(t), Z(t)) and time t. Thus, the position at time t + Δt depends on the previous position, at time t, plus some distance traveled during Δt. To visualize flow distribution at the Fontan connection, pathlines are released from multiple emitter points in the caval veins as shown for an example Fontan patient in Figure 2a–c.
Figure 2.
Fontan flow visualization and distribution analysis. a–c) To visualize the distribution of blood flow originating in the caval veins (i.e. IVC and SVC) into the pulmonary arteries (i.e. LPA and RPA), time-resolved particle trace pathlines are emitted from locations in the IVC and SVC. The time-averaged PC-MRA (gray) depicts the cardiovascular anatomy. d) Fontan flow distribution analysis volumes and planes. The Fontan volume is shown in gray. The IVC and SVC volumes were separated from the Fontan volume to be used as emitter volumes. Analysis planes in the LPA and RPA were placed close to the Fontan connection to capture flow pathlines reaching either vessel.
When a pathline is released from emitter point (X(t0), Y(t0), Z(t0)) at initial time t0, only one unique flow trajectory is determined (Figure 1c: left). To fully account for the inherent noise-related uncertainties in 4D flow MRI data, 4D probabilistic flow tracking (14,15) is based on the distribution of possible flow trajectories. Since a theoretical derivation of the distribution is difficult due to high dimensionality and the recursive nature of pathlines, the alternative approach of Monte Carlo (18) simulation is utilized. Randomly sampled velocity noise is added to all voxels and time-frames of the velocity data field for multiple repeat trajectory calculations (experiments Nexp). When noise is taken into account at each spatio-temporal step (Figure 1b), multiple resulting positions can be generated and a number of possible flow trajectories, or probabilistic pathlines, can originate from a single emitter point (Figure 1c: right). Importantly, variations in the trajectory of a probabilistic pathline can propagate through time because the location after any given time-step depends on the noise-varying velocity vector of the voxels in all previous time-steps.
Study Cohort
4D flow MRI was acquired in 14 patients (age: 17±7, 8 to 30 years, 6 females) with Fontan circulation (8 extracardiac, 6 lateral tunnel). The time between Fontan completion and the 4D flow MRI acquisition was 13±6, range=4–18 years. Institutional Review Board (IRB) approval was obtained for this HIPAA compliant study and informed consent was obtained from all participants for this prospective evaluation.
MR Image Acquisition
All patients underwent standard-of-care cardiac MRI (1.5 T, Avanto, Aera, Siemens, Germany) with administration of contrast agent (0.12 ml/kg gadofosveset trisodium, Lantheus Medical Imaging, Inc., N. Billerica, MA) as well as free-breathing navigator and cardiac gated 4D flow MRI (19). Imaging parameters for 4D flow MRI: spatial resolution = 1.9–3.6 × 1.3–2.5 × 1.9–3.3 mm3, whole heart coverage (FOV = 250–320 × 141–280 mm2, slab thickness = 96–147 mm), temporal resolution = 32.2–44.0 ms, TE = 2.4–3.2 ms, TR = 4.6–5.7 ms, 10–24 phases, flip angle = 7–15°, bandwidth = 450–800 Hz/pixel, velocity sensitivity (venc) = 0.7–1.5 m/s. The venc was typically set to optimize flow in the Fontan baffle but would have been increased if stenosis was suspected for vessels in the imaging volume. Imaging acceleration by generalized auto-calibrating partially parallel acquisition (GRAPPA, R=2) (20) was used for 6 patients until spatio-temporal (k–t) GRAPPA (R=5) (21,22) became available for 8 patients. Total 4D flow MRI scan time was 10 ± 4 minutes, range = 4 to 18 minutes.
Image Analysis
The 4D flow MRI velocity data were analyzed according to a previously described pre-processing workflow (23), i.e. corrected for Maxwell terms, eddy currents, noise masking of areas outside of flow regions, and velocity aliasing (24,25). A time-averaged 3D phase contrast angiogram (PC-MRA) was calculated to depict vessel anatomy (26). The Fontan volume was segmented from the PC-MRA and further divided into the SVC and IVC (Mimics Innovation Suite; Materialise, Leuven, Belgium). The SVC and IVC volumes were selected to include the entire region of caval flow leading up to the Fontan connection (Figure 2d). The manual steps in the data analysis workflow included selection of pre-processing settings (i.e. thresholds for eddy current correction and noise-masking, level of antialiasing), segmentation of the Fontan volume from the PC-MRA and placement of analysis planes in the pulmonary arteries.
Systematic Assessment of 4D flow Data Uncertainties of Fontan Flow Distribution
The effects of potential error sources were simulated and flow distribution was quantified using pathline calculation. These results were compared to the traditional flow distribution results (i.e. evaluated at σ=0 m/s). Note that % flow to the LPA + % flow to the RPA = 100% by definition so only one side needs to be evaluated to understand these errors. Results for % flow to LPA are given. Analysis was performed for both IVC and SVC flow.
Noise + probabilistic mapping
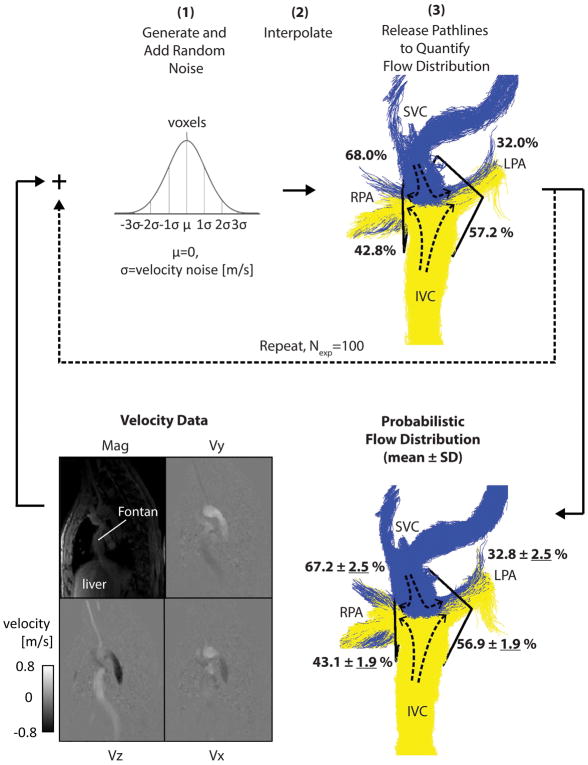
The probabilistic flow tracking simulation was developed in-house (Figure 3–Figure 4) (Matlab; The MathWorks, Natick, Massachusetts, USA). For calculating probabilistic pathlines, the simulation steps were as follows— Step 1: Random Gaussian time-varying noise (μ = 0, σ = velocity noise) was generated and added to the 4D datasets independently for each velocity direction (i.e. ux, uy and uz) to generate noisy velocities uxσ, uyσ and uzσ. Step 2: The velocity datasets were masked by the Fontan volume and interpolated to refine the intervals of the 4D grid to 1.5 mm voxels and by a factor of 2 in time. Step 3: Pathlines were emitted from the IVC and SVC volumes (number of emitters: Nem = 30 emitters per cm3 at each time-frame) into the Fontan volume, utilizing uxσ, uyσ and uzσ for trajectory calculations. The change in the position (Xσ, Yσ, Zσ) of the particle over the time interval Δt was then determined by
Figure 3.
Probabilistic flow distribution quantification. For an example patient, the simulation is shown with σ = 0.06 m/s as input. After completing steps 1–3, the first experiment is shown (top right). Steps 1–3 are repeated multiple times (Nexp=100) to give the final probabilistic flow distribution result (bottom right) where uncertainty values (in % flow distribution) are underlined.
Figure 4.
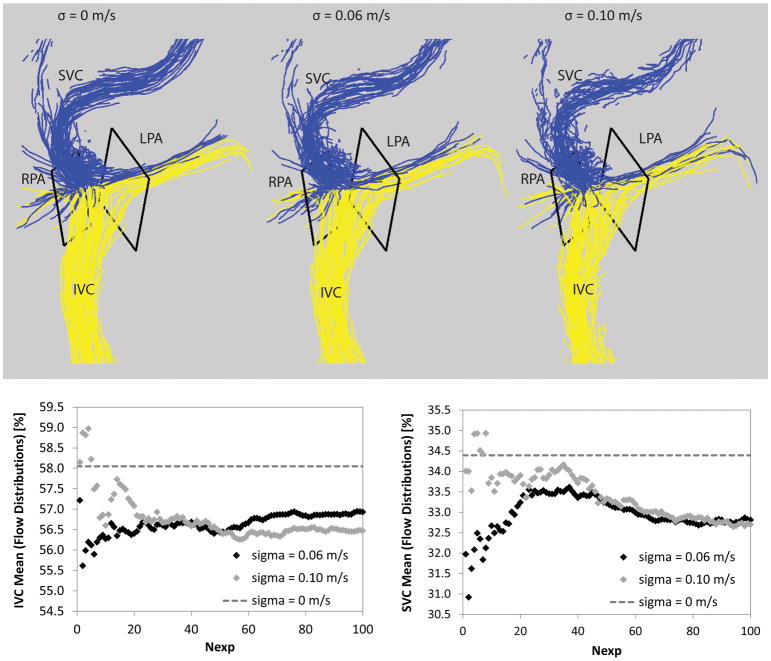
Top: Pathlines without and with noise added. Traditional pathlines are shown on the left (σ = 0 m/s). For comparisons, probabilistic simulations are shown with different noise levels, i.e. σ = 0.06 m/s (middle) and σ = 0.10 m/s (right). Bottom: The mean flow distribution is shown as the experiments were completed from 1 to Nexp=100 at two different noise levels (i.e. σ = 0.06 m/s and σ = 0.10 m/s) for the IVC (left) and SVC (right) simulations.
| (2) |
Steps 1–3 were repeated for multiple experiments, Nexp = 100, each with newly generated random time-varying Gaussian noise applied. For each experiment, the flow distribution was quantified as the number of pathlines reaching analysis planes in the RPA or LPA (i.e. placed close to the Fontan connection), normalized to the total number reaching either side. The probabilistic flow distribution was then determined as the mean ± standard deviation (SD) over all Nexp experiments. SD was used as the measure of flow distribution uncertainty.
The simulation described above was run with σ = 0.02, 0.04, 0.06, 0.08, and 0.10 m/s, corresponding to velocity noise levels of 2%, 4%, 6%, 8% and 10% of a typical venc of 1 m/s. The purpose was to systemically investigate the behavior of the pathline calculations as velocity noise levels increase. Thus, for each of the 14 patients, the probabilistic flow distribution was calculated 5 times (i.e. one for each noise level), each with Nexp = 100 experiments.
For each patient dataset, the true patient-specific velocity noise was estimated as the standard deviation of the velocity in a volume of static tissue. A volume of interest covering 10 slices in the liver was identified using magnitude images. This volume of interested was then applied to mask velocities ux, uy and uz. The standard deviation of the velocities in this volume of interest, across all time-frames and all velocity directions, was then calculated as the patient-specific estimation of velocity noise. This value was used to determine the associated patient-specific probabilistic flow distribution by interpolating among the simulated results.
Spatial resolution
A subset of patients was identified with at least 3.0 mm acquired spatial resolution in all directions (i.e. n=5: 1.9–3.0 × 1.3–1.9 × 1.9–2.5 mm3). The acquired data was down-sampled to 3.0 mm and 3.5 mm isotropic resolution. Using the down-sampled data, new pathlines were calculated and the resulting flow distributions were compared to the traditional results (i.e. using the true acquired spatial resolution).
Eddy currents
After correcting for background phase errors from Maxwell terms and concomitant gradients during image reconstruction, phase errors due to eddy currents remain a critical consideration (16). Thus to understand the magnitude of the related error, all Fontan patients were evaluated without any correction for eddy current induced phase offset errors. Pathlines were calculated and the resulting flow distributions were compared to the traditional results (i.e. utilizing linear slice-wise eddy current correction with a user-optimized threshold setting for the identification of static tissue).
Fontan segmentation
The effects of systematic underestimation and overestimation of the Fontan segmentation was investigated. For all Fontan patients, 2 additional segmentations were generated (i.e. using 3D erosion by 1 voxel with 6-connectivity and dilation by 1 voxel with 6-connectivity) and used as the new anatomical bounds for pathline calculation. Flow distribution was quantified and compared to the traditional results (i.e. using the manually segmented Fontan volume).
Statistical Analysis
The Wilcoxon rank sum test was used to compare maximum noise-related uncertainties in flow distribution from data acquired with GRAPPA R=2 and R=5 and medians and p-values were reported. To determine the effects of low spatial resolution, eddy currents and inaccurate Fontan segmentation on flow distribution, Bland-Altman analysis (27) was performed, giving the mean difference (d̄) and limits of agreement (d̄ ± 1.96 * dstd standard deviation of the differences). In addition, root mean square error was calculated as where yi was the measured value for caval flow distribution i, ỹi the value after simulation of potential error sources for caval flow distribution i, and N the total number of IVC and SVC flow distributions evaluated (i.e. twice the number of patients included).
Results
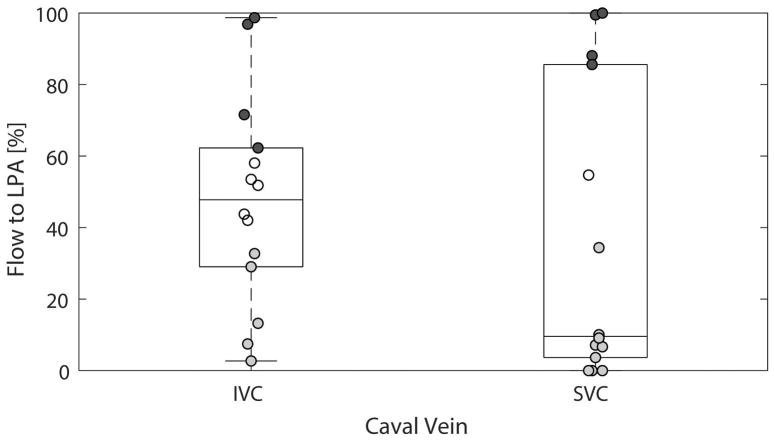
The findings for flow distribution for all patients based on traditional pathlines, i.e. σ=0 m/s so no noise added in the simulation, are shown (Figure 5). Four patients had preferential (i.e. absolute difference between flow distribution to the LPA and RPA ≥ 20%) IVC flow to the LPA, 5 patients had preferential IVC flow to the RPA and 5 patients had non-preferential IVC flow. Four patients had preferential SVC flow to the LPA, 9 patients had preferential SVC flow to the RPA and one patient had non-preferential SVC flow.
Figure 5.
Traditional pathlines results (i.e. σ = 0 m/s). Boxplots and scatterplots (i.e. showing each data point) are shown. The data points showing preferential flow, i.e. absolute difference between flow distribution to the LPA and RPA is ≥20%, are shaded (dark gray = to the LPA, light gray = to the RPA).
The processing time for the probabilistic simulation for each patient was typically 2 hours for each emitter volume and each noise level. The simulation time was mainly limited by the 4D interpolation step which occurs at every experiment (i.e. Nexp = 100). There was one case, Patient 4: SVC flow, where for a small number of experiments (i.e. 1/100, 1/100 and 3/100 experiments for simulations at σ = 0.06, 0.08 and 0.10, respectively) no pathlines reached either the LPA or RPA, and so these 5 experiments were ignored.
Noise-related Effects
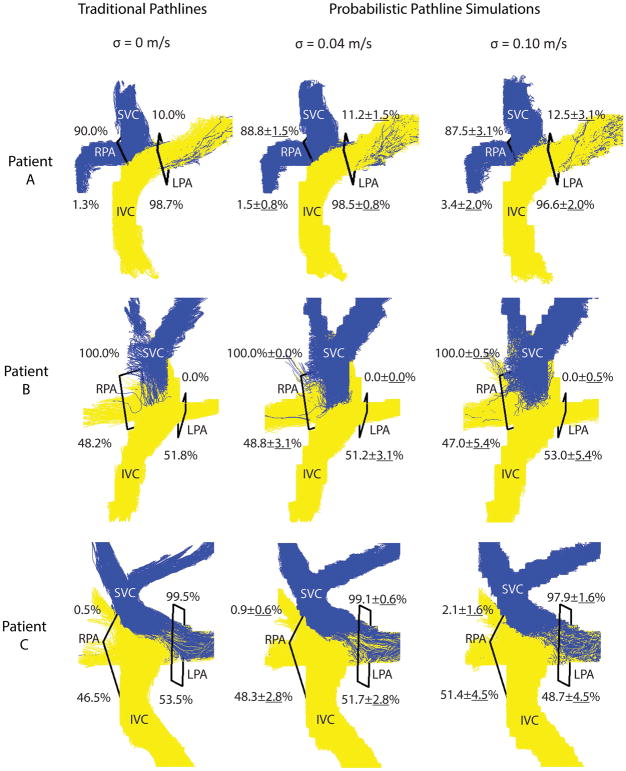
Examples are shown of traditional and probabilistic pathlines for three patients (Figure 6). When analyzing the data using traditional pathlines, i.e. no noise was added (left column), the first patient (top row) had preferential IVC flow to the LPA, and other two patients had non-preferential IVC flow. The last patient (bottom row) had preferential SVC flow to the LPA and the other two patients had preferential SVC flow to the RPA. When noise was added in the simulations, the uncertainty in flow distribution increased and more noise in the pathline visualizations can also be appreciated. Taking into account the resulting uncertainties due to noise, preferential flow remained the same in these cases.
Figure 6.
Flow distribution results. Traditional pathlines (left) and probabilistic simulation results at two noise levels (σ = 0.04 m/s: middle, σ = 0.10 m/s: right) are shown for three patients: A, B and C = 3, 4 and 12, respectively). For each noise level, the flow distribution results (in %) for all 100 experiments are reported and the probabilistic pathlines from 5 experiments are visualized.
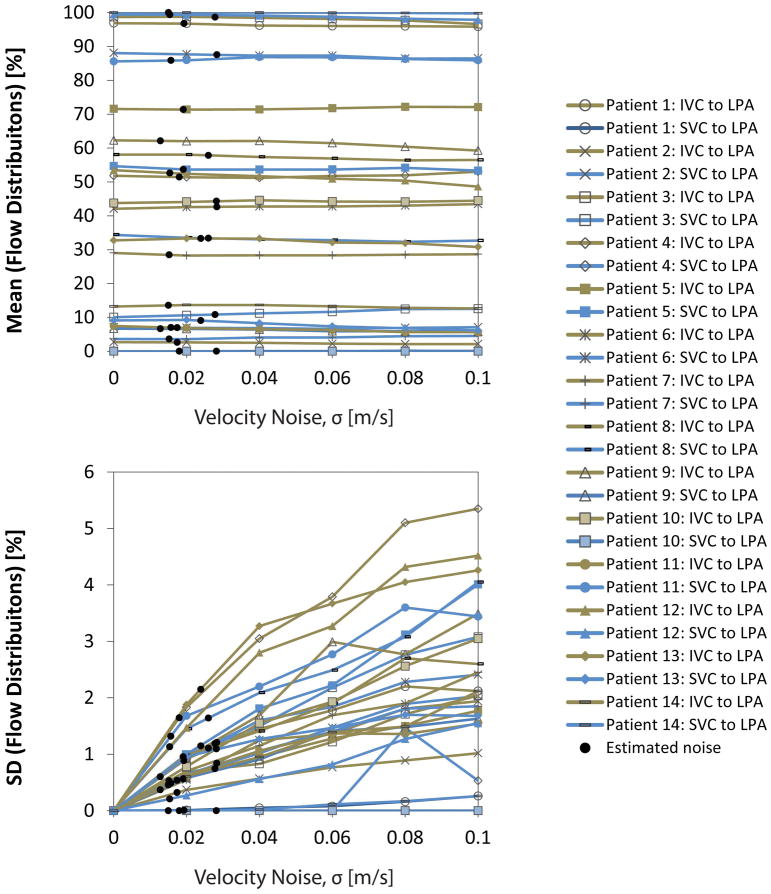
Figure 7 shows the results for the mean and SD of the flow distributions for all IVC and SVC flow simulations. The mean flow distribution (see Figure 7a) remained consistent across noise levels, with absolute changes of 1.5 ± 1.1 [0.0 4.8] %—the largest change (i.e. 4.8%) was seen in Patient 12: IVC flow to the LPA where the mean went from 53.5% (traditional pathlines, i.e. σ = 0 m/s) to 48.7% (σ = 0.10 m/s). The uncertainty of flow distributions (see Figure 7b) ranged from none to 5.4%—the smallest uncertainty (i.e. none) was seen in Patient 10: SVC flow where no pathlines emitted from the SVC reached the LPA during the simulations and the largest uncertainty was seen in Patient 4: IVC flow to the LPA where SD was 5.4% (σ = 0.10 m/s).
Figure 7.
Probabilistic flow distribution results with increasing levels of added velocity noise (i.e. none to 10% of typical venc). For each patient, the mean of the % flow distributions (i.e. among experiments during simulation at each noise level) is reported (top) and the uncertainty, or standard deviation (bottom). For simplicity, only the flow distribution to the LPA is shown because flow distribution is normalized and so the % flow to the RPA is equal to 100% minus this value. Patient-specific results (noted by black circles) were interpolated among these data at the level of patient-specific velocity noise.
Comparing scans acquired with R=2 to those acquired with R=5 at simulated noise levels, there was no significant difference between the maximum uncertainty in flow distributions for IVC and SVC combined (2.0% vs 2.3%, p=0.73) or for IVC (2.0% vs 2.9%, p=0.18) or SVC alone (2.2% vs 1.7%, p=0.59).
Estimated velocity noise levels were 2.2 ± 0.7 [1.2 3.5] % of the venc for each patient (Table 2). At the estimated noise level for each patient, the change in mean flow distribution from the no noise added case was within 1.0% and uncertainty was ≤2.2%, resulting in a combined potential error of 3.2%.
Table 2.
Estimated in-vivo velocity noise and associated probabilistic flow distribution
| Patient | Estimated Velocity Noise [m/s] | Estimated Velocity Noise [% of venc] | IVC Flow to LPA [%] | SVC Flow to LPA [%] |
|---|---|---|---|---|
| 1 | 0.019 | 1.9 | 96.8 ± 0.9 | 0.0 ± 0.0 |
| 2 | 0.017 | 1.7 | 2.6 ± 0.3 | 7.0 ± 0.5 |
| 3 | 0.028 | 1.9 | 98.6 ± 0.7 | 10.8 ± 1.2 |
| 4 | 0.018 | 1.2 | 51.4 ± 1.6 | 0.0 ± 0.0 |
| 5 | 0.019 | 1.9 | 71.4 ± 0.6 | 53.7 ± 1.0 |
| 6 | 0.028 | 2.8 | 42.6 ± 0.8 | 87.5* ± 1.2 |
| 7 | 0.015 | 1.5 | 28.4 ± 0.5 | 3.6 ± 0.5 |
| 8 | 0.026 | 3.3 | 57.8 ± 1.1 | 33.4 ± 1.6 |
| 9 | 0.013 | 1.6 | 62.1 ± 0.6 | 6.6 ± 0.4 |
| 10 | 0.028 | 3.5 | 44.3 ± 1.1 | 0.0 ± 0.0 |
| 11 | 0.016 | 2.0 | 7.0 ± 0.5 | 85.9 ± 1.3 |
| 12 | 0.015 | 2.2 | 52.6 ± 1.1 | 99.4 ± 0.2 |
| 13 | 0.024 | 3.0 | 33.3 ± 2.2 | 9.1 ± 1.1 |
| 14 | 0.015 | 1.9 | 13.6 ± 0.5 | 100.0 ± 0.0 |
SVC flow includes hemiazygous vein flow into the Fontan connection.
Spatial Resolution, Eddy Currents and Segmentation Effects
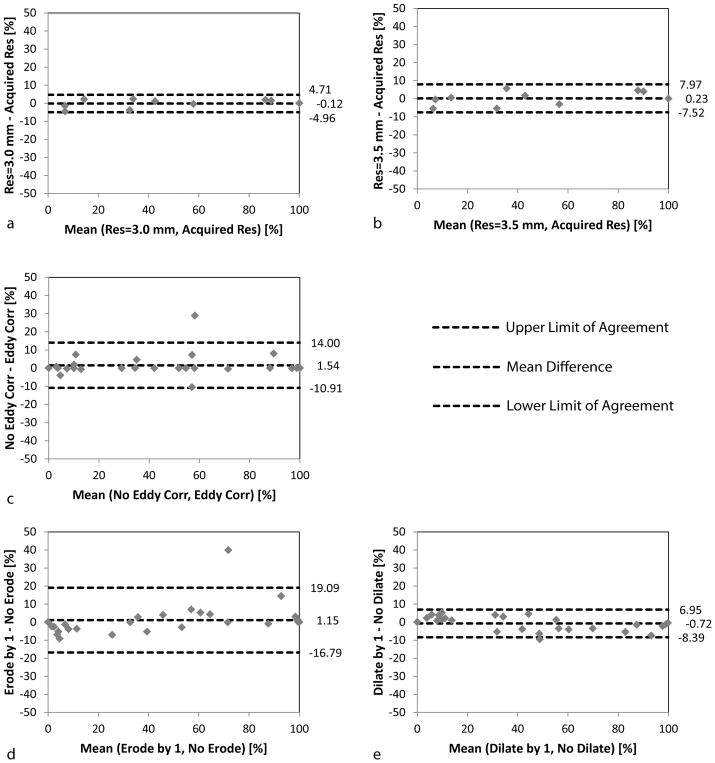
The results simulating other potential errors sources are shown as Bland-Altman plots with the mean difference and limits of agreement reported (Figure 8). Errors in flow distribution increased from RMSE=2.3% to 3.8% as the acquired spatial resolution was down-sampled to 3.0 mm and 3.5 mm, respectively. In addition, variations were observed due to eddy currents (RMSE=6.4%) and with Fontan segmentation erosion (RMSE=9.1%) or dilation (RMSE=3.9%). When evaluating SVC flow for patient 4 with Fontan erosion, no pathlines reached either the RPA or LPA and this quantification was not included in the erosion study.
Figure 8.
Bland-Altman plots for simulated error sources. The potential effects of low spatial resolution (a–b), phase background errors (c) and Fontan segmentation (d–e) are shown. These errors were simulated and the flow distribution was evaluated independent of added measurement noise (i.e. at σ=0 m/s) and compared to the original results (i.e. also at σ=0 m/s but evaluated at the acquired resolution, with eddy current correction and the manually segmented Fontan). The results both for SVC and IVC flow are included. Again for simplicity (and as in Figure 7), only % flow to the LPA is shown.
Combining Errors
Patient-specific errors in flow distribution from data acquisition-related effects (noise, spatial resolution) could be as high as 3.2% for noise (i.e. uncertainty 2.2% + change in mean 1.0%) and as high as 3.8% for low spatial resolution, for a combined effect of up to 7.0% (i.e. 3.2% + 3.8%). In addition, data processing-related sources (eddy currents, Fontan segmentation) introduced combined errors as high as 15.5% (i.e. 6.4% + 9.1%). Thus, the resulting worst-case Fontan flow distribution error was as high as 22.5 %.
Discussion
After investigating sources of potential error in Fontan flow distribution, inaccuracies associated with post-processing (vessel segmentation, eddy currents) resulted in the highest flow distribution error (i.e. as high as 15.5% combined) while data acquisition sources (noise, low spatial resolution) had a much lower impact (i.e. as high as 5.5%–7.0% combined). With all of these factors working together, the maximum resulting error was as high as 22.5%. Preferential caval flow has been previously considered when the absolute difference between flow distribution to the LPA and RPA is ≥20% (11,13,28). Thus, understanding the variability in flow distribution quantification is important for identifying preferential vs. non-preferential flow. While it is unlikely that these errors would be entirely additive or affect the ability to identify patients with severe flow asymmetry, these results point out that even at low spatial resolution and when taking into account the noise-related variability, the majority of errors in flow distribution quantification can be minimized during the analysis process by performing eddy current correction and accurate Fontan segmentation. Also, when considering potential errors from Fontan segmentation, i.e. dilation (≤3.9%) vs. erosion (≤9.1%), is better to err on the side of overestimation (i.e. dilation) of the Fontan volume than underestimation (i.e. erosion).
In a previous study from our group (29), noise was added to Fontan velocity datasets for comparing viscous dissipation measured by computational fluid dynamics and 4D flow MRI. When adding noise to the down-sampled CFD data (i.e. to simulate MRI data), a significant increase was seen in viscous dissipation (i.e. the noisy data had increased spatial gradients). However, when assessing the relative relationships between patients, the results were comparable. The approach here was different in that we were starting with 4D velocity data that was measured and thus has inherent noise. Nevertheless, even when adding high levels of noise to the velocity data the variations in flow distribution remained relatively low (i.e. uncertainty levels ≤ 5.4% for velocity noise levels at 10% of a typical venc). It makes sense that viscous dissipation would be inherently more sensitive to noise that flow distribution. In addition, flow distribution was normalized to the total number of pathlines reaching either side in order to be robust to the effects of pathline truncation (i.e. pathlines that due to noise, partial volume effects, etc. do not reach either pulmonary because they first become clipped by the vessel wall).
This study has limitations. The method for determining the estimated velocity noise in these datasets was based on the standard deviation of the velocities in volumes of interest in a region of static tissue (i.e. the liver). The results in our study were lower than those in a previous study by Friman et al. (14), e.g. 1.2–3.5% vs. 4.5% of venc, respectively. While the increase in voxel size in our study accounts for improvements in the velocity noise, additional methods to systematically assess velocity noise may be explored in future studies. We did not scan any subjects with both GRAPPA R=2 and R=5 for direct comparison in this study but the results from these techniques were found to be comparable in a previous study from our group (21). For the probabilistic simulations, using multiple repeat trajectory calculations higher than Nexp = 100 was not explored, but since there was low variation for each patient among the mean probabilistic flow distributions (i.e. see the stability across noise levels in the top of Figure 7), we believe that 100 realizations is sufficient for this study. That only Gaussian noise was applied in the simulations is a potential limitation, although with adequate signal to noise this is a reasonable approximation (15,30). The 4D velocity data was interpolated to 1.5 mm spatial resolution and by a factor of 2 in time. While a higher level of interpolation would be preferred, this study was limited due to the method of interpolation used in the simulations and the implementation and thus ran robustly for all patients using these settings. Future work will include updating the simulation to allow for a more highly refined grid to assess the impact on probabilistic tracking results. Since the purpose of this study was to assess potential errors in flow distribution quantification, a simple pathline calculation algorithm was utilized to maintain generality—the idea being that a more advanced technique will likely have built in some robustness to noise-related effects and other potential errors. Future studies should explore advanced techniques in pathline calculation.
Due to the interleaved flow imaging acquisition scheme, the temporal resolution has only certain allowable settings and ~40 ms is typically used in cardiovascular applications. Thus we did not perform a systematic down-sampling of the acquired temporal resolutions. Future studies are warranted to investigate the effects of temporal resolution by acquiring 4D flow MRI with high temporal resolution (~20 ms) to then down-sample accordingly. This will, however, take the twice the scan time and thus may not be feasible in a clinical setting. While the presented data illustrate the precision of the studied method, to gain further theoretical understanding of the ability of 4D flow MRI to accurately quantify flow distribution, a controlled phantom experiment should be utilized to acquire at high temporal and spatial resolutions to then down-sample and systematically test the effects. In addition, a more systematic analysis of potential error sources, particularly for the relatively high variations related to eddy currents and segmentation and also for the physiologic sources of inaccuracy not investigated here (i.e. bulk and respiratory motion) may be the focus of further research. Testing the effects of physiological error sources could be accomplished using repeated scans and by quantifying flow distribution from the main pulmonary artery to the left and right lung.
In conclusion, when evaluating Fontan flow distribution using 4D flow MRI, the fluctuations induced by vessel segmentation and eddy currents appeared to be the largest potential sources of error while measurement noise and low spatial resolution had a lower impact. Future work is warranted to study physiological error sources, i.e. bulk and respiratory motion, and the diagnostic impact of the current findings, i.e. how incorporating errors due to noise and other potential error sources into flow distribution quantification may help with clinical decision-making.
Acknowledgments
Grant Support
National Institutes of Health, National Heart, Lung and Blood Institute (NHLBI) (T32HL134633, R01HL115828, K25HL119608)
Footnotes
Disclosures
None
References
- 1.van der Linde D, Konings EE, Slager MA, et al. Birth prevalence of congenital heart disease worldwide: a systematic review and meta-analysis. J Am Coll Cardiol. 2011;58(21):2241–2247. doi: 10.1016/j.jacc.2011.08.025. [DOI] [PubMed] [Google Scholar]
- 2.Fontan F, Baudet E. Surgical repair of tricuspid atresia. Thorax. 1971;26(3):240–248. doi: 10.1136/thx.26.3.240. [DOI] [PMC free article] [PubMed] [Google Scholar]
- 3.Gewillig M. The Fontan circulation. Heart. 2005;91(6):839–846. doi: 10.1136/hrt.2004.051789. [DOI] [PMC free article] [PubMed] [Google Scholar]
- 4.Elder RW, Wu FM. Clinical Approaches to the Patient with a Failing Fontan Procedure. Current cardiology reports. 2016;18(5):44. doi: 10.1007/s11886-016-0716-y. [DOI] [PubMed] [Google Scholar]
- 5.Srivastava D, Preminger T, Lock JE, et al. Hepatic venous blood and the development of pulmonary arteriovenous malformations in congenital heart disease. Circulation. 1995;92(5):1217–1222. doi: 10.1161/01.cir.92.5.1217. [DOI] [PubMed] [Google Scholar]
- 6.Shah MJ, Rychik J, Fogel MA, Murphy JD, Jacobs ML. Pulmonary AV malformations after superior cavopulmonary connection: resolution after inclusion of hepatic veins in the pulmonary circulation. Ann Thorac Surg. 1997;63(4):960–963. doi: 10.1016/s0003-4975(96)00961-7. [DOI] [PubMed] [Google Scholar]
- 7.Shinohara T, Yokoyama T. Pulmonary Arteriovenous Malformation in Patients with Total Cavopulmonary Shunt: What Role Does Lack of Hepatic Venous Blood Flow to the Lungs Play? Pediatr Cardiol. 2001;22:343–346. doi: 10.1007/s002460010243. [DOI] [PubMed] [Google Scholar]
- 8.McElhinney DB, Kreutzer J, Lang P, Mayer JE, Jr, del Nido PJ, Lock JE. Incorporation of the hepatic veins into the cavopulmonary circulation in patients with heterotaxy and pulmonary arteriovenous malformations after a Kawashima procedure. Ann Thorac Surg. 2005;80(5):1597–1603. doi: 10.1016/j.athoracsur.2005.05.101. [DOI] [PubMed] [Google Scholar]
- 9.Hiramatsu T, Komori S, Nishimura Y, Okamura Y, Suzuki H, Takeuchi T. Conversion from total cavopulmonary shunt to Fontan circulation: improved cyanosis with an 11-year interval. Ann Thorac Cardiovasc Surg. 2008;14(1):29–31. [PubMed] [Google Scholar]
- 10.Sernich S, Ross-Ascuitto N, Dorotan J, DeLeon S, Ascuitto RJ. Surgical improvement of hepatic venous mixing to resolve systemic arterial hypoxemia associated with post-Fontan pulmonary arteriovenous fistulae. Texas Heart Institute journal/from the Texas Heart Institute of St Luke’s Episcopal Hospital, Texas Children’s Hospital. 2009;36(5):480–482. [PMC free article] [PubMed] [Google Scholar]
- 11.Markl M, Geiger J, Kilner PJ, et al. Time-resolved three-dimensional magnetic resonance velocity mapping of cardiovascular flow paths in volunteers and patients with Fontan circulation. European journal of cardio-thoracic surgery : official journal of the European Association for Cardio-thoracic Surgery. 2011;39(2):206–212. doi: 10.1016/j.ejcts.2010.05.026. [DOI] [PubMed] [Google Scholar]
- 12.Bachler P, Valverde I, Pinochet N, et al. Caval blood flow distribution in patients with Fontan circulation: quantification by using particle traces from 4D flow MR imaging. Radiology. 2013;267(1):67–75. doi: 10.1148/radiol.12120778. [DOI] [PubMed] [Google Scholar]
- 13.Jarvis K, Schnell S, Barker AJ, et al. Evaluation of blood flow distribution asymmetry and vascular geometry in patients with Fontan circulation using 4-D flow MRI. Pediatric radiology. 2016 doi: 10.1007/s00247-016-3654-3. [DOI] [PMC free article] [PubMed] [Google Scholar]
- 14.Friman O, Hennemuth A, Harloff A, Bock J, Markl M, Peitgen HO. Probabilistic 4D blood flow tracking and uncertainty estimation. Med Image Anal. 2011;15(5):720–728. doi: 10.1016/j.media.2011.06.002. [DOI] [PubMed] [Google Scholar]
- 15.Friman O, Hennemuth A, Harloff A, Bock J, Markl M, Peitgen HO. Probabilistic 4D blood flow mapping. Medical image computing and computer-assisted intervention : MICCAI International Conference on Medical Image Computing and Computer-Assisted Intervention. 2010;13(Pt 3):416–423. doi: 10.1007/978-3-642-15711-0_52. [DOI] [PubMed] [Google Scholar]
- 16.Busch J, Giese D, Kozerke S. Image-based background phase error correction in 4D flow MRI revisited. J Magn Reson Imaging. 2017;46(5):1516–1525. doi: 10.1002/jmri.25668. [DOI] [PubMed] [Google Scholar]
- 17.Pozrikidis C. Fluid Dynamics: Theory, Computation, and Numerical Simulation. New York, NY: Springer; 2009. [Google Scholar]
- 18.Doucet A, de Freitas N, Gordon N, editors. Sequential Monte Carlo Methods in Practice. Springer-Verlag; New York: 2001. [Google Scholar]
- 19.Markl M, Harloff A, Bley TA, et al. Time-resolved 3D MR velocity mapping at 3T: improved navigator-gated assessment of vascular anatomy and blood flow. J Magn Reson Imaging. 2007;25(4):824–831. doi: 10.1002/jmri.20871. [DOI] [PubMed] [Google Scholar]
- 20.Griswold MA, Jakob PM, Heidemann RM, et al. Generalized autocalibrating partially parallel acquisitions (GRAPPA) Magn Reson Med. 2002;47(6):1202–1210. doi: 10.1002/mrm.10171. [DOI] [PubMed] [Google Scholar]
- 21.Schnell S, Markl M, Entezari P, et al. k-t GRAPPA accelerated four-dimensional flow MRI in the aorta: effect on scan time, image quality, and quantification of flow and wall shear stress. Magn Reson Med. 2014;72(2):522–533. doi: 10.1002/mrm.24925. [DOI] [PMC free article] [PubMed] [Google Scholar]
- 22.Jung B, Ullmann P, Honal M, Bauer S, Hennig J, Markl M. Parallel MRI with extended and averaged GRAPPA kernels (PEAK-GRAPPA): optimized spatiotemporal dynamic imaging. J Magn Reson Imaging. 2008;28(5):1226–1232. doi: 10.1002/jmri.21561. [DOI] [PubMed] [Google Scholar]
- 23.Schnell S, Entezari P, Mahadewia RJ, et al. Improved Semiautomated 4D Flow MRI Analysis in the Aorta in Patients With Congenital Aortic Valve Anomalies Versus Tricuspid Aortic Valves. Journal of computer assisted tomography. 2016;40(1):102–108. doi: 10.1097/RCT.0000000000000312. [DOI] [PMC free article] [PubMed] [Google Scholar]
- 24.Bernstein MA, Zhou XJ, Polzin JA, et al. Concomitant gradient terms in phase contrast MR: analysis and correction. Magn Reson Med. 1998;39(2):300–308. doi: 10.1002/mrm.1910390218. [DOI] [PubMed] [Google Scholar]
- 25.Walker PG, Cranney GB, Scheidegger MB, Waseleski G, Pohost GM, Yoganathan AP. Semiautomated method for noise reduction and background phase error correction in MR phase velocity data. J Magn Reson Imaging. 1993;3(3):521–530. doi: 10.1002/jmri.1880030315. [DOI] [PubMed] [Google Scholar]
- 26.Bock J, Kreher BW, Hennig J, Markl M. Optimized pre-processing of time-resolved 2D and 3D Phase Contrast MRI data. 15th Annual Meeting of ISMRM; Berlin, Germany. 2007. Abstract 3138. [Google Scholar]
- 27.Bland JM, Altman DG. Statistical methods for assessing agreement between two methods of clinical measurement. Lancet. 1986;1(8476):307–310. [PubMed] [Google Scholar]
- 28.Whitehead KK, Sundareswaran KS, Parks WJ, Harris MA, Yoganathan AP, Fogel MA. Blood flow distribution in a large series of patients having the Fontan operation: a cardiac magnetic resonance velocity mapping study. J Thorac Cardiovasc Surg. 2009;138(1):96–102. doi: 10.1016/j.jtcvs.2008.11.062. [DOI] [PMC free article] [PubMed] [Google Scholar]
- 29.Cibis M, Jarvis K, Markl M, et al. The effect of resolution on viscous dissipation measured with 4D flow MRI in patients with Fontan circulation: Evaluation using computational fluid dynamics. Journal of biomechanics. 2015 doi: 10.1016/j.jbiomech.2015.07.039. BMD1500331. [DOI] [PMC free article] [PubMed] [Google Scholar]
- 30.Gudbjartsson H, Patz S. The Rician distribution of noisy MRI data. Magn Reson Med. 1995;34(6):910–914. doi: 10.1002/mrm.1910340618. [DOI] [PMC free article] [PubMed] [Google Scholar]
- 31.Kellman P, Hansen MS. T1-mapping in the heart: accuracy and precision. Journal of cardiovascular magnetic resonance : official journal of the Society for Cardiovascular Magnetic Resonance. 2014;16:2. doi: 10.1186/1532-429X-16-2. [DOI] [PMC free article] [PubMed] [Google Scholar]


