Abstract
Calcitriol, the active form of vitamin D, has been well documented to act directly on immune cells and malignant cells. Activated T cells are one of the best characterized targets of calcitriol, with effects including decreasing inflammatory cytokine output and promoting anti-inflammatory cytokine production. However, the effects of calcitriol on natural killer (NK) cells are less clear. Reports suggest that only immature NK cell populations are affected by calcitriol treatment resulting in impaired cytotoxic function and cytokine production, while mature NK cells may have little or no response. NK cell large granular lymphocyte leukemia (NK-LGLL) is a rare leukemia with CD3-CD16+CD56+ NK cell clonal expansion. The current standard treatments are immunosuppressant therapies, which are not curative. The Janus kinase (JAK) – signal transducer and activator of transcription (STAT) pathway is hyperactivated in LGLL and is one pathway of interest in new drug target investigations. We previously demonstrated the ability of calcitriol to decrease STAT1 tyrosine 701 (p-STAT1) and STAT3 tyrosine 705 (p-STAT3) phosphorylation as well as inflammatory cytokine output of T cell large granular lymphocyte leukemia cells, but did not determine the effects of calcitriol on NK-LGLL. Therefore, in the present study, we investigated whether NKL cells, a model of NK-LGLL, and NK-LGLL patient peripheral blood mononuclear cells (PBMCs) are susceptible to treatment with calcitriol or seocalcitol (EB1089), a potent analog of calcitriol. NKL cells are dependent on interleukin (IL)-2 for survival and we show here for the first time that treatment with IL-2 induced tyrosine phosphorylation of STATs 1 through 6. Both calcitriol and EB1089 caused significant upregulation of the vitamin D receptor (VDR). IL-2 induction of p-STAT1 and p-STAT3 phosphorylation was significantly decreased after calcitriol or EB1089 treatment. Additionally, IL-10, interferon (IFN)-γ, and FMS-like tyrosine kinase 3 ligand (Flt-3L) extracellular output was significantly decreased at 100 nM EB1089 and intracellular IL-10 was decreased with either calcitriol or EB1089 treatment. We treated NK-LGLL patient PBMCs with calcitriol or EB1089 and found decreased p-STAT1 and p-STAT3 while VDR increased, which matched the NKL cell line data. We then measured 75 serum cytokines in NK-LGLL patients (n=8) vs. age- and sex-matched normal healthy donors (n=8), which is the first serum cytokine study for this LGLL subtype. We identified 15 cytokines, including IL-10 and Flt-3L, which were significantly different between normal donors and NK-LGLL patients. Overall, our results suggest that activating the vitamin D pathway could be a mechanism to decrease STAT1 and 3 activation and inflammatory cytokine output in NKLGLL patients.
Keywords: calcitriol, EB1089, Flt-3L, interferon-gamma, interleukin-10, STAT proteins
Graphical Abstract
1. INTRODUCTION
Large granular lymphocyte leukemia (LGLL) is a rare cancer that accounts for 2–5% of chronic mature lymphoproliferative disorders of the T cell or natural killer (NK) cell lineage [1]. Patients with the more common subtype of this cancer exhibit an expansion of primarily CD3+CD8+CD57+ T cells (~85%), while individuals with the less common subtype exhibit an expansion of primarily CD3-CD16+CD56+ NK cells (~10%) [1]. An aggressive form of NK-LGLL is seen in <5% of LGL disorders, typically in Asia, and is associated with Epstein-Barr virus [2, 3]. Diagnosis of LGLL is established by increased lymphocyte count and confirmation of the expanded T cell or NK cell population by flow cytometry [1, 2]. T-LGLL clonality can be established by the T cell receptor (TCR) rearrangement test; however, NK cells do not express TCR, so skewed killer-cell immunoglobin-like receptors can suggest but not establish clonality [1, 2]. The chronic form of LGLL can be managed by a watch-and-wait approach, or treated with immunosuppressant therapies for symptomatic neutropenia or anemia [2]. While the immunosuppressant treatment is usually effective, it is not curative [1]. Furthermore, few clinical trials/studies have been conducted to assess these current therapies and novel agents [1]. Therefore, there is a critical need to identify new drug targets specific for LGLL, which can be accomplished by identifying the fundamental differences between the NK and T cell forms of this leukemia.
One unifying characteristic shared between NK- and T-LGLL is the augmented activity of the Janus kinase (JAK) – signal transducer and activator of transcription (STAT) pathway. Our lab has previously shown that STAT1 and STAT3 are constitutively active [4] and hyper-phosphorylated [5] in T-LGLL and that STAT3 or STAT5 can exhibit somatic activating mutations in NK- or T-LGLL [6–9]. Target genes of STATs include cytokines, thus dysregulation of the pathway can cause overproduction of cytokines [10]. The cytokines secreted from the cell can induce activation of the JAK-STAT pathway [11]; therefore, this paracrine or autocrine stimulation can promote excessive JAK-STAT signaling and production of inflammatory cytokines.
Vitamin D has gained much recognition as an immune regulator, with most of the work being done in T cells. The active form of vitamin D, 1,25-(OH)2-D3, also called calcitriol, binds the vitamin D receptor (VDR) in the cytoplasm of the cell [12]. This causes a conformational change so VDR can bind its retinoid X receptor (RXR) binding partner, and this heterodimer moves to the nucleus to promote or repress transcription of certain genes [12]. This pathway turns off activated T cells by decreasing inflammatory cytokine production and STAT phosphorylation [13–17]. We previously showed this to be the case in T-LGLL patient peripheral blood mononuclear cells (PBMCs) in culture and in the TL-1 cell line, a model of T-LGLL [5, 18]. However, there are few reports about vitamin D effects in NK cells. One report showed a link between vitamin D deficiency and lack of transcription of a vitamin D pathway gene in NK cells [19]. Moreover, mature NK function was compromised after in vitro calcitriol treatment, however this study was performed with PBMCs and not isolated NK cells [20]. Another study found that treating umbilical cord blood CD34+ cells with calcitriol in a validated NK cell differentiation model yielded fewer NK cells and that they were impaired in their cytotoxic function and cytokine production, but no such effects were seen when treating mature NK cells [21]. Although calcitriol may affect precursor cells to suppress NK cell production it is unclear if a response is always elicited once NK cells have reached maturity. Overall, the effect of calcitriol on NK cell biology is not as well-defined as T cells and additional research is needed.
The goals of this report were two-fold. First we wanted to characterize if calcitriol or its potent analog seocalcitol (EB1089) [22] could reduce JAK-STAT signaling or viability in the NKL cell line, an established model of NK-LGLL [23]. We found that interleukin (IL-2) induced phosphorylation of STATs 1 – 6 in the NKL cell line. After 24 h, p-STAT1 and p-STAT3 phosphorylation and intracellular IL-10 were decreased with either calcitriol or EB1089 treatment. In addition, IL-10, interferon (IFN)-γ, and FMS-like tyrosine kinase 3 ligand (Flt-3L) output were significantly decreased with EB1089 but not calcitriol treatment. Both treatments caused significant upregulation of the vitamin D receptor (VDR). We recapitulated these studies in NK-LGLL patient PBMCs, showing decreased p-STAT1 and p-STAT3 and increased VDR. Therefore, vitamin D pathway upregulation in leukemic NK-LGL cells can selectively deactivate the JAK-STAT pathway. We conducted a serum cytokine study on NK-LGLL patient samples that measured 75 serum cytokines in age- and sex-matched NK-LGLL patients (n=8) vs. normal healthy donors (n=8). We identified 15 significantly changed cytokines in NK-LGLL patients, including Flt-3L and IL-10. Overall, our results suggest that activating the vitamin D pathway in NKLGLL could decrease the JAK-STAT pathway signaling and corresponding inflammatory cytokine production.
2. MATERIALS AND METHODS
2.1. Human Subjects and Human Serum Samples.
All human subjects were consented and samples were studied under IRB-approved protocols for the LGL Leukemia Registry at the University of Virginia (IRB-HSR#17000 “Large Granular Lymphocyte Leukemia Registry” and IRB #17070 “Pathogenesis of Large Granular Lymphocyte Leukemia.” The samples were isolated from confirmed NK-LGLL patients who showed an expanded NK-LGL cell population with typical cell surface markers [1]. Normal control sera were generously provided through a collaborative effort with Creative Testing Solutions, Tempe, Arizona.
2.2. Research STAT mutation testing.
STAT mutation testing was performed as previously described [5]. Briefly, DNA from PBMCs was extracted on the Anaprep system (BioChain), amplified with premade primers, and submitted to Eurofins for Sanger sequencing.
2.3. Reagents.
Calcitriol (1,25-(OH)2 vitamin D3) was purchased from Cayman Chemical (Cat #71820). EB1089 was purchased from R&D Systems (Cat #3993). RIPA lysis buffer (Cat #R0278) and protease and phosphatase cocktails (Cat #P8340, Cat #P5726), were all purchased from Sigma Aldrich. All antibodies were purchased from Cell Signaling Technology. FBS was purchased from Seradigm (Cat #97068–085). IL-2 was purchased from Miltenyi Biotec (Cat #130-097-743). Clarity enhanced chemiluminescence (ECL) reagent (Cat #170–5061) and PVDF membrane and paper stacks (Cat #170–4274), were purchased from BioRad. RPMI 1640 (Cat #10–040-CV), Pierce bicinchoninic acid (BCA) protein assay kit (Cat #PI23225), and SuperSignal West Femto Maximum Sensitivity Substrate (Cat #34096) were purchased from ThermoFisher Scientific. ReBlot Plus Strong Antibody Stripping Solution 10X was purchased from Millipore Sigma (Cat #2504). Polyacrylamide gels (4–12%) were purchased from Life Technologies (Cat #NW04125BOX). The 3-(4,5-dimethylthiazol-2-yl)-5-(3-carboxymethoxyphenyl)-2-(4-sulfophenyl)-2H-tetrazolium (MTS) Cell Proliferation Colorimetric Assay Kit was purchased from BioVision (Cat #K300–2500). Molecular weight markers used in western blotting were SeeBlue Plus2 Pre-Stained Standard (ThermoFisher Scientific) and Flash Protein Ladder #51121659 and #51121660 (WorldWide Life Sciences Division).
2.4. Cell Line and Primary Cells.
The NKL cell line [23], a model of aggressive NK-LGLL, was kindly provided by Dr. Howard Young at the National Cancer Institute. It was independently authenticated using short tandem repeat DNA profiling (Genetica DNA Laboratories). PBMCs (fresh or cryo-preserved) from NK-LGLL patients were isolated by Ficoll-hypaque gradient separation as described previously [24]. Cell viability was determined by Trypan blue exclusion assay. In the PBMC experiments, all patients had >55% purity NK-LGL cells (based on blood flow cytometry data from at least one NK cell marker). In some cases, the flow cytometry data did not match the date of the sample used, so the closest clinical data to the sample date was used.
2.5. Cell Culture.
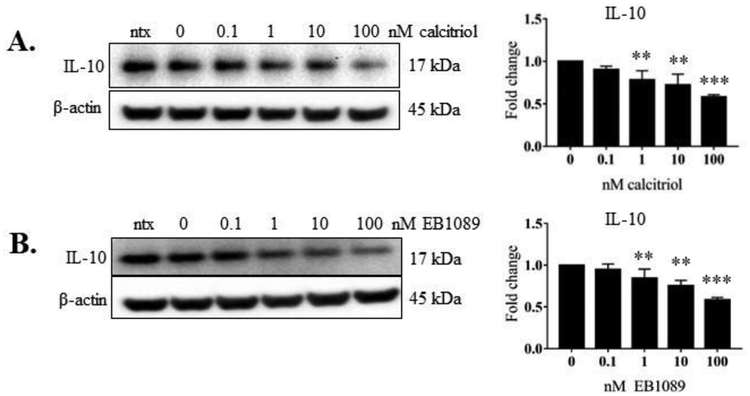
NKL cells were plated at a density of 1 million cells/mL unless indicated. NK-LGLL PBMCs were cultured overnight at 2 million cells/mL then plated at 1 million cells/mL for the experiment. Calcitriol was dissolved in 100% ethanol and EB1089 was dissolved in DMSO. Medium was RPMI 1640 supplemented with 10% FBS for NKL cells and PBMCs; NKL cells also received IL-2 (100 U/mL). All cells were maintained at 37°C, 5% CO2. Short-term IL-2 induction experiments (NKL cells) were incubated for 30 min, while calcitriol and EB1089 treatment experiments were incubated for 24 h at the doses listed. Appropriate negative controls included medium-only as a no treatment condition and ethanol or DMSO treated as a vehicle control, with the final percentage of ethanol or DMSO in the media always less than 0.1%. Comparison of vehicle controls to no treatment controls (ntx) was conducted with the IL-10 NKL western blot data (Figure 8). An unpaired two-tailed Student’s t-test showed no statistical difference between ethanol and DMSO vehicles (data not shown).
Figure 8. Intracellular IL-10 levels in NKL cells in response to calcitriol or EB1089 treatment.
The total protein samples from the three independent experiments in Figures 2 – 5 were probed for intracellular IL-10 via western blot. Total protein loaded per sample was 40 μg with β-actin used as a loading control. Representative western blots of IL-10 (Figure 9A, B) are shown. Data from three independent experiments were quantified to determine relative expression levels and quantification is shown to the right of the representative blots. The fold change in the graphs represents IL-10 over corresponding β-actin. Repeated measures ANOVA was used to determine significance compared to 0 nM vehicle control (* p<0.05, ** p<0.01, *** p <0.001). For graphical representation, the vehicle control was set to 1.
2.6. STAT6 Knockdown.
STAT6 siRNA knockdown utilized the Invitrogen Neon Transfection System (Cat #MPK10096). NKL cells were plated at 2.5 million cells/mL and treated with 50 or 100 nM SMARTpool ON-TARGETplus STAT6 siRNA (Dharmacon, Cat #L-006690-00-0005) or 50 nM ON-TARGETplus Control Non-Targeting Pool siRNA (Cat #D-001810-01-05) for 48 h. Protein was harvested to assess the knockdown status via western blot. Knockdown percent was calculated by quantifying and normalizing STAT6 to β-actin for all three conditions, then normalizing the 50 nM and 100 nM siRNA to the scramble siRNA. This ratio was subtracted from 1, then multiplied by 100, to give the percent knockdown.
2.7. Western Blot.
Cells were washed with 1X PBS then lysed in a RIPA lysis buffer that contained protease and phosphatase inhibitors. Protein content was quantified using the BCA assay. Total protein (40 μg for NKL, 25 μg for NK-LGLL PBMCs) was loaded and electrophoresed on a 4–12% polyacrylamide gel and then transferred to a PVDF membrane, which was probed with primary antibody overnight at 4°C according to manufacturer standards. Primary antibodies used in these studies were: IL-10 (Cat #12163), PARP (Cat #9532), RXR-β (Cat #8715), pY701-STAT1 (Cat #7649), total STAT1 (Cat #9175), pY690 STAT2 (Cat #88410), total STAT2 (Cat #72604), pY705-STAT3 (Cat #9131), total STAT3 (Cat #9139), pY693 STAT4 (Cat #4134), total STAT4 (Cat #5097), pY694/699 STAT5 (Cat #9315), total STAT5 (Cat #94205), pY641 STAT6 (Cat #9364), total STAT6 (Cat #5397), VDR (Cat #12550), with β-actin as a loading control (Cat #3700). After washes, the membrane was probed with secondary antibody (anti-rabbit IgG-HRP linked #7074 or anti-mouse IgG-HRP linked #7076) for 1 h then treated with ECL substrate. For proteins at lower levels SuperSignal West Femto Maximum Sensitivity Substrate was used. Images were captured with a ChemiDoc instrument and analyzed using Image Lab software (BioRad). Some targets were probed on the same blot and thus the representative blot images may have the same β-actin loading control image shown. In the cases of STAT, blots were probed first with the phospho-protein antibody, then stripped and re-probed with the corresponding total protein antibody.
2.8. Viability Assay.
Cells were seeded at 25,000 cells/well and MTS Cell Proliferation Colorimetric Assay Kit was used to assess cell viability. Twenty μl of MTS reagent was added to each well after 24 h of calcitriol, EB1089 or control treatment. The reaction was incubated at 37°C, 5% CO2 for 1 h, and formazan product was read on a plate reader (Biotek Cytation3 Imaging Reader) at 492 nm, according to the manufacturer’s instructions. Data were normalized to the vehicle control. All conditions were done in quadruplicate.
2.9. Cytokine Analysis.
Banked NK-LGLL patient or normal donor serum samples were retrieved from −80°C storage and analyzed by the UVA Flow Cytometry Core by a Luminex MAGPIX bead-based multiplex analyzer. In this cohort, all 8 patients had >47% purity NK-LGL cells (based on clinical blood flow cytometry data from at least one NK cell marker). In some cases, the flow cytometry data did not match the date of the sample used, so the closest clinical data to the sample date was used. At the time of sample collection, patients #1 and 2 were taking 10 mg/day prednisone and patient #6 was taking 20 mg/day prednisone. All other patients were not on any type of immunosuppressive treatment. The serum samples were analyzed on three panels for a total of 75 cytokines assayed: Human 41-plex, Human Cytokine/Chemokine Panel II, and Human Cytokine/Chemokine Panel III (EMD Millipore). For any cytokine values outside of the individual cytokine range, the minimum or maximum range values were utilized, to ensure that we were not overestimating significance. For the NKL samples, the cells were treated for 24 h with calcitriol or EB1089, pelleted, then aliquots of the conditioned media were collected and stored at −80°C. The samples were analyzed by the same method, except using a custom panel of IFN-γ, IL-10, and Flt-3L.
2.10. Statistical Analysis.
All data, except the serum cytokine data, were initially analyzed using GraphPad Prism software version 7. An unpaired two-tailed Student’s t-test was used to determine significance. P-values of <0.05 were considered significant. Figure legends note where a repeated measures ANOVA was used to account for the same patient or cell line samples being studied under different levels of calcitriol or EB1089. The two sample t-test and confidence intervals were used to compare serum cytokine levels between leukemia and control serum samples. Analyses were carried out using the software package GAUSS, version 17.0 (Chandler, Arizona) after transforming cytokine levels to the natural log scale. The false discovery rate was controlled using the Benjamini–Hochberg procedure [25].
2.11. Sequence Alignments.
Homo sapiens STAT6 protein sequences were retrieved and verified via two protein databases: UniProt and the National Center for Biotechnology Information (NCBI). The UniProt accession numbers were: P42226, P42226–2, and P42226–3. The NBCI accession numbers were: NP_001171550, NP_00117551, and BAD89432. UniProt gave molecular weight predictions of 94,135 Daltons for Isoform 1, 74,456 Daltons for Isoform 2, and 81,748 Daltons for Isoform 3. We verified these predictions via ExPASy Bioinformatics Resource Portal’s Compute pI/Mw tool (free online software). The STAT6 isoform sequences were aligned using Clustal Omega software (https://www.ebi.ac.uk/Tools/msa/clustalo/), which is a free online alignment tool curated by the European Bioinformatics Institute.
3. RESULTS
3.1. Exogenous IL-2 induced activation of STATs 1 – 6 in the NKL cell line.
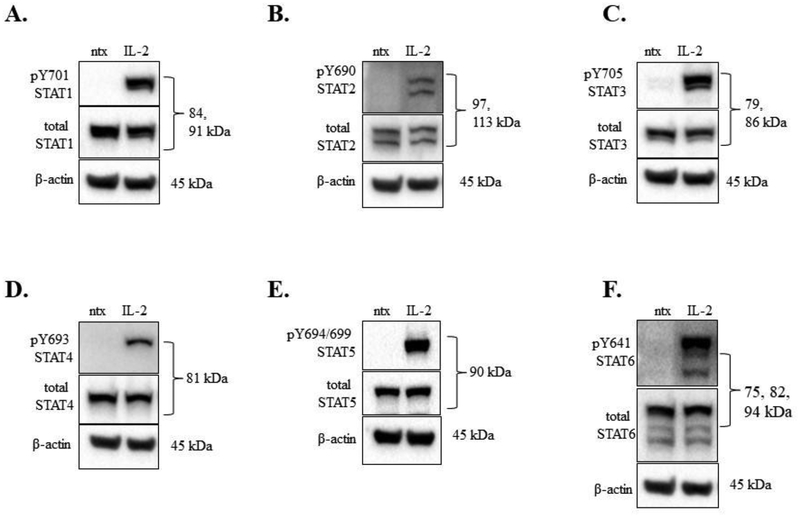
The NKL cell line requires addition of IL-2 (100 U/mL) every 48 h for optimum viability, survival, and proliferation [23]. We first investigated which STATs were activated via tyrosine phosphorylation after treatment with IL-2, as IL-2 is known to activate STAT1, 3, 4, and 5 in NK cells [26]. We maintained the cells without IL-2 for 19 h (overnight), then treated with IL-2 (100 U/mL) for 30 min and assessed STAT phosphorylation changes. IL-2 induced phosphorylation of STATs 1 – 6 at 30 min compared to ntx (Figure 1A–F). For STATs 1 – 5, we observed STAT protein isoform patterns consistent with previous work in our lab or with the antibody manufacturer’s information sheet. Interestingly, STAT6 showed three bands (Figure 1F) instead of the 1 band at 100 kDa as predicted by the antibody manufacturer. The 30 min IL-2 induction of NKL cells revealed 3 bands for phospho-Y641 STAT6 (Figure 1F, top panel); therefore, all three isoforms appeared to be STAT6 and we confirmed this by three additional means. First, protein databases and molecular weight prediction tools indicated three STAT6 isoforms: Isoform 1, 847 amino acids, 94 kDa; Isoform 2, 673 amino acids, 75 kDa, and Isoform 3, 737 amino acids, 82 kDa (Supplemental Figure 1A). Second, a siRNA-mediated knockdown of STAT6 demonstrated a loss of all three isoforms in the NKL cell line (Supplementary Figure 1B,C). Third, three different molecular weight markers verified the isoform sizes (data not shown). Taken together, we showed that IL-2 induced activation of STATs 1 – 6 via tyrosine phosphorylation, and that three isoforms of STAT6 are present in the NKL cell line.
Figure 1. IL-2 induced phosphorylation of STATs 1 – 6 in the NKL cell line.
Western blot analysis was performed on NKL cells that were cytokine starved overnight then treated for 30 min with or without IL-2 (100 U/mL). Total protein loaded per sample was 40 μg, with β-actin used as a loading control. Blots were probed for phosphorylated tyrosine and total protein forms: (A) STAT1, (B) STAT2, (C), STAT3, (D) STAT4, (E), STAT5, (F) STAT6. These are representative blots; the experiment was performed one other time with similar results.
3.2. Calcitriol treatment significantly reduced phosphorylation of STAT1 and STAT3 and significantly upregulated VDR protein.
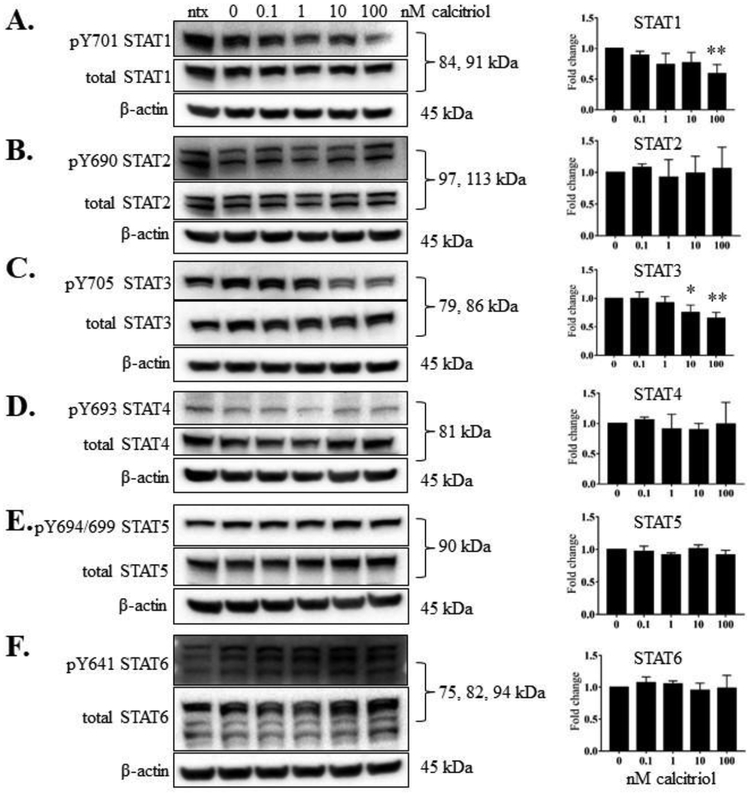
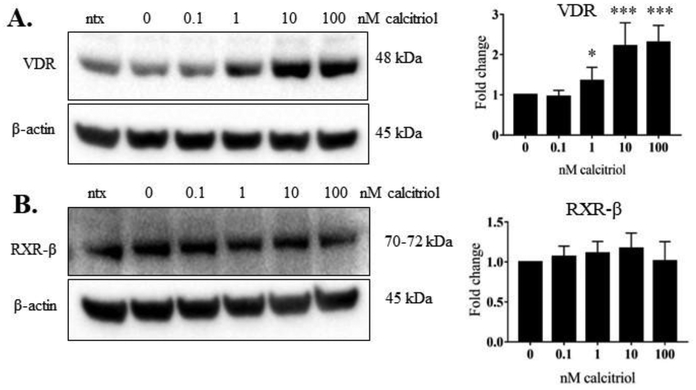
We wanted to determine whether calcitriol, the active form of vitamin D, decreased STAT tyrosine phosphorylation, as we previously observed in our T-LGLL studies [5]. We treated the cells with IL-2 and calcitriol (0.1 to 100 nM). At 24 h, we harvested both the conditioned media and the cells. Calcitriol significantly decreased the p-STAT1 (panel A, 100 nM dose) and p-STAT3 (panel C, 10 and 100 nM doses), but did not decrease tyrosine phosphorylation on the other STAT proteins (Figure 2B, D-F). VDR protein significantly increased upon 1, 10, and 100 nM calcitriol treatment (Figure 3A). RXR-β, the heterodimer binding partner for VDR, remained unchanged at the protein level (Figure 3B). Taken together, these results show that calcitriol caused robust upregulation of VDR protein levels with significant decrease in STAT1 and STAT3 tyrosine phosphorylation in the NKL cell line.
Figure 2. Calcitriol significantly reduced phosphorylation of STAT1 and STAT3 in NKL cells.
The NKL cell line was treated with the indicated doses of calcitriol, or appropriate negative controls, for 24 h. Total protein loaded per sample was 40 μg with β-actin used as a loading control. Representative western blots for each STAT showing phosphorylated and corresponding total protein are shown: (A) STAT1, (B) STAT2, (C), STAT3, (D) STAT4, (E), STAT5, (F) STAT6. Data from three independent experiments were quantified to determine relative expression levels for phosphorylated STATs 1 – 6 and quantification is shown to the right of each representative western blot. The fold change in the graphs represent p-STAT over corresponding total STAT. For STATs with multiple isoforms, the isoform quantifications were combined to give one value for each STAT. Repeated measures ANOVA were used to determine significance of calcitriol treatment compared to 0 nM vehicle control (* p<0.05, ** p<0.01, *** p <0.001). For graphical representation, the vehicle control was set to 1.
Figure 3. Calcitriol significantly upregulated VDR in NKL cells.
The NKL cell line was treated with the indicated doses of calcitriol, or appropriate negative controls, for 24 h. Total protein loaded per sample was 40 μg with β-actin used as a loading control. Representative western blots of VDR (A) and RXR-β (B) are shown. Data from three independent experiments were quantified to determine relative expression levels and quantification is shown to the right of each representative western blot. The fold change in the graphs represents VDR or RXR-β over corresponding β-actin. Repeated measures ANOVA was used to determine significance of calcitriol treatment compared to 0 nM vehicle control (* p<0.05, ** p<0.01, *** p <0.001). For graphical representation, the vehicle control was set to 1.
3.3. EB1089 treatment significantly reduced phosphorylation of STAT1 and STAT3 and significantly upregulated VDR protein.
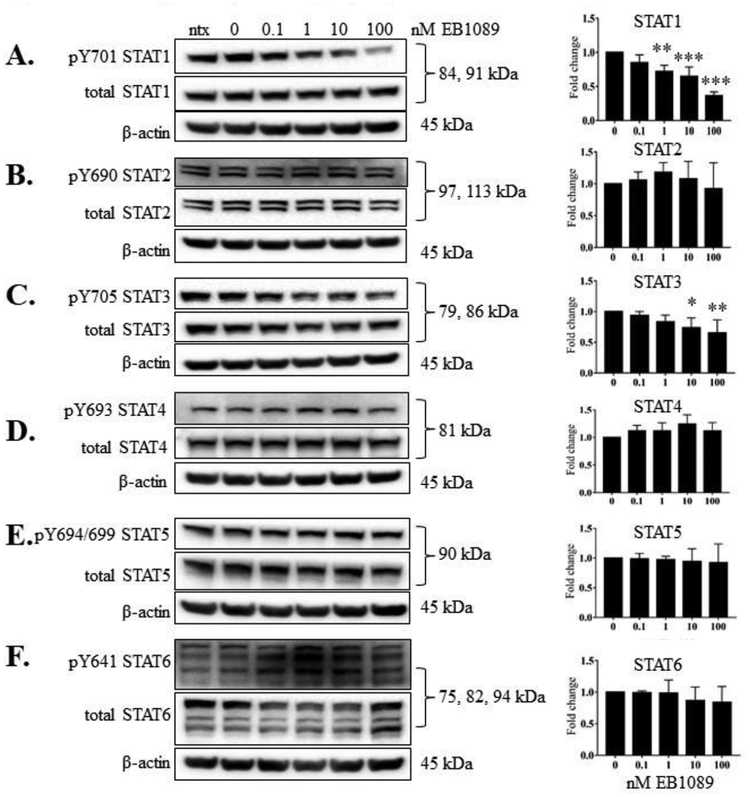
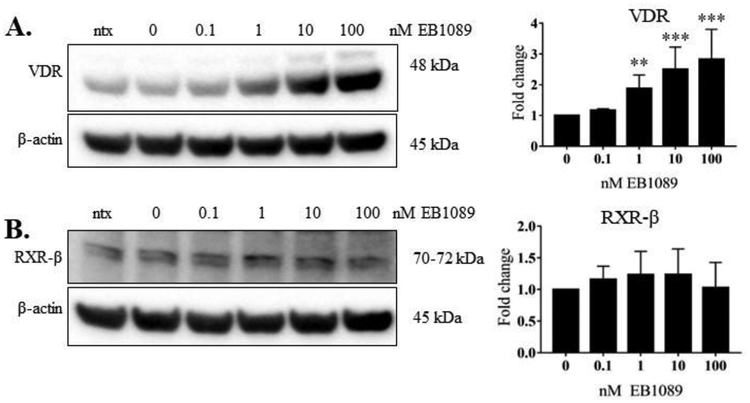
EB1089 is a potent analog of calcitriol that has been shown to block tumor growth and cause apoptosis [27]. Thus, we aimed to evaluate the potency of this analog relative to calcitriol in the NKL cell line. We repeated the experiment described above using EB1089 in place of calcitriol. EB1089 significantly decreased p-STAT1 and p-STAT3 at multiple doses at 24 h (Figure 4, panels A, C), but did not decrease tyrosine phosphorylation on the other STAT proteins (Figure 4B, D- F). The levels of VDR protein were significantly increased at 1, 10 and 100 nM EB1089 (Figure 5A). RXR-β, the heterodimer binding partner for VDR, remained unchanged at the protein level (Figure 5B). These data show that compared to calcitriol, EB1089 exhibited similar ability to decrease STAT3 phosphorylation and upregulate VDR, respectively, but was more potent in decreasing STAT1 phosphorylation.
Figure 4. EB1089 significantly reduced phosphorylation of STAT1 and STAT3 in NKL cells.
The NKL cell line was treated with the indicated doses of EB1089, or appropriate negative controls, for 24 h. Total protein loaded per sample was 40 μg with β-actin used as a loading control. Representative western blots for each STAT showing phosphorylated and corresponding total protein are shown: (A) STAT1, (B) STAT2, (C), STAT3, (D) STAT4, (E), STAT5, (F) STAT6. Data from three independent experiments were quantified to determine relative expression levels for phosphorylated STATs 1 – 6 and quantification is shown to the right of each representative western blot. The fold change in the graphs represents the ratio of p-STAT to corresponding total STAT. For STATs with multiple isoforms, the isoform quantifications were combined to give one value for each STAT. Repeated measures ANOVA was used to determine significance of EB1089 treatment compared to 0 nM vehicle control (* p<0.05, ** p<0.01, *** p <0.001). For graphical representation, the vehicle control was set to 1.
Figure 5. EB1089 significantly upregulated VDR in NKL cells.
The NKL cell line was treated with the indicated doses of EB1089, or appropriate negative controls, for 24 h. Total protein loaded per sample was 40 μg with β-actin used as a loading control. Representative western blots of VDR (A) and RXR-β (B) are shown. Data from three independent experiments were quantified to determine relative expression levels and quantification is shown to the right of each representative western blot. The fold change in the graphs represents VDR or RXR-β over corresponding β-actin. Repeated measures ANOVA was used to determine significance of EB1089 treatment compared to 0 nM vehicle control (* p<0.05, ** p<0.01, *** p <0.001). For graphical representation, the vehicle control was set to 1.
3.4. Viability of the NKL cells is unchanged by calcitriol or EB1089 treatment.
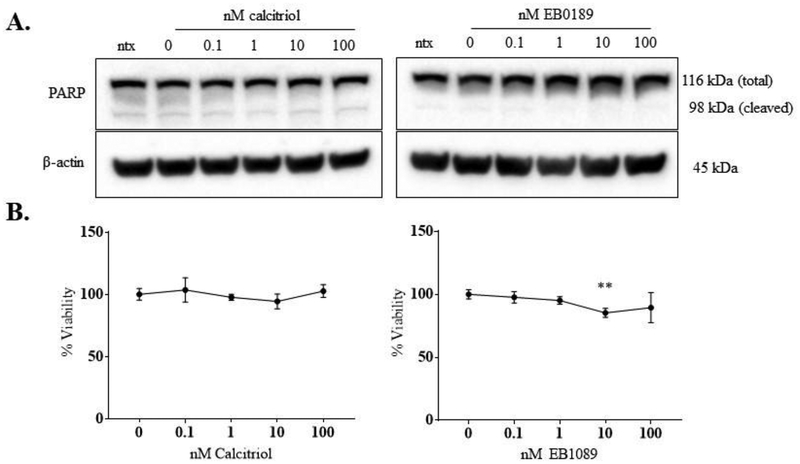
Since STAT1 and STAT3 have been identified as drivers of LGLL, we next assessed whether reduced activation of these STATs induced NKL apoptotic cell death or loss of viability. Our lab has previously shown that PARP is cleaved in NKL cells undergoing apoptosis [28]. After treatment with calcitriol or EB1089, NKL cells only exhibited the full-length isoform of PARP (Figure 6A), which suggests that the NKL cells do not undergo apoptotic cell death as a result of treatment for 24 h. Furthermore, viability assays with both calcitriol and EB1089 showed that NKL cell viability remained close to 100% up to the highest dose of 100 nM (Figure 6B) at 24 h. We did see a modest statistically significant decrease at 10 nM EB1089 (corresponding to a 15% decrease) but this significance was not maintained at the 100 nM EB1089 treatment (11% decrease). A longer timepoint of 48 h was carried out with calcitriol, showing only at the 100 nM calcitriol dose a modest but significant 10% viability reduction (data not shown). Thus, we conclude that neither calcitriol nor EB1089 caused a biologically significant decrease in NKL cell viability.
Figure 6. Cell viability in the NKL cell line with and without calcitriol or EB1089 treatment is unchanged.
NKL cells were treated with the indicated doses of calcitriol or EB1089, or appropriate negative controls for 24 h. (A) Representative western blots showing total protein (40 μg) from the experiments in Figures 2 and 5 probed for PARP. β-actin was used as a loading control. The antibody recognizes both total (116 kDa) and cleaved (98 kDa) PARP isoforms and can thus indicate if there is any level of PARP cleavage, which is indicative of apoptotic cell death. (B) NKL cells were treated with the indicated doses of calcitriol or EB1089, or appropriate negative controls for 24 h. Each dose was done in quadruplicate. MTS reagent was added at 24 h to assess cell viability. Data were normalized to the 0 nM control and are shown as mean with standard deviation. Student’s t-test was used to determine significance of calcitriol/EB1089 treatment compared to 0 nM vehicle control (** p<0.01).
3.5. NKL cell line cytokine production changes with EB1089 treatment.
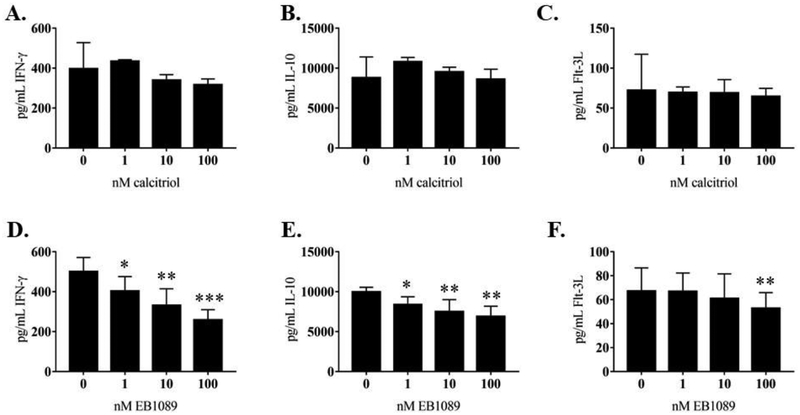
We wanted to establish that calcitriol or EB1089 cause changes in NKL cell line cytokine production. We examined levels of IFN-γ, IL-10, and Flt-3L in 24 h conditioned media from NKL cells treated with calcitriol or EB1089 using a custom Luminex panel. The rationale for the cytokines were from our previous work [5, 18] and published literature. IFN-γ is a pro-inflammatory cytokine that is associated with worse disease state in multiple malignancies and autoimmune disorders [29–31]. IL-10 is classically known as an anti-inflammatory cytokine, but recent work has shown it has pro-inflammatory properties [32–34]. Flt-3L levels can be elevated in hematological malignancies and autoimmune diseases [35–38]. Our results showed that calcitriol did not significantly change secreted IFN-γ, IL-10, or Flt-3L (Figure 7 A–C). IFN-γ and IL-10 significantly decreased at 1, 10, and 100 nM EB1089 treatment (Figure 7D and E). The Flt-3L change was more modest, showing a significant decrease only at the highest dose (100 nM) of EB1089 (Figure 7F). Intracellular IL-10 significantly decreased at 1, 10, and 100 nM calcitriol or EB1089 treatment (Figure 8). Intracellular IFN-γ was not detectable by western blot (data not shown). We did not probe for intracellular Flt-3L since it did not change as drastically at the extracellular level as the other two cytokines. Taken together, these data suggest that activating the vitamin D pathway can decrease secreted cytokine production.
Figure 7. Analysis of cytokine output by the NKL cell line with or without calcitriol or EB1089 treatment.
Cell culture media samples from NKL cells (n=3 replicates) were analyzed using a custom Luminex panel of Flt-3L, IFN-γ, and IL-10. These conditioned media samples were collected at 24 h. The calcitriol results showed no significant decrease at any dose compared to the vehicle control for (A) IFN-γ, (B) IL-10, or (C) Flt-3L. Significant decreases in both (E) IFN-γ and (F) IL-10 were observed at all doses of EB1089. Significant decrease at 100 nM EB1089 was observed for (F) Flt-3L. Repeated measures ANOVA was used to determine significance compared to 0 nM vehicle control (* p<0.05, ** p<0.01, *** p <0.001).
3.6. Activating the vitamin D pathway in NK-LGLL patient PBMCs decreases p-STAT1 and p-STAT3 and increases VDR.
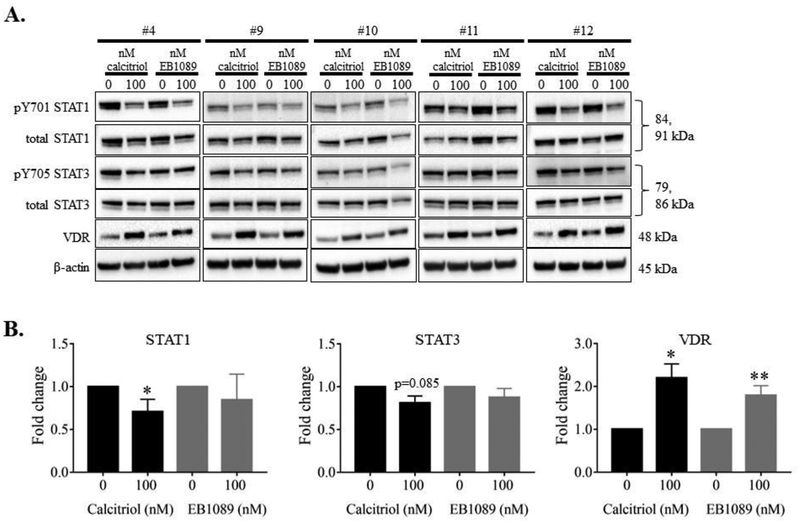
We next validated our NKL cell line findings in five NK-LGLL PBMC samples. Information about these patients (#4, 9–12) can be found in Supplemental Table 1. Each patient sample was treated with 100 nM calcitriol or EB1089 or their respective vehicle controls. At 24 h, we harvested the cells. Figure 9A shows the western blot data for all samples, with a representative β-actin blot. All patient samples showed a change in at least one of the targets tested (STAT1, STAT3, or VDR). The bands were quantified, data combined, and represented as bar graphs in Figure 9B. While both calcitriol and EB1089 treatments induced significant VDR upregulation, only calcitriol showed significant p-STAT1 decrease and p-STAT3 trended toward significance (p=0.085). IL-10 and IFN-γ were not detectable. Taken together, NK-LGLL patient PBMCs respond to calcitriol or EB1089 treatment, and these data recapitulate the findings in the NKL cell line.
Figure 9. NK-LGLL patient PBMCs treated with calcitriol or EB1089 show STAT1 and STAT3 phosphorylation decrease and VDR increase.
NK-LGLL patient PBMC samples (#4, 9–12) were treated with 100 nM calcitriol or EB1089 or vehicle controls, for 24 h. Total protein loaded per sample was 25 μg with β-actin used as a loading control (A). The blots were quantified and graphed (B). The fold change in the graphs represent p-STAT over corresponding total STAT or VDR over β-actin. Repeated measures ANOVA was used to determine significance of treatment compared to 0 nM vehicle control (* p<0.05, ** p<0.01). For graphical representation, the vehicle control was set to 1.
3.7. NK-LGLL patient serum has altered cytokines compared to normal controls.
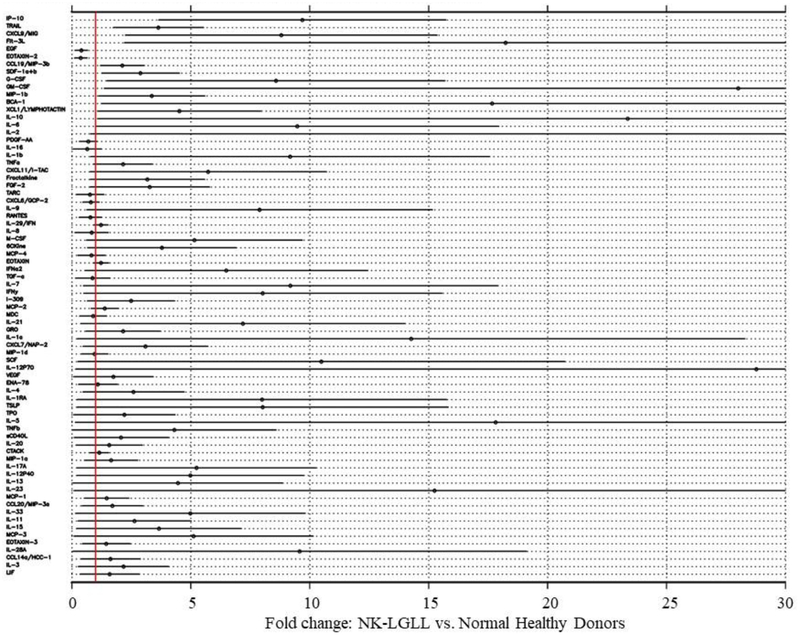
We validated cytokine significance in NK-LGLL by comparing the serum of eight NK-LGLL patients (NK-LGLL #1–8) to eight normal age- and sex-matched donors (Normal Donor #1 – 8). Additional information about these samples can be found in Supplemental Table 1. Of the 75 cytokines that were assayed, 15 cytokines were statistically significantly different in NK-LGLL versus normal controls (Figure 10). Eosinophil chemotactic protein (EOTAXIN)-2/CC chemokine ligand (CCL)24 and epidermal growth factor (EGF) were significantly decreased while interferon gamma-induced protein 10 (IP-10), TNF-related apoptosis-inducing ligand (TRAIL), monokine induced by gamma interferon(MIG)/chemokine (C-X-C motif) ligand (CXCL)9, Flt-3L, macrophage inflammatory protein (MIP)-3β/CCL19, stromal cell-derived factor 1(SDF-1)α+β/CXCL12, granulocyte-colony stimulating factor (G-CSF)/CSF-3, granulocyte-macrophage colony stimulating factor (GM-CSF), MIP-1β, B cell-attracting chemokine (BCA)-1, Lymphotactin/(X-C motif chemokine ligand (XCL)1 IL-10, and IL-6 were all significantly increased in NK-LGLL versus normal healthy controls. This NK-LGLL patient cohort can be divided into n=4 WT STAT3 and n=4 mutant STAT3. Further analysis showed no significant difference between these groups in the 15 cytokines mentioned above, although TRAIL and Flt-3L trended toward significant elevation in the mutant STAT3 group with p-values of 0.069 and 0.064, respectively. Scatterplots of these data are located in Supplemental Figure 2. Taken together, this is the first NK-LGLL serum cytokine analysis reported, which has both identified 14 cytokines that are significantly different in NK-LGLL patient serum versus normal healthy donor serum and identified uniqueness and overlap between NK-LGLL and T-LGLL serum cytokines.
Figure 10. Human NK-LGLL and normal healthy donor serum cytokine analysis.
Serum samples from eight NK-LGLL patients (NK-LGLL # 1 −8) and eight normal healthy donors (Normal Donor #1 – 8) were analyzed by three Luminex cytokine panels, which total 75 individual cytokines. Analyses were carried out after transforming cytokine levels to the log10 scale. The table is sorted based on p-value, with the 15 cytokines at the top of the graph significantly different in NK-LGLL patients compared to the healthy controls (p<0.05). IL-2 parameters in this graph are off-scale (fold change 84.8, 95% CI (0.8, 168.9).
4. DISCUSSION
In this study, we found that the NKL cell line, a model of NK-LGLL, and NK-LGLL patient PBMCs are responsive to vitamin D treatment. To the best of our knowledge this is the first report to show protein-level STAT and VDR data upon calcitriol treatment in NK cells, and the only study of EB1089 treatment of any NK cell type. We have also reported the first serum cytokine analysis of NK-LGLL patients, demonstrating that uniquely elevated cytokines in this LGLL subtype provide opportunities for future studies.
STAT proteins are transcription factors whose target genes include a variety of cytokines [10]. Under normal circumstances, STATs 1 to 6 are well-orchestrated and work together to mediate appropriate NK cell development, including the timing of cytotoxic abilities [26]. It is known that IL-2 signaling in NK cells activates STATs 1, 3, 4, and 5, with no reports of STAT2 or 6 activation at this time [26]. In our study, we found activation of STATs 1 – 6 in the NKL cell line (Figure 1), which likely contributes to uncontrolled cytokine production. Significant VDR upregulation was observed with calcitriol or EB1089 treatment, while RXR-β remained unchanged (Figures 3, 5). Both treatments significantly decreased p-STAT1 and p-STAT3 (Figure 2, 4) and intracellular IL-10 (Figure 8). Extracellular IFN-γ, IL-10, and Flt-3L decreased only with EB1089 treatment (Figure 7). All these changes occurred without significantly altering cell viability, therefore cell death is not likely the cause of reduced cytokine production (Figure 6). Similar results with STAT1, 3, and VDR were recapitulated in five NK-LGLL patient PBMC samples (Figure 9).
Neither treatment affected total STAT protein levels at the examined time points, which is consistent with our previous work [18]. One caveat is that our previous work only looked at reduction in activation of STATs 1 and 3 in the TL-1 cell line [5, 18]; in this study, we report the phosphorylation status of STATs 1, 2, 3, 4, 5 and 6 in the NKL cell line and STATs 1 and 3 in NK-LGLL patient PBMC samples. Based on our results, we created a working model (Supplemental Figure 3) that shows how vitamin D pathway activation reduces STAT1 and 3 phosphorylation with decreased cytokine production as the outcome. Importantly, these results show that NK cells can respond to vitamin D treatment, which may have beneficial effects for NK-LGLL patients by decreasing their inflammatory cytokine load [19–21].
The literature consistently reports that vitamin D acts on chronically activated T cells by turning them off [13–16], but does not kill them [12]. We observed this effect in the NKL cell line in agreement with our previous work in the TL-1 cell line [5]. We used up to 100 nM of calcitriol or EB1089 on the NKL cell line and did not observe biologically significant decreases in cell viability (Figure 6). It is interesting that tofacitinib, a JAK3 inhibitor, caused only approximately 9% apoptosis in CD8+ T-LGLL cells, compared to CD8+ healthy control cells but still had clinical benefit in these patients [39]. This is similar to our 48 h calcitriol MTS cell viability data in the NKL cell line and suggests that vitamin D treatment could provide therapeutic benefit. Further evidence of reprogramming was observed when calcitriol and EB1089 decreased inflammatory cytokine production in NKL cells. This study and another from our lab have shown elevated IFN-γ in T-LGLL [40], which others have shown can be correlated with worse disease progression and symptomology [31, 41]. In addition, in vitro studies with NK-LGLL patient PBMCs have shown here that STAT1 and STAT3 phosphorylation can be decreased with simultaneous VDR increase (Figure 9). It is known that STAT proteins transcribe inflammatory cytokine genes [10]. Therefore, decreasing p-STAT1 and p-STAT3 in NK-LGL leukemic cells should consequently decrease inflammatory cytokine production. Presumably, these effects are due to the robust upregulation of VDR (Figure 3, 5). Of interest, EB1089 exhibited more potency than calcitriol in the NKL cells by significantly decreasing p-STAT1 at lower doses and being the only agent to significantly decrease IL-10, IFN-γ, and Flt-3L extracellular output (Figure 7). This is not surprising, as many studies have reported EB1089 is more potent than its natural counterpart [42–45]. This may be due to EB1089 being metabolized differently than calcitriol [46] and thus having a longer half-life.
Our study indicates that activation of the vitamin D pathway results in decreased inflammatory cytokine production. Understanding which inflammatory cytokines are important in NK-LGLL pathogenesis led us to measure 75 cytokines in NK-LGLL patient serum samples that were sex- and age-matched to eight normal donor serum samples (Figure 10). Of these 75 cytokines, 15 were significantly different between NK-LGLL patients and normal donors. While cell types besides leukemic LGLs can contribute to cytokine production, this cohort of patients had >47% LGL purity, suggesting these cells would be significant contributors to serum cytokine levels. These cytokines have overlapping and unique aspects in their functions.
Three cytokines we studied in the context of the NKL cell line were IFN-γ, IL-10, and Flt-3L. IFN-γ plays a pro-tumorigenic role in many malignancies and is significantly elevated in T-LGLL patient PBMCs [40] likely due to decreased negative regulation [47, 48]. Our previous work in T-LGLL showed potential for calcitriol to reduce IFN-γ levels [5, 18]. Although the NKL cell line produced a 10-fold lower level of extracellular IFN-γ compared to TL-1 [5, 18], we did observe that 100 nM EB1089 caused a significant decrease in IFN-γ output (Figure 8F), suggesting this inflammatory cytokine can be lowered in NK-LGLL. Vitamin D treatment increased IL-10 production in T cells, reprogramming them to a less inflammatory T-helper 2 cell type [12]. However, more recent data have suggested that IL-10 may have pro-inflammatory properties [32–34]. It is also a known transcriptional target of STAT3 and can positively regulate STAT3 signaling [49]. Our work with the NKL cell line shows that calcitriol or EB1089 treatment significantly decrease intracellular IL-10 (Figure 8) but only EB1089 decreases extracellular IL-10 (Figures 8B). Therefore, IL-10 appears to have dual functions depending on the environment. Extracellular Flt-3L levels were significantly decreased by 100 nM EB1089 (Figure 8F). Elevated Flt-3L levels have been reported in several chronic autoimmune diseases such as in serum, synovial fluid, and synovial tissue of rheumatoid arthritis patients [35], serum of patients with primary Sjogren’s syndrome [37], and serum of dermatomyositis systemic sclerosis, scleroderma spectrum disorder, and mixed connective tissue disease patients [38]. Therefore, vitamin D treatment may be beneficial in lowering this cytokine.
The elevation of multiple cytokines that are typically orchestrated in non-disease settings may contribute to NK-LGLL symptoms. BCA-1/CXCL13, EOTAXIN-2/CCL24, IP-10/CXCL10, MIG/CXCL9, MIP-3β/CCL19, MIP-1β/CCL4, SDF-1α/β/CXCL12, and XCL/Lymphotactin are all classified as chemokines with their typical function being recruitment of leukocytes [11]. Recent work by our lab and collaborators found IP-10/CXCL10 was elevated in T-LGLL vs. normal controls [50]. G-CSF/CSF-3 and GM-CSF are colony stimulating factors that typically target stem cells in the bone marrow for the purpose of granulocyte production [11]. TRAIL, which our lab has found to be elevated in LGLL [51], is a tumor necrosis family ligand that typically induces apoptosis through a death receptor [52]. Epidermal growth factor (EGF) can signal through STAT5 in trophoblastic cell lines [53], but its potential role in leukemia is currently unclear. IL-6 activates STAT3, a driver of LGLL, and was significantly elevated in T-LGLL serum compared to normal controls [40, 54]. Future work will investigate understanding what role each cytokine plays and whether the vitamin D pathway can turn off their production.
Analysis of the WT (n=4) vs. mutant (n=4) STAT3 status of this NK-LGLL patient cohort showed no significant difference between these groups in the 15 cytokines mentioned above (Supplemental Figure 2). Due to the small sample size, varying LGL and STAT3 mutation purity [55], and STAT3 mutation heterogeneity, a larger study would need to be conducted to validate this finding.
In this current study, we quantified serum levels of cytokines measured in previous T-LGLL studies [40, 50, 56], but we also assayed additional cytokines that were not considered in the past. This provided a basis for comparison and the opportunity to identify potential future targets. Importantly, the cytokines assessed were not completely overlapping in these three studies. From the overlapping cytokines, we found some potential biomarkers to pursue. Several studies found IL-6 and/or TRAIL were elevated in TLGLL serum/plasma samples [40, 50, 51, 54], which we also observed in the NK-LGLL patients in this study. Interestingly, all three T-LGLL studies showed IL-8 was significantly elevated in T-LGLL compared to normal donors. However, in our NK-LGLL study, IL-8 was not significantly different. Of interest is IL-10, which we found to be significantly elevated in NK-LGLL but was previously not different in T-LGLL compared to healthy donors [40]. This current study used a more sensitive and specific technique than past work [56], and combined with the previous studies shows NK- and T-LGLL may have unique cytokine profiles, and therefore may require unique treatments.
In conclusion, our report is the first to show that calcitriol or EB1089 treatment of NKL cells or NKLGLL patient PBMC samples causes intracellular changes that may lead to a less inflammatory cell type. Our novel NK-LGLL serum cytokine report shows that patients have elevated inflammatory cytokines. Hence, vitamin D may lower inflammatory cytokines in patients and provide a therapeutic benefit. Future work will involve understanding the interplay of the vitamin D pathway and cytokine production in NKLGLL.
Supplementary Material
Supplemental Figure 1. Verification of STAT6 protein isoforms in the NKL cell line. Homo sapiens STAT6 protein sequences were retrieved via UniProt and NCBI protein databases. Three isoforms were identified, and their predicted molecular weights were 75, 82, and 94 kDa. (A) The STAT6 isoform sequences were aligned using Clustal Omega software. (B) NKL cells were treated with 50 nM or 100 nM STAT6 siRNA or 50 nM scramble siRNA for 48 h. Total protein extracts from the cells at this timepoint were probed for pY641 STAT6, total STAT6, and β-actin (loading control). (C) Knockdown efficiency of each total STAT6 isoform.
Supplemental Figure 2. The 15 changed serum cytokines in NK-LGLL patients do not show statistical difference based on STAT3 SH2 domain mutation status. The 15 significantly different significant serum cytokines from Figure 10 were analyzed by dividing the samples into their respective WT (n=4) or mutant STAT3 (n=4) status and analyzed via a two-sample t-test after transforming the data to the log10 scale. None of the cytokines were significantly different. The data are represented as scatterplots showing the p-value for each cytokine. Normal donors are plotted for comparison.
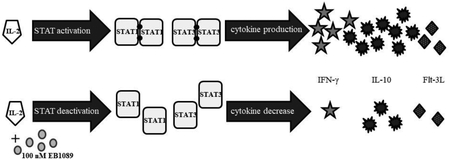
Supplemental Figure 3. A working model of NK-LGLL responses to IL-2 treatment and changes that occur with EB1089. This summarizes the major findings of our work in the NKL cell line with EB1089, the calcitriol analog that showed the most effects. The left panel shows how NKL cells depend on exogenous IL-2 for survival, causing phosphorylation of STATs 1 – 6 and output of cytokines (we measured IFN-γ, IL-10, and Flt-3L). EB1089 treatment decreased STAT1 and STAT3 tyrosine phosphorylation, decreased IL-10, IFN-γ, and Flt-3L, and robustly increased VDR. These findings were recapitulated in 5 NK-LGLL patient PBMC samples, with calcitriol showing p-STAT1 and p-STAT3 decrease but both agents causing substantial VDR upregulation. The other targets in this working model were not measured in the patient samples.
Supplemental Table 1. Clinical data summary of NK-LGLL patients and normal healthy donor samples. Samples were acquired from patients or healthy donors not currently on immunosuppressant treatment. The patient or healthy donor age is the age at the time the sample was collected. Serum and PBMC patient ages for #4 are written as left, right, respectively, since the samples were acquired from different years. STAT3 mutation status for the NK-LGLL patients refers to mutation status in the SH2 domain as determined by Sanger sequencing.
Highlights.
NKL cell line used as a model for NK cell large granular lymphocyte leukemia
Exogenous IL-2 causes tyrosine phosphorylation in STAT1 through 6 in NKL cells
NKL co-treated with IL-2 and calcitriol (vitamin D) or EB1089 (calcitriol analog)
Calcitriol or EB1089 deactivate STAT1 and 3 in NKL cells and NK-LGLL patient PBMCs
15 cytokines significantly altered in NK-LGLL; EB1089 decreased 3 cytokines in NKL
Acknowledgements:
Normal control sera were generously provided through a collaborative effort with Creative Testing Solutions, R&D Support, Tempe, Arizona, www.mycts.org from the assistance of Phillip Williamson, Ph.D. and Valerie Winkelman, MS, MT (ASCP) MBcm. We thank Matt Schmachtenberg for support with blood processing and Holly Davis, Bryna Shemo, and Andrea Hines for LGLL Registry support. We thank Alexander Wendling in the UVA Flow Cytometry Core for performing Luminex Assays. We wish to extend a special thanks to the LGLL patient community for their enthusiastic support and interest in our research. We also want to express our appreciation to Christine Weart Sachs, M.D.
Funding:
This work was funded by the National Cancer Institute of the National Institutes of Health under award numbers R01CA098472, R01CA178393, and P30-CA044579–23 (to TPL), the Bess Family Charitable Fund (to TPL), the LGL Leukemia Foundation (to TPL), Dr. Charles and Katharine Hutton Tweedy (to TPL), Christine Weart Sachs, M.D. (to TPL), William J. Branch (to TPL), a generous anonymous donor (to TPL), the Immunology Training Grant T32AI007496 (to PMK), and the UVA Wagner Fellowship (to PMK).
Abbreviations:
- BCA-1
B cell-attracting chemokine 1
- CCL
CC chemokine ligand
- CXCL
chemokine (C-XC motif) ligand
- EOTAXIN
eosinophil chemotactic protein
- EGF
epidermal growth factor
- Flt-3L
FMS-like tyrosine kinase 3 ligand
- G-CSF
granulocyte-colony stimulating factor
- GM-CSF
granulocyte-macrophage colony stimulating factor
- IL
interleukin
- IFN
interferon
- IP-10
interferon gamma-induced protein 10
- MIG
monokine induced by gamma interferon
- MIP
macrophage inflammatory protein
- NK cell
natural killer cell
- NK-LGLL
natural killer large granular lymphocyte leukemia
- JAK
Janus kinase
- PBMC
peripheral blood mononuclear cells
- STAT
signal transducer and activator of transcription
- SDF1
stromal cell-derived factor 1
- TNF
tumor necrosis factor
- TRAIL
TNF-related apoptosis-inducing ligand
- VDR
vitamin D receptor
- XCL-1
X-C motif chemokine ligand 1
Footnotes
Publisher's Disclaimer: This is a PDF file of an unedited manuscript that has been accepted for publication. As a service to our customers we are providing this early version of the manuscript. The manuscript will undergo copyediting, typesetting, and review of the resulting proof before it is published in its final citable form. Please note that during the production process errors may be discovered which could affect the content, and all legal disclaimers that apply to the journal pertain.
Declarations of interest: none.
REFERENCES
- [1].Lamy T, Moignet A, Loughran TP Jr., LGL leukemia: from pathogenesis to treatment, Blood 129(9) (2017) 1082–1094. [DOI] [PubMed] [Google Scholar]
- [2].Lamy T, Loughran TP Jr., How I treat LGL leukemia, Blood 117(10) (2011) 2764–74. [DOI] [PMC free article] [PubMed] [Google Scholar]
- [3].Suzuki R, Suzumiya J, Nakamura S, Aoki S, Notoya A, Ozaki S, Gondo H, Hino N, Mori H, Sugimori H, Kawa K, Oshimi K, N.K.-c.T.S. Group, Aggressive natural killer-cell leukemia revisited: large granular lymphocyte leukemia of cytotoxic NK cells, Leukemia 18(4) (2004) 763–70. [DOI] [PubMed] [Google Scholar]
- [4].Epling-Burnette PK, Liu JH, Catlett-Falcone R, Turkson J, Oshiro M, Kothapalli R, Li Y, Wang JM, Yang-Yen HF, Karras J, Jove R, Loughran TP Jr., Inhibition of STAT3 signaling leads to apoptosis of leukemic large granular lymphocytes and decreased Mcl-1 expression, J Clin Invest 107(3) (2001) 351–62. [DOI] [PMC free article] [PubMed] [Google Scholar]
- [5].Olson KC, Kulling PM, Olson TL, Tan SF, Rainbow RJ, Feith DJ, Loughran TP Jr., Vitamin D decreases STAT phosphorylation and inflammatory cytokine output in T-LGL leukemia, Cancer Biol Ther 18(5) (2017) 290–303. [DOI] [PMC free article] [PubMed] [Google Scholar]
- [6].Jerez A, Clemente MJ, Makishima H, Koskela H, Leblanc F, Peng Ng K, Olson T, Przychodzen B, Afable M, Gomez-Segui I, Guinta K, Durkin L, Hsi ED, McGraw K, Zhang D, Wlodarski MW, Porkka K, Sekeres MA, List A, Mustjoki S, Loughran TP, Maciejewski JP, STAT3 mutations unify the pathogenesis of chronic lymphoproliferative disorders of NK cells and T-cell large granular lymphocyte leukemia, Blood 120(15) (2012) 3048–57. [DOI] [PMC free article] [PubMed] [Google Scholar]
- [7].Rajala HL, Eldfors S, Kuusanmaki H, van Adrichem AJ, Olson T, Lagstrom S, Andersson EI, Jerez A, Clemente MJ, Yan Y, Zhang D, Awwad A, Ellonen P, Kallioniemi O, Wennerberg K, Porkka K, Maciejewski JP, Loughran TP Jr., Heckman C, Mustjoki S, Discovery of somatic STAT5b mutations in large granular lymphocytic leukemia, Blood 121(22) (2013) 4541–50. [DOI] [PMC free article] [PubMed] [Google Scholar]
- [8].Koskela HL, Eldfors S, Ellonen P, van Adrichem AJ, Kuusanmaki H, Andersson EI, Lagstrom S, Clemente MJ, Olson T, Jalkanen SE, Majumder MM, Almusa H, Edgren H, Lepisto M, Mattila P, Guinta K, Koistinen P, Kuittinen T, Penttinen K, Parsons A, Knowles J, Saarela J, Wennerberg K, Kallioniemi O, Porkka K, Loughran TP Jr., Heckman CA, Maciejewski JP, Mustjoki S, Somatic STAT3 mutations in large granular lymphocytic leukemia, N Engl J Med 366(20) (2012) 1905–13. [DOI] [PMC free article] [PubMed] [Google Scholar]
- [9].Rajala HL, Porkka K, Maciejewski JP, Loughran TP Jr., Mustjoki S, Uncovering the pathogenesis of large granular lymphocytic leukemia-novel STAT3 and STAT5b mutations, Ann Med 46(3) (2014) 114–22. [DOI] [PubMed] [Google Scholar]
- [10].Abroun S, Saki N, Ahmadvand M, Asghari F, Salari F, Rahim F, STATs: An Old Story, Yet Mesmerizing, Cell J 17(3) (2015) 395–411. [DOI] [PMC free article] [PubMed] [Google Scholar]
- [11].Turner MD, Nedjai B, Hurst T, Pennington DJ, Cytokines and chemokines: At the crossroads of cell signalling and inflammatory disease, Biochim Biophys Acta 1843(11) (2014) 2563–2582. [DOI] [PubMed] [Google Scholar]
- [12].Yang CY, Leung PS, Adamopoulos IE, Gershwin ME, The implication of vitamin D and autoimmunity: a comprehensive review, Clin Rev Allergy Immunol 45(2) (2013) 217–26. [DOI] [PMC free article] [PubMed] [Google Scholar]
- [13].Cantorna MT, Waddell A, The vitamin D receptor turns off chronically activated T cells, Ann N Y Acad Sci 1317 (2014) 70–5. [DOI] [PubMed] [Google Scholar]
- [14].Chen PT, Hsieh CC, Wu CT, Yen TC, Lin PY, Chen WC, Chen MF, 1alpha,25-Dihydroxyvitamin D3 Inhibits Esophageal Squamous Cell Carcinoma Progression by Reducing IL6 Signaling, Mol Cancer Ther 14(6) (2015) 1365–75. [DOI] [PubMed] [Google Scholar]
- [15].Muthian G, Raikwar HP, Rajasingh J, Bright JJ, 1,25 Dihydroxyvitamin-D3 modulates JAK-STAT pathway in IL-12/IFNgamma axis leading to Th1 response in experimental allergic encephalomyelitis, J Neurosci Res 83(7) (2006) 1299–309. [DOI] [PubMed] [Google Scholar]
- [16].Wang Q, Li H, Xie H, Fu M, Guo B, Ding Y, Li W, Yu H, 25-Hydroxyvitamin D3 attenuates experimental periodontitis through downregulation of TLR4 and JAK1/STAT3 signaling in diabetic mice, J Steroid Biochem Mol Biol 135 (2013) 43–50. [DOI] [PubMed] [Google Scholar]
- [17].Kulling PM, Olson KC, Olson TL, Feith DJ, Loughran TP Jr., Vitamin D in hematological disorders and malignancies, Eur J Haematol 98(3) (2017) 187–197. [DOI] [PMC free article] [PubMed] [Google Scholar]
- [18].Kulling PM, Olson KC, Olson TL, Hamele CE, Carter KN, Feith DJ, Loughran TP Jr., Calcitriol-mediated reduction in IFN-gamma output in T cell large granular lymphocytic leukemia requires vitamin D receptor upregulation, J Steroid Biochem Mol Biol 177 (2018) 140–148. [DOI] [PMC free article] [PubMed] [Google Scholar]
- [19].Moran-Auth Y, Penna-Martinez M, Shoghi F, Ramos-Lopez E, Badenhoop K, Vitamin D status and gene transcription in immune cells, J Steroid Biochem Mol Biol 136 (2013) 83–5. [DOI] [PubMed] [Google Scholar]
- [20].Merino F, Alvarez-Mon M, de la Hera A, Ales JE, Bonilla F, Durantez A, Regulation of natural killer cytotoxicity by 1,25-dihydroxyvitamin D3, Cell Immunol 118(2) (1989) 328–36. [DOI] [PubMed] [Google Scholar]
- [21].Weeres MA, Robien K, Ahn YO, Neulen ML, Bergerson R, Miller JS, Verneris MR, The effects of 1,25-dihydroxyvitamin D3 on in vitro human NK cell development from hematopoietic stem cells, J Immunol 193(7) (2014) 3456–62. [DOI] [PMC free article] [PubMed] [Google Scholar]
- [22].Hansen CM, Hamberg KJ, Binderup E, Binderup L, Seocalcitol (EB 1089): a vitamin D analogue of anti-cancer potential. Background, design, synthesis, pre-clinical and clinical evaluation, Curr Pharm Des 6(7) (2000) 803–28. [DOI] [PubMed] [Google Scholar]
- [23].Robertson MJ, Cochran KJ, Cameron C, Le JM, Tantravahi R, Ritz J, Characterization of a cell line, NKL, derived from an aggressive human natural killer cell leukemia, Exp Hematol 24(3) (1996) 406–15. [PubMed] [Google Scholar]
- [24].Lamy T, Liu JH, Landowski TH, Dalton WS, Loughran TP Jr., Dysregulation of CD95/CD95 ligand-apoptotic pathway in CD3(+) large granular lymphocyte leukemia, Blood 92(12) (1998) 4771–7. [PubMed] [Google Scholar]
- [25].Benjamini Y, Hochberg Y, Controlling the False Discovery Rate: A Practical and Powerful Approach to Multiple Testing, Journal of the Royal Statistical Society. Series B (Methodological) 57(1) (1995) 12. [Google Scholar]
- [26].Gotthardt D, Sexl V, STATs in NK-Cells: The Good, the Bad, and the Ugly, Front Immunol 7 (2016) 694. [DOI] [PMC free article] [PubMed] [Google Scholar]
- [27].Duffy MJ, Murray A, Synnott NC, O’Donovan N, Crown J, Vitamin D analogues: Potential use in cancer treatment, Crit Rev Oncol Hematol 112 (2017) 190–197. [DOI] [PubMed] [Google Scholar]
- [28].LeBlanc FR, Liu X, Hengst J, Fox T, Calvert V, Petricoin EF 3rd, Yun J, Feith DJ, Loughran TP Jr., Sphingosine kinase inhibitors decrease viability and induce cell death in natural killer-large granular lymphocyte leukemia, Cancer Biol Ther 16(12) (2015) 1830–40. [DOI] [PMC free article] [PubMed] [Google Scholar]
- [29].Buschle M, Campana D, Carding SR, Richard C, Hoffbrand AV, Brenner MK, Interferon gamma inhibits apoptotic cell death in B cell chronic lymphocytic leukemia, J Exp Med 177(1) (1993) 213–8. [DOI] [PMC free article] [PubMed] [Google Scholar]
- [30].Welcher AA, Boedigheimer M, Kivitz AJ, Amoura Z, Buyon J, Rudinskaya A, Latinis K, Chiu K, Oliner KS, Damore MA, Arnold GE, Sohn W, Chirmule N, Goyal L, Banfield C, Chung JB, Blockade of interferon-gamma normalizes interferon-regulated gene expression and serum CXCL10 levels in patients with systemic lupus erythematosus, Arthritis Rheumatol 67(10) (2015) 2713–22. [DOI] [PMC free article] [PubMed] [Google Scholar]
- [31].Solerte SB, Cravello L, Ferrari E, Fioravanti M, Overproduction of IFN-gamma and TNF-alpha from natural killer (NK) cells is associated with abnormal NK reactivity and cognitive derangement in Alzheimer’s disease, Ann N Y Acad Sci 917 (2000) 331–40. [DOI] [PubMed] [Google Scholar]
- [32].Guimaraes PM, Scavuzzi BM, Stadtlober NP, Franchi Santos L, Lozovoy MAB, Iriyoda TMV, Costa NT, Reiche EMV, Maes M, Dichi I, Simao ANC, Cytokines in systemic lupus erythematosus: far beyond Th1/Th2 dualism lupus: cytokine profiles, Immunol Cell Biol 95(9) (2017) 824–831. [DOI] [PubMed] [Google Scholar]
- [33].Lauw FN, Pajkrt D, Hack CE, Kurimoto M, van Deventer SJ, van der Poll T, Proinflammatory effects of IL-10 during human endotoxemia, J Immunol 165(5) (2000) 2783–9. [DOI] [PubMed] [Google Scholar]
- [34].Tilg H, van Montfrans C, van den Ende A, Kaser A, van Deventer SJ, Schreiber S, Gregor M, Ludwiczek O, Rutgeerts P, Gasche C, Koningsberger JC, Abreu L, Kuhn I, Cohard M, LeBeaut A, Grint P, Weiss G, Treatment of Crohn’s disease with recombinant human interleukin 10 induces the proinflammatory cytokine interferon gamma, Gut 50(2) (2002) 191–5. [DOI] [PMC free article] [PubMed] [Google Scholar]
- [35].Ramos MI, Perez SG, Aarrass S, Helder B, Broekstra P, Gerlag DM, Reedquist KA, Tak PP, Lebre MC, FMS-related tyrosine kinase 3 ligand (Flt3L)/CD135 axis in rheumatoid arthritis, Arthritis Res Ther 15(6) (2013) R209. [DOI] [PMC free article] [PubMed] [Google Scholar]
- [36].Stirewalt DL, Radich JP, The role of FLT3 in haematopoietic malignancies, Nat Rev Cancer 3(9) (2003) 650–65. [DOI] [PubMed] [Google Scholar]
- [37].Tobon GJ, Renaudineau Y, Hillion S, Cornec D, Devauchelle-Pensec V, Youinou P, Pers JO, The Fms-like tyrosine kinase 3 ligand, a mediator of B cell survival, is also a marker of lymphoma in primary Sjogren’s syndrome, Arthritis Rheum 62(11) (2010) 3447–56. [DOI] [PubMed] [Google Scholar]
- [38].Nakamura K, Nakatsuka N, Jinnin M, Makino T, Kajihara I, Makino K, Honda N, Inoue K, Fukushima S, Ihn H, Serum concentrations of Flt-3 ligand in rheumatic diseases, Biosci Trends 9(5) (2015) 342–9. [DOI] [PubMed] [Google Scholar]
- [39].Bilori B, Thota S, Clemente MJ, Patel B, Jerez A, Afable Ii M, Maciejewski JP, Tofacitinib as a novel salvage therapy for refractory T-cell large granular lymphocytic leukemia, Leukemia 29(12) (2015) 2427–9. [DOI] [PubMed] [Google Scholar]
- [40].Loughran TP Jr., Zickl L, Olson TL, Wang V, Zhang D, Rajala HL, Hasanali Z, Bennett JM, Lazarus HM, Litzow MR, Evens AM, Mustjoki S, Tallman MS, Immunosuppressive therapy of LGL leukemia: prospective multicenter phase II study by the Eastern Cooperative Oncology Group (E5998), Leukemia 29(4) (2015) 886–94. [DOI] [PMC free article] [PubMed] [Google Scholar]
- [41].Abiko K, Matsumura N, Hamanishi J, Horikawa N, Murakami R, Yamaguchi K, Yoshioka Y, Baba T, Konishi I, Mandai M, IFN-gamma from lymphocytes induces PD-L1 expression and promotes progression of ovarian cancer, Br J Cancer 112(9) (2015) 1501–9. [DOI] [PMC free article] [PubMed] [Google Scholar]
- [42].Roy S, Martel J, Tenenhouse HS, Comparative effects of 1,25-dihydroxyvitamin D3 and EB 1089 on mouse renal and intestinal 25-hydroxyvitamin D3–24-hydroxylase, J Bone Miner Res 10(12) (1995) 1951–9. [DOI] [PubMed] [Google Scholar]
- [43].Skowronski RJ, Peehl DM, Feldman D, Actions of vitamin D3, analogs on human prostate cancer cell lines: comparison with 1,25-dihydroxyvitamin D3, Endocrinology 136(1) (1995) 20–6. [DOI] [PubMed] [Google Scholar]
- [44].Mathiasen IS, Colston KW, Binderup L, EB 1089, a novel vitamin D analogue, has strong antiproliferative and differentiation inducing effects on cancer cells, J Steroid Biochem Mol Biol 46(3) (1993) 365–71. [DOI] [PubMed] [Google Scholar]
- [45].Carlberg C, Mathiasen IS, Saurat JH, Binderup L, The 1,25-dihydroxyvitamin D3 (VD) analogues MC903, EB1089 and KH1060 activate the VD receptor: homodimers show higher ligand sensitivity than heterodimers with retinoid X receptors, J Steroid Biochem Mol Biol 51(3–4) (1994) 137–42. [DOI] [PubMed] [Google Scholar]
- [46].Kissmeyer AM, Binderup E, Binderup L, Mork Hansen C, Andersen NR, Makin HL, Schroeder NJ, Shankar VN, Jones G, Metabolism of the vitamin D analog EB 1089: identification of in vivo and in vitro liver metabolites and their biological activities, Biochem Pharmacol 53(8) (1997) 1087–97. [DOI] [PubMed] [Google Scholar]
- [47].Andersson EI, Rajala HL, Eldfors S, Ellonen P, Olson T, Jerez A, Clemente MJ, Kallioniemi O, Porkka K, Heckman C, Loughran TP Jr., Maciejewski JP, Mustjoki S, Novel somatic mutations in large granular lymphocytic leukemia affecting the STAT-pathway and T-cell activation, Blood Cancer J 3 (2013) e168. [DOI] [PMC free article] [PubMed] [Google Scholar]
- [48].Kulling PM, Olson KC, Hamele CE, Toro MF, Tan SF, Feith DJ, Loughran TP Jr., Dysregulation of the IFN-gamma-STAT1 signaling pathway in a cell line model of large granular lymphocyte leukemia, PLoS One 13(2) (2018) e0193429. [DOI] [PMC free article] [PubMed] [Google Scholar]
- [49].Wang Y, Shen Y, Wang S, Shen Q, Zhou X, The role of STAT3 in leading the crosstalk between human cancers and the immune system, Cancer Lett 415 (2018) 117–128. [DOI] [PMC free article] [PubMed] [Google Scholar]
- [50].Savola P, Bruck O, Olson T, Kelkka T, Kauppi MJ, Kovanen PE, Kytola S, Sokka-Isler T, Loughran TP, Leirisalo-Repo M, Mustjoki S, Somatic STAT3 mutations in Felty syndrome: an implication for a common pathogenesis with large granular lymphocyte leukemia, Haematologica 103(2) (2018) 304–312. [DOI] [PMC free article] [PubMed] [Google Scholar]
- [51].Yang J, LeBlanc FR, Dighe SA, Hamele CE, Olson TL, Feith DJ, Loughran TP Jr., TRAIL mediates and sustains constitutive NF-kappaB activation in LGL leukemia, Blood 131(25) (2018) 2803–2815. [DOI] [PMC free article] [PubMed] [Google Scholar]
- [52].Wang S, El-Deiry WS, TRAIL and apoptosis induction by TNF-family death receptors, Oncogene 22(53) (2003) 8628–33. [DOI] [PubMed] [Google Scholar]
- [53].Ospina-Prieto S, Chaiwangyen W, Pastuschek J, Schleussner E, Markert UR, Morales-Prieto DM, STAT5 is Activated by Epidermal Growth Factor and Induces Proliferation and Invasion in Trophoblastic Cells, Reprod Sci 22(11) (2015) 1358–66. [DOI] [PubMed] [Google Scholar]
- [54].Teramo A, Gattazzo C, Passeri F, Lico A, Tasca G, Cabrelle A, Martini V, Frezzato F, Trimarco V, Ave E, Boscaro E, Piazza F, Facco M, Trentin L, Semenzato G, Zambello R, Intrinsic and extrinsic mechanisms contribute to maintain the JAK/STAT pathway aberrantly activated in T-type large granular lymphocyte leukemia, Blood 121(19) (2013) 3843–54, S1. [DOI] [PubMed] [Google Scholar]
- [55].Yan Y, Olson TL, Nyland SB, Feith DJ, Loughran TP Jr., Emergence of a STAT3 mutated NK clone in LGL leukemia, Leuk Res Rep 4(1) (2015) 4–7. [DOI] [PMC free article] [PubMed] [Google Scholar]
- [56].Kothapalli R, Nyland SB, Kusmartseva I, Bailey RD, McKeown TM, Loughran TP Jr., Constitutive production of proinflammatory cytokines RANTES, MIP-1beta and IL-18 characterizes LGL leukemia, Int J Oncol 26(2) (2005) 529–35. [PubMed] [Google Scholar]
Associated Data
This section collects any data citations, data availability statements, or supplementary materials included in this article.
Supplementary Materials
Supplemental Figure 1. Verification of STAT6 protein isoforms in the NKL cell line. Homo sapiens STAT6 protein sequences were retrieved via UniProt and NCBI protein databases. Three isoforms were identified, and their predicted molecular weights were 75, 82, and 94 kDa. (A) The STAT6 isoform sequences were aligned using Clustal Omega software. (B) NKL cells were treated with 50 nM or 100 nM STAT6 siRNA or 50 nM scramble siRNA for 48 h. Total protein extracts from the cells at this timepoint were probed for pY641 STAT6, total STAT6, and β-actin (loading control). (C) Knockdown efficiency of each total STAT6 isoform.
Supplemental Figure 2. The 15 changed serum cytokines in NK-LGLL patients do not show statistical difference based on STAT3 SH2 domain mutation status. The 15 significantly different significant serum cytokines from Figure 10 were analyzed by dividing the samples into their respective WT (n=4) or mutant STAT3 (n=4) status and analyzed via a two-sample t-test after transforming the data to the log10 scale. None of the cytokines were significantly different. The data are represented as scatterplots showing the p-value for each cytokine. Normal donors are plotted for comparison.
Supplemental Figure 3. A working model of NK-LGLL responses to IL-2 treatment and changes that occur with EB1089. This summarizes the major findings of our work in the NKL cell line with EB1089, the calcitriol analog that showed the most effects. The left panel shows how NKL cells depend on exogenous IL-2 for survival, causing phosphorylation of STATs 1 – 6 and output of cytokines (we measured IFN-γ, IL-10, and Flt-3L). EB1089 treatment decreased STAT1 and STAT3 tyrosine phosphorylation, decreased IL-10, IFN-γ, and Flt-3L, and robustly increased VDR. These findings were recapitulated in 5 NK-LGLL patient PBMC samples, with calcitriol showing p-STAT1 and p-STAT3 decrease but both agents causing substantial VDR upregulation. The other targets in this working model were not measured in the patient samples.
Supplemental Table 1. Clinical data summary of NK-LGLL patients and normal healthy donor samples. Samples were acquired from patients or healthy donors not currently on immunosuppressant treatment. The patient or healthy donor age is the age at the time the sample was collected. Serum and PBMC patient ages for #4 are written as left, right, respectively, since the samples were acquired from different years. STAT3 mutation status for the NK-LGLL patients refers to mutation status in the SH2 domain as determined by Sanger sequencing.


