

Abstract
Identification of conditions for guided and specific differentiation of human stem and progenitor cells is important for continued development and engineering of in vitro cell culture systems for use in regenerative medicine, drug discovery and human toxicology. Three-dimensional (3D) and organotypic cell culture models have been used increasingly for in vitro cell culture because they may better model endogenous tissue environments. However, detailed studies of stem cell differentiation within 3D cultures remain limited, particularly with respect to high-throughput screening. Herein, we demonstrate use of a microarray chip-based platform to screen, in high-throughput, individual and paired effects of 12 soluble factors on neuronal differentiation of a human neural progenitor cell line (ReNcell VM) encapsulated in microscale 3D Matrigel cultures. Dose-response analysis of select combinations from the initial combinatorial screen revealed that the combined treatment of all-trans-retinoic acid (RA) with the GSK3 inhibitor CHIR-99021 (CHIR) enhances neurogenesis while simultaneously decreasing astrocyte differentiation, whereas the combined treatment of brain-derived neurotrophic factor and the small azide neuropathiazol enhances differentiation into neurons and astrocytes. Subtype specification analysis of RA- and CHIR-differentiated cultures revealed that enhanced neurogenesis was not biased toward a specific neuronal subtype. Together, these results demonstrate that a high-throughput screening platform for rapid evaluation of differentiation conditions in a 3D environment, which will aid development and application of 3D stem cell culture models.
Keywords: three-dimensional cell culture, high-throughput screening, human neural progenitor cells, differentiation, neurogenesis
Graphical Abstract
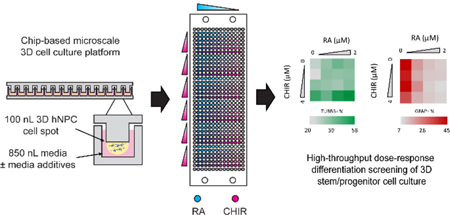
We report the use of a chip-based system for combinatorial high-throughput differentiation screening of microscale 3D human neural progenitor cells.
Introduction
Controlled differentiation of human stem and progenitor cells is important for efficient derivation of specific cell types for a wide range of applications including regenerative medicine, drug discovery, generation of in vitro cell-based models and toxicity screening (Breier et al., 2010; Choi et al., 2014; Gonzalez et al., 2013). While advances have been made toward these goals, identifying specific differentiation conditions (i.e., media additives, duration of exposure, concentration, time of onset, etc.) continues to be a rate- and efficiency-limiting factor in stem cell applications. This challenge is due to the complexity of stem cell differentiation, which depends on orchestrated changes in gene expression mediated by both intrinsic and extrinsic signals within complex networks (Gupta et al., 2010). Compounding this complexity is the large combinatorial sampling space between testable conditions and differentiation endpoints, which may be addressed through high-throughput screening to interrogate, understand and control stem cell differentiation (Desbordes et al., 2008; Rhim et al., 2015; Underhill & Bhatia, 2007). Such studies are made even more complex when 3D cultures are considered, as the enhanced cell-cell and cell-ECM interactions associated with 3D cultures may further alter cellular responses to soluble stimuli. For example, Yang et al. found that changing the encapsulating matrix altered directed differentiation outcomes of 3D encapsulated embryonic stem cells (Yang et al., 2010). There is, therefore, an important need to screen and optimize differentiation protocols, particularly for emerging 3D cell cultures, yet high-throughput screening of 3D cell cultures, including studies of stem cell differentiation, has only recently begun to emerge (Nierode et al., 2016; Ranga et al., 2014).
Stem cell derived 3D neuronal cultures have garnered interest because they have demonstrated utility in modeling neurological and neurodegenerative disorders (Choi et al., 2014; Jang et al., 2014). For example, by culturing human neural progenitor cells overexpressing genes associated with familial Alzheimer’s disease within 3D Matrigel, Choi et al. were able to create an in vitro model that recapitulates the hallmark pathology of Alzheimer’s disease (Choi et al., 2014). 3D neuronal models are also attractive because they may offer improved scalability of stem cell production for regenerative medicine, such as dopaminergic neurons for Parkinson’s disease (Adil et al., 2017; Lei & Schaffer, 2013).
Herein, we use a microarray chip platform, previously developed for high-throughput toxicity screening, to assess the impact of 12 soluble differentiation factors, individually and in combination, on 3D neuronal differentiation of a v-myc immortalized human neural progenitor cell (hNPC; ReNcell VM) line. Immunofluorescence-based analysis of a neuron-specific protein marker, β-III tubulin (TUBB3), led to the identification of several soluble factors and their combinations that enhanced neuronal differentiation. Further investigation of selected combinations provided preliminary insight into the effects of specific soluble factor combinations on neural progenitor cell fate and neuronal subtype specification. Finally, we explored the impact of 3D culture scale (1,000-fold increase) on guided hNPC differentiation under conditions that enhanced neuronal differentiation in microscale 3D culture. Together, this study demonstrates use of a microarray-based cell culture platform for rapid, high-throughput screening of 3D stem/progenitor cell differentiation, which is crucial for the accelerated development of improved stem cell derived 3D and organotypic cell culture models.
Materials and Methods
Human neural progenitor cell culture
The v-myc immortalized human neural progenitor cell line ReNcell VM (EMD Millipore) was used in this study at between passages 4 to 8. Undifferentiated hNPCs were maintained by culturing on laminin (Sigma) coated T25 or T75 flasks in complete growth medium, consisting of ReNcell Maintenance Medium (EMD Millipore) containing 20 ng/mL FGF2 (EMD Millipore), 20 ng/mL EGF (EMD Millipore), and 100 U/ml penicillin-streptomycin (Gibco). Cells were passaged using Accutase and re-plated at 10,000 cells/cm2 when approximately 90% confluent. Medium was changed the day after passaging and every second day after that.
For off-chip 3D culture, freshly passaged undifferentiated ReNcell VM were mixed with Matrigel (High Concentration Growth Factor Reduced, Corning) at such a ratio that the final cell concentration was 5 × 10⁶ cells/mL and the final Matrigel concentration was 1% (w/v). 100 μL of this cell-Matrigel suspension (containing 500,000 cells) was seeded into 8-well chamber microscope slides (Nunc) and incubated at 37 oC for 15 min to gel. Following, 400 μL media was added and exchanged every second day. All cultures were maintained within incubators at 37 oC and 5% CO2.
Three-dimensional microarray culture preparation
Polystyrene micropillar and microwell chips (MBD Korea Co., South Korea) were used for on-chip culture and screening. Prior to use, the polystyrene chip surface was coated with a polydopamine substrate as outlined by Lee et al., to enable covalent attachment of the Matrigel spots (H. Lee, Dellatore, Miller, & Messersmith, 2007; Haeshin Lee, Rho, & Messersmith, 2009). Briefly, chips were incubated in a solution of 2 mg/mL dopamine (Sigma) in 10 mM tris-base at pH 8.5 for 2 h at room temperature on an orbital shaker at 120 rpm. The chips were then rinsed with sterile deionized water and air dried in a sterile laminar flow hood. Prior to use, the microwell chips were exposed to UV (302 nm, 9 cm from source) for 4 h using a 96 W transilluminator (Syngene GVM-30) to reduce surface hydrophobicity, as outlined by Kohen et al. (Kohen, Little, & Healy, 2009).
On-chip 3D cultures were prepared using an enclosed MicroSys 5100–4SQ (DigiLabs) non-contact robotic microarray liquids dispensing system with a cooling head modification, as described previously (Nierode et al., 2016). In short, 850 nL of complete growth media was printed into the microwell chips, covered with gas permeable sealing membranes (Diversified Biotech) and stored in an incubator (37 oC and 5% CO2). Cooled suspensions of newly passaged ReNcell VM were mixed with Matrigel (high concentration growth factor reduced, Corning) in a ratio such that the final cell concentration was 5 × 10⁶ cells/mL with a final Matrigel concentration of 1% (w/v) and kept on ice. The cooled microarray system was then used to spot 100 nL of Matrigel-cell mixtures onto the pillars of the micropillar chip (~500 cells within each spot). Following printing, the 3D culture-laden micropillar chips were incubated for 15 min at 37 oC in a humid chamber to polymerize Matrigel and stamped into a microwell containing warmed media. Cultures were stored in a humidified chamber and media was exchanged every second day (by stamping to a new microwell chip).
For differentiation screening, on-chip cultures were prepared and undifferentiated hNPCs allowed to expand for five days in ReNcell Maintenance Media containing EGF and FGF2. On the fifth day, on-chip cultures were switched to ReNcell Maintenance Media supplemented with 100 U/mL pen-strep without EGF and FGF2 containing the 12 differentiation factors added individually or in paired combinations at the concentrations listed in Table S1. Vendors for differentiation factors are also listed in Table S1. All media was supplemented to a final concentration of 0.5% (v/v) DMSO during differentiation, which was used as a carrier for RA, CHIR, PURM, NPZ, and FORS. Following five-day exposure to differentiation factors, cultures were maintained in ReNcell Maintenance Media for five additional days prior to immunofluorescence-based processing and analysis.
In-cell immunofluorescence assays
On-chip 3D cultures were rinsed with warm Dulbecco’s Phosphate Buffered Saline (DPBS) and fixed with 4% (w/v) formaldehyde and 0.25% (w/v) glutaraldehyde in DPBS for 20 min at room temperature (RT). Fixed cells were permeated with 0.25% (v/v) Triton X-100 in DPBS for 10 min, rinsed with DPBS, and quenched for 30 min in distilled water containing 2 mg/mL sodium borohydride (Sigma). Cells were blocked overnight at 4 °C in DPBS with 5% (w/v) bovine serum albumin (BSA) and 1% (v/v) goat serum and incubated in primary antibody solutions diluted into DPBS containing 1% (w/v) BSA, 1% goat serum and 10 ppm anti-foam C (Sigma) overnight at 4 oC. Cells were washed with DPBS three-times for 2 h each before repeating the antibody incubation step with secondary antibodies. Antibody incubations were performed in 750 nL of antibody containing solutions on-chip, and a complete list of primary and secondary antibodies, vendors and dilutions used is presented in Table S3. After incubation with secondary antibodies, cells were washed with DPBS three-times for 2 h each before 10 min incubation in DPBS with 5 μg/mL Hoechst 33342. Lastly, micropillar chips were rinsed with DPBS containing 50 mM trehalose for 10 min before being completely dried with nitrogen and stored in the dark. Dried micropillar chips were imaged using a ThermoFisher Cellomics ArrayScan VTI automated fluorescent microscope, and images were processed using the Cellomics analysis suite as described in further detail within the Supplementary Information.
Western blotting
Cell lysate protein concentrations were estimated using a BCA assay (Sigma). Equal amounts of protein (~10 μg) were loaded into either 8 or 12% cast SDS-PAGE gels. Gels were resolved at 120 V in a tris-glycine buffer and electro-transferred to a nitrocellulose membrane for either 60 min at 100 V (12% gel) or overnight at 30 V (8% gel) at 4 oC. Membranes were rinsed with tris-buffered saline (TBS), blocked in 5% (w/v) BSA TBS for 1 h at RT, and incubated overnight at 4 oC in primary antibody solutions diluted in blocking buffer with 0.05% (v/v) Tween-20. Membranes were rinsed with TBS containing 0.05% Tween-20 (TBST) and incubated with an appropriate secondary antibody diluted in TBS with 3% BSA for 90 min at RT. Membranes were washed with TBST and then TBS before incubation with chemiluminescence solution (SuperSignal Pico, Pierce) for 10 min. Membranes were imaged with a Bio-Rad ChemiDoc and subsequently stripped using a stripping buffer (200 mM glycine, 1% (v/v) Tween-20, 0.1% (w/v) SDS, pH 2) and evaluated for efficient stripping with chemiluminescence before being reused with the above procedure for detection of loading control proteins (GAPDH for 12% gels, Vinculin for 8% gels).
Results and Discussion
Neuronal differentiation screening of hNPCs in 3D Matrigel
Twelve soluble differentiation factors and small molecules reported to enhance 2D neuronal differentiation were identified from the literature and used as a guide to investigate, in high-throughput, their individual and paired effects on 3D neuronal differentiation of ReNcell VM hNPCs. The library encompasses both synthetic small molecules and endogenous proteins and signaling factors involved in modulating in vitro neuronal differentiation (Table S1). Within the 12-member library, six compounds were small molecules, including all-trans-retinoic acid (RA), neuropathiazol (NPZ), CHIR-99021 (CHIR), dibutyryl cyclic adenosine monophosphate (db-cAMP), forskolin (FORS) and purmorphamine (PURM). The other six factors consisted of growth factors and secreted proteins that provide signaling and trophic support during and after neuronal differentiation including glial-derived neurotrophic factor (GDNF), brain-derived neurotrophic factor (BDNF), neurotrophin-3 (NT3), neuregulin-1β (NRG1), fibroblast growth factor 8 (FGF8) and transforming growth factor, β−3 (TGFB3). The aim of this initial screen was to rapidly identify conditions that enhanced a neuronal fate for subsequent analysis. The concentrations screened were based on values reported in the literature to be bioactive (Table S1).
A dual microarray chip platform was used for the 3D differentiation screen, as recently demonstrated for high-throughput/high-content phenotypic screening of 3D cultures (Figure S1) (Nierode et al., 2016). This platform consists of two complementary polystyrene “chips” that have either 532 micropillars (micropillar chip) or microwells (microwell chip). 3D cell cultures (100 nL) atop micropillar chips are “stamped” with microwell chips containing media (e.g., 850 nL) for on-chip culturing and screening. Undifferentiated ReNcell VM hNPCs were embedded within 100 nL 1% (w/v) Matrigel spots (500 cells/spot) on each pillar and expanded before being induced to differentiate by simultaneously removing EGF and FGF2 and adding various combinations of differentiation factors for five days. The cultures were then matured for five additional days prior to analysis (Figure 1A). High-content, on-chip immunofluorescence-based analysis of β-III tubulin (TUBB3) expression (Figure 1B), an early neuron-specific protein marker, was used to assess neuronal differentiation. A total of 78 unique factors/combinations (four replicates per combination per screen, compiled over three independent replicate screens) resulted in a wide range of observable TUBB3 expression, as normalized by cell number using the Hoechst 33342 nuclear stain and background subtracted (Figure 1C). Conditions that resulted in very low TUBB3 fluorescence levels, e.g., near that of the background, resulted in negative fluorescence values within error of zero. In this experiment, we compared the directed differentiation to undirected, spontaneous differentiation (e.g., no factor added) to identify conditions that enhanced neuronal differentiation. Spontaneous differentiation was chosen as the control as opposed to using cultures of isolated primary neurons, as the latter assumes that at varying stages of maturation cells will express fate markers at similar levels. However, this is not always the case, and therefore, such an approach could result in experimental artifacts (Frese et al., 2017). Thus, we focused on use of appropriate internal antibody controls and compared expression to the spontaneous differentiation.
Figure 1.
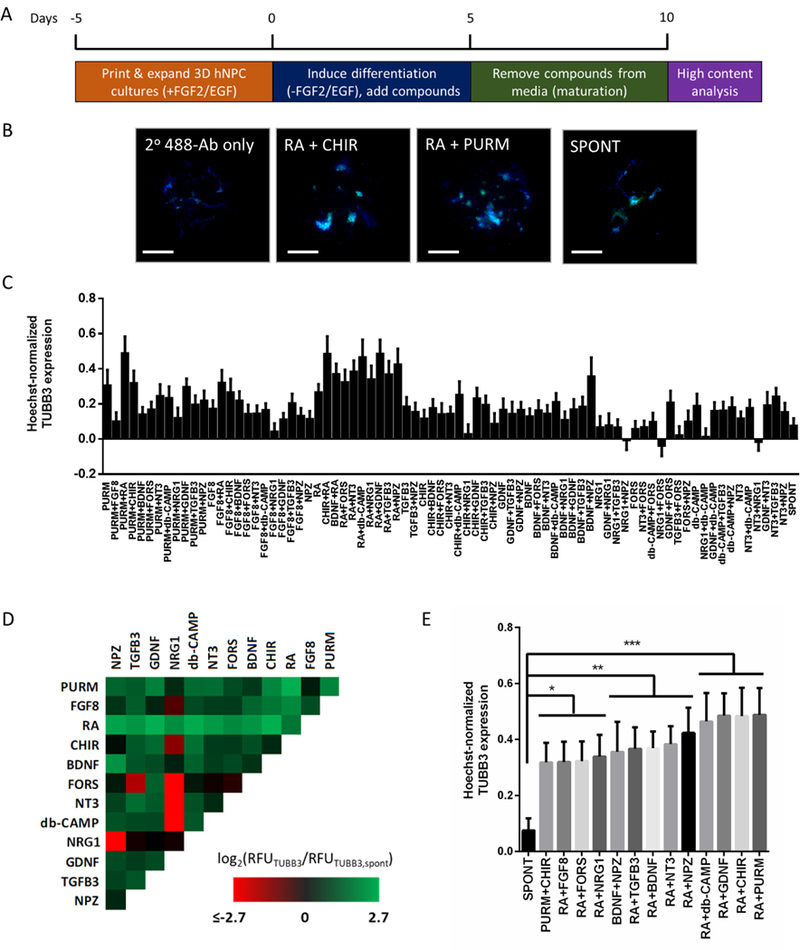
Individual and combined effects of 12 soluble differentiation factors on TUBB3 expression within microscale 3D hNPC cultures. (A) 3D hNPC differentiation screen schematic. (B) Representative immunofluorescence-based images used for high-content analysis of 3D hNPC differentiation outcomes. Chosen images depict antibody-based detection of TUBB3 expression (green) and Hoechst 33342-based detection of cell nuclei (blue) for the no primary antibody control, conditions which increased the relative TUBB3 expression (CHIR + RA and PURM + RA), and the spontaneous (no factors added) control. Scale bar = 300 μm. (C) The average Hoechst 33342 normalized TUBB3 expression from n = 12 collected from three independent screens is plotted for each condition tested. Mean ± SEM plotted. (D) Log2 heat map of TUBB3 expression relative to spontaneous differentiation. Three replicate screens were performed and the log2 relative fluorescence of each screened condition was normalized by that of the spontaneous differentiation. To elucidate the influence of individual and combination treatments, the log2 values were used to generate a heat map by correlating values to a color gradient between the minimum (red) and maximum (green) values. (E) Select conditions from 3D hNPC neuronal differentiation screen. One-way ANOVA analysis of the Hoechst 33342 normalized TUBB3 expression identified several conditions that resulted in statistically significant different TUBB3 expression compared to the spontaneous differentiation control (*=p<0.05, **=p<0.01, ***=p<0.0001). Mean ± SEM plotted.
To identify trends, the normalized TUBB3 expression was divided by the average normalized TUBB3 expression from the spontaneous differentiation control and visualized using a log2 heat map (Figure 1D). Overall, conditions containing RA had higher TUBB3 expression, while those containing NRG1 had lower TUBB3 expression relative to the spontaneous differentiation. Additionally, paired combinations typically resulted in more TUBB3 expression in comparison to individual compounds. A one-way ANOVA of average TUBB3 expression and post-hoc analysis (using Dunnett’s correction to account for multiple comparisons) identified 13 neuronal differentiation conditions that were statistically different (p < 0.05) from spontaneous differentiation (Figure 1E) (Dunnett & Tamhane, 1992). Moreover, only paired combinations were significantly different from spontaneous differentiation, and 11 of the 13 significant combinations contained RA. Indeed, every combination containing RA resulted in significantly higher TUBB3 expression compared to spontaneous differentiation. Identification of RA as a strong inducer of neuronal differentiation was not surprising, as RA is well known to induce neuronal differentiation on multiple types of neural progenitor cells (Erceg et al., 2008; Janesick, Wu, & Blumberg, 2015; Takahashi, Palmer, & Gage, 1999). It was interesting, however, that in our screen RA treatment alone was not identified as being statistically significant, but combined treatment of RA with other led to more pronounced effects, which is consistent with its differentiation inducing effects reported in the literature (Encinas et al., 2000; Takahashi et al., 1999). In addition, apart from combinations with RA, significantly enhanced neuronal differentiation, as reflected in enhanced TUBB3 expression, was also observed for PURM + CHIR and BDNF + NPZ (Figure 1E). As with RA alone, individual components in these two pairs did not lead to significant increases in TUBB3 expression (Figure 1C). Overall, this initial screen provided a rapid assessment of conditions on their ability to promote neuronal differentiation and identified several interesting conditions for subsequent analysis.
Dose-response effects of select conditions on 3D Matrigel hNPC differentiation
The strength of biological signals can alter cellular responses and differentiation outcomes. Thus, we proceeded to examine the dose dependence of select media combinations on hNPC differentiation in 3D Matrigel. The screen was performed in a 42 factorial design, wherein the concentration of each component of the chosen combination was varied at four levels (no compound, and respectively low, medium and high concentrations). Expression of six cell-type specific protein markers was investigated to characterize more broadly the dose-dependent effects of the chosen combinations on 3D hNPC differentiation outcomes following a 10-day differentiation as outlined in Figure 1A. Neuronal differentiation was assessed by expression of both the early neuronal marker TUBB3 and the more mature neuronal protein marker microtubule-associated protein 2B (MAP2B), thereby providing an opportunity to assess the extent of neuronal differentiation (Menezes & Luskin, 1994). Expression of tyrosine hydroxylase (TH), an enzyme required for biosynthesis of dopamine, was quantified to evaluate specific differentiation into dopaminergic neurons (van den Pol, Herbst, & Powell, 1984). The ReNcell VM line, a non-clonal v-myc immortalized cell line derived from human ventral mesencephalon tissue, is a heterogenous mixture of neural progenitors at various stages of development and is known to differentiate toward a dopaminergic fate because of its location in the brain (Donato et al., 2007; Rhim et al., 2015). As with early and late neuronal differentiation, glial differentiation was characterized by expression of glial fibrillary acidic protein (GFAP), an early astrocytic marker, and the calcium binding protein S100β, expressed in mature astrocytes (Raponi et al., 2007). Lastly, expression of nestin (NES), an intermediate filament expressed in undifferentiated hNPCs and immature neural cells, was measured to assess maturation from the progenitor stage (Dahlstrand, Lardelli, & Lendahl, 1995; Park et al., 2010).
Based on the initial screen, three combinations (RA + CHIR, BDNF + NPZ, and NRG1 + NT3) were chosen for further analysis. Treatments of RA + CHIR (p < 0.0001) and BDNF + NPZ (p < 0.01) resulted in substantial and statistically significant enhancement of TUBB3 expression in comparison to spontaneous differentiation. Conversely, NRG1 + NT3 reduced TUBB3 expression relative to NT3 or NRG1 alone.
RA and CHIR
Increased expression of both neuron-specific proteins TUBB3 (two-way ANOVA p < 0.10) and MAP2B (two-way ANOVA p < 0.05) (Figure 2A, Table S2) was observed in differentiating cultures as a function of increased RA concentration. At 1 μM RA, TUBB3 expression increased nearly 1.5-fold over spontaneous differentiation, while MAP2B expression increased approximately 2-fold. Decreased MAP2B and TUBB3 expression at 2 μM RA could suggest a narrow effective concentration range of RA on enhancing neuronal differentiation. This was not due to toxicity, as no loss in cell viability was observed in the differentiating cultures at the concentrations tested (Figure S2). RA treatment alone did not impact TH expression. Notably, RA treatment was found to decrease expression of GFAP beginning at 0.25 μM, S100β beginning at 1 μM, and NES beginning at 2 μM – all of which were supported by two-way ANOVA analysis (Figure 2A, Table S2). The decreased expression of astrocytic protein markers coinciding with increased expression of neuron-specific protein markers suggests that RA treatment biases 3D hNPC differentiation outcomes toward neuronal fates, which is consistent with previous literature reports in 2D culture (Takahashi et al., 1999). Meanwhile, the decreased NES expression could signify a more rapid departure from the progenitor stage and is in agreement with the potent morphogenic activity of RA, which is an endogenous agonist of cellular retinoic acid receptor proteins that induces differentiation of many tissues, including terminal neural differentiation (Janesick et al., 2015).
Figure 2.
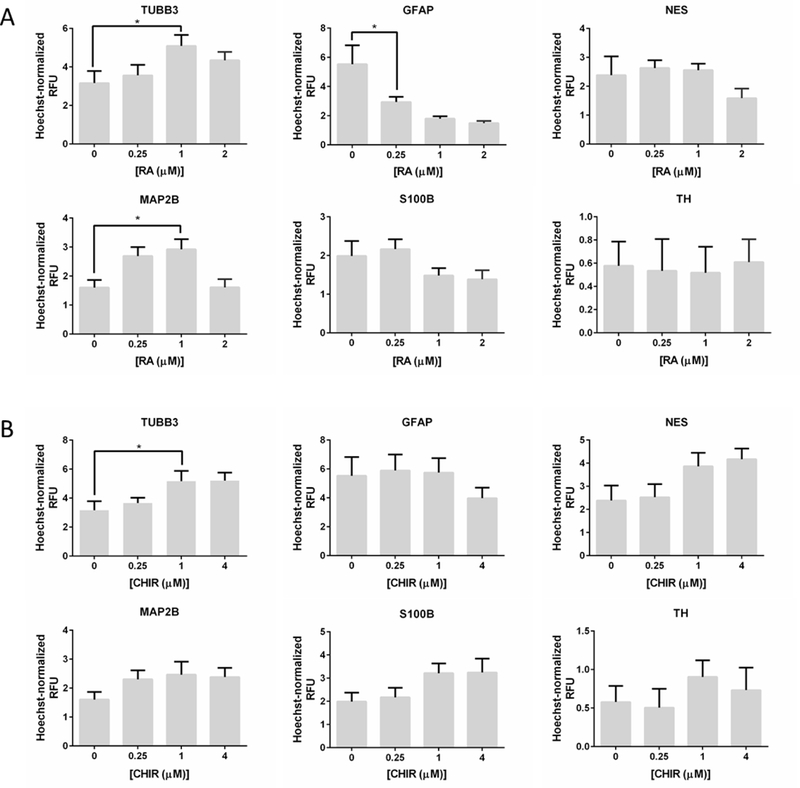
Dose-response effects of (A) RA treatment and (B) CHIR treatment on the expression of six cell-type specific protein markers during 3D ReNcell VM hNPC differentiation. The mean immunofluorescence-based RFU was normalized by Hoechst 33342 and averaged over n=9 replicates, compiled from three independent screens. Mean ± SEM plotted.
CHIR treatment alone was found to have a positive effect on expression of TUBB3 and MAP2B, which was supported by two-way ANOVA analysis (Figure 2B, Table S2). CHIR treatment also decreased GFAP expression, although this effect was only evident at 4 μM CHIR. Additionally, there was a positive trend between CHIR concentration and expression of S100β and NES (Figure 2B). As with RA, CHIR did not have a substantial effect on TH expression. Taken together, these results suggest that CHIR has complex effects that are difficult to delineate within a heterogenous mixture of neural progenitors (including multipotent, glial and neuronal-restricted progenitors). CHIR, a small molecule inhibitor of glycogen synthase kinase 3 (GSK3), activates canonical Wnt signaling, which is important for both maintenance and differentiation of neural progenitor cells during development (Andersson et al., 2013; Arenas, 2014; Metcalfe & Bienz, 2011; Wu & Pan, 2010). Based on our results, CHIR treatment appears to increase the proportion of ReNcells differentiating toward neurons (increased TUBB3 expression) and enhance neuronal maturation (increased MAP2B expression).
In addition, stable and eventual decreased GFAP expression suggests that CHIR inhibits differentiation toward astrocytes, and that increased S100B expression could be a result of indirect enhanced astrocyte maturation due to Wnt-mediated neurogenesis, as observed by Kasai et al. (2005). Specifically, Wnt-mediated neuronal differentiation may result in Notch activation, which is involved in regulating glial differentiation as well as maintenance of progenitor pools (Nusse et al., 2008). Thus, the increased NES expression observed at higher CHIR concentrations may also be an indirect effect of CHIR inducing a subset of neural progenitors toward a neuronal fate, as illustrated in Figure S3 (Chenn, 2008; Formosa-Jordan, Ibanes, Ares, & Frade, 2012). Moreover, it is likely that FGF2 removal from the 3D matrix (following removal from the medium) is gradual because Matrigel contains heparan sulfate (HS) proteoglycans, which have a high affinity for FGFs (Akashi et al., 2005; Tsilibary et al., 1988). Indeed, Matrigel simultaneously decreases the diffusivity of FGF2 across a porous membrane and entraps soluble FGF2 within its matrix in a process that is attenuated by soluble HS (Dabin & Courtois, 1991; Dowd, Cooney, & Nugent, 1999). Moreover, HS is a component of the basal ReNcell medium. Therefore, the increased expression of NES observed at higher CHIR concentrations may be a result of residual FGF2 in the 3D microenvironment.
The combinatorial effects of RA and CHIR on differentiation outcomes were also evaluated to identify interaction effects between the compounds. Based on our initial screen, we expected combined treatments of RA and CHIR to further enrich expression of TUBB3 and MAP2B relative to treatments with RA or CHIR alone. While this was largely observed, trends to this effect were somewhat inconsistent (Figure 3). For example, the combination of 1 μM RA and of 4 μM CHIR led to nearly 30% higher expression of TUBB3 compared to 1 μM RA treatment alone. However, there was no clear trend in TUBB3 expression with increasing CHIR concentration in the presence of RA. Unlike TUBB3 expression, the combined effects of RA and CHIR on MAP2B expression resembled the trends observed for RA and CHIR individually (Figure 3).
Figure 3.
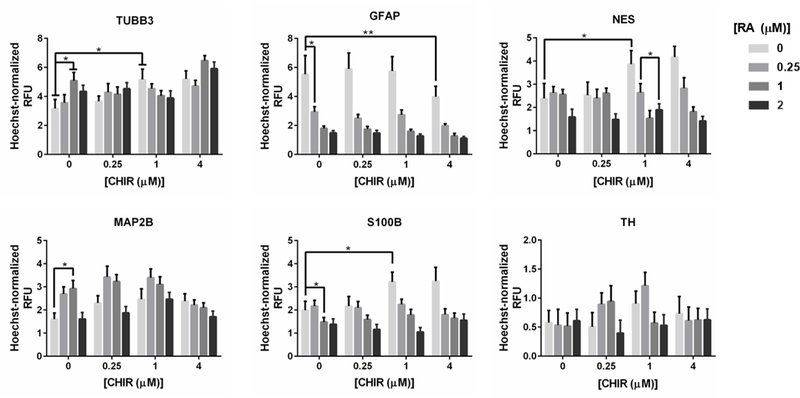
The dose-response effects of RA, CHIR, and their combinations on expression of six cell-type specific protein markers during 3D ReNcell VM hNPC differentiation. The mean immunofluorescence-based RFU was normalized by Hoechst 33342 and averaged over n=9 replicates, compiled from three independent screens. Mean ± SEM plotted. *p < 0.05 from multiple comparisons using Tukey’s correction.
Combined RA and CHIR treatment resulted in decreased GFAP expression. We observed CHIR treatment alone only had a measurable effect at 4 μM while as described above, RA alone decreased GFAP expression at all concentrations tested. Thus, while higher concentrations of combined RA and CHIR were found to lead to even lower GFAP expression, the decrease is largely due to RA. The effect of combined RA and CHIR treatment on S100B expression was interesting because S100B expression, in the presence of CHIR alone, increased while it decreased in the presence of RA alone. When treated with both RA and CHIR, S100B expression decreased, which suggests that RA has a greater effect on S100B expression than does CHIR. NES expression followed a similar trend. These results suggest that RA and CHIR impact ReNcell VM differentiation in mechanistically distinct ways. Combined treatment of RA and CHIR resulted in CHIR potentiating the effects of RA at 1 and 4 μM CHIR, as supported by two-way ANOVA analysis (Table S2). We also observed that select combinations (e.g., 0.25 μM RA + 1 μM CHIR) increased expression of the dopaminergic neuron marker TH by nearly 2-fold in differentiating 3D cultures of ReNcell VM (Figure 3). This result is consistent with literature reports that Wnt signaling is a key facilitator of midbrain dopaminergic neuronal differentiation, and that these effects are closely connected with the strength of its signaling (Andersson et al., 2013; Joksimovic & Awatramani, 2014).
The selectivity of RA and CHIR treatment in directing differentiation toward neuronal fates of 3D hNPC cultures was also evaluated using two distinct methods. The first compared the ratio of the percentage of TUBB3 positive cells divided by GFAP positive cells, as determined using Cellomics software’s automated image analysis. As shown in Figure 4A, addition of CHIR to RA increased the percentage of differentiated neurons (more green color), with the greatest effect observed with 2 μM RA + 4 μM CHIR. These differentiated cultures consisted of ~60% neurons and ~10% astrocytes (Figure S4B and C). Taken into context with viability analysis, it is possible that some of this enrichment may be a result of neuronal induction and selective killing of astrocytes, since a reduction in viability was observed at this combined concentration (Figure S2). The 3D hNPCs grew and differentiated as interconnected cell aggregates, which can limit the accuracy of image fluorescence intensity gating (Figure S4A). Thus, in addition to this method, a ratio of immunofluorescence-based intensity values of neuron-specific and astrocyte-specific protein markers (e.g., TUBB3, MAP2B and GFAP, S100B) was used to calculate a fluorescence-based ratio as an estimate of both fate commitment and maturation in response to treatment. The immunofluorescence-based expression of each marker was normalized by the spontaneous condition to account for differences in antibody affinity. Consistent with our compositional analysis, addition of CHIR to RA enriched neuronal differentiation and maturation (darker green color), with the greatest effect observed with 2 μM RA + 1 μM CHIR (Figure 4D). These methods are not equivalent; image gating analysis provided an analysis of fate specification while immunofluorescence intensity analysis provides information on fate specification and maturation.
Figure 4.
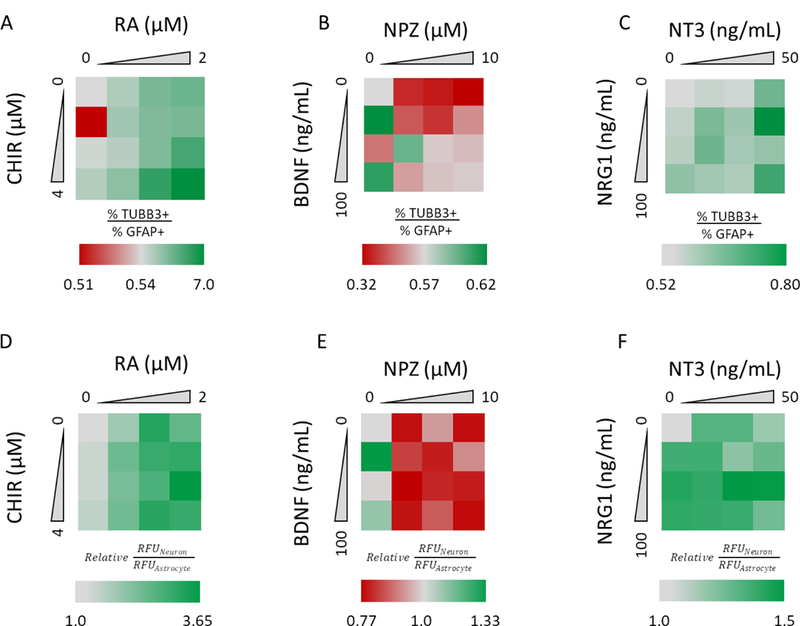
The dose-dependent effects of select combinations on enhanced neuronal specificity relative to astrocyte differentiation by relative percent composition and immunofluorescence-based intensities. Heat maps of the ratio of percentage of TUBB3 positive cells divided by GFAP positive cells in differentiated 3D hNPC cultures during treatment with: (A) RA and CHIR combinations; (B) NPZ and BDNF combinations; and (C) NT3 and NRG1 combinations. Heat maps of the ratio of immunofluorescence-based intensities of spontaneous differentiation normalized neuronal markers (TUBB3+MAP2B) divided by astrocytic markers (GFAP+S100B) of 3D hNPC cultures differentiated with treatment of (D) RA and CHIR combinations, (E) NPZ and BDNF combinations and (F) NT3 and NRG1 combinations.
BDNF and NPZ
Based on our initial screen, we expected that the combined treatment of BDNF, an agonist of tropomyosin receptor kinase B (TrkB), and NPZ, a strong small molecule promoter of neuronal differentiation in rat hippocampal progenitor cells, would result in increased enrichment of neuron specific proteins (Segal, 2003; Warashina et al., 2006). However, the combined treatment of BDNF and NPZ resulted in expression profiles of TUBB3 and MAP2B that resembled those obtained from BDNF or NPZ treatment alone (see Table S2, Figure S5, Figure S6, and Supplemental Information). For example, MAP2B expression increased with increasing concentration of BDNF, but was unaffected by NPZ treatment (Figure S5, Figure S6). Similar results were obtained for NES, GFAP, S100B and TH in that there were no consistent expression trends from combinations of BDNF and NPZ (data not shown).
Analysis of the selectivity between neuronal and glial fates revealed BDNF alone slightly enriched neuronal fates, but NPZ enriched expression of glia specific protein markers (Figures 4B and4E). Nonetheless, the composition of NPZ-differentiated 3D hNPC cultures was predominantly astrocytic (Figures S4C and S4F). This result was interesting in view of Warashina et al., who reported that 10 μM NPZ increased the number of TUBB3 expressing cells in differentiating rat hippocampal neural stem cells while simultaneously decreasing the number of GFAP expressing cells, and this effect was stronger than 5 μM RA (Warashina et al., 2006). Based on our initial screen and subsequent analysis, our results suggest the pro-neuronal effects of NPZ may be limited to rat or hippocampal cell sources, or the pro-neurogenic effects may be reduced in 3D microscale culture.
NT3 and NRG1
NT3, an agonist of tropomyosin receptor kinase C (TrkC), and NRG1, a secreted peptide with binding activity for ErbB-3 and ErbB-4 receptor tyrosine kinases, individually had minimal effects on the markers tested (Mei & Xiong, 2008; Segal, 2003). Only NES was negatively impacted by NT3 (Table S2, Figure S7, Figure S8, Supplemental Information). Based on our initial screen, it was expected that combined treatment of NT3 and NRG1 would decrease expression of neuronal specific protein markers relative to spontaneous differentiation based on our initial screen. While this was observed for TUBB3 at higher concentrations tested (10 and 100 ng/mL for NT3 and NRG1, respectively), consistent trends were not observed (Figure S8A). Additionally, combinations of NT3 and NRG1 also significantly impacted NES expression (Figure S8B). However, analysis of differentiated 3D hNPC cultures revealed that combined treatments of NT3 and NRG1 resulted in an enrichment of neuronal fate over an astrocytic fate and was strongest in the presence of NRG1 with 50 ng/mL of NT3 (Figures 4C and4F). Compositional analysis of these cultures revealed that they also remained predominantly astrocytic (Figures S4D and S4G). Together, our results suggest NRG1 treatment may be involved in a complex regulatory control of fate specification and preservation of an undifferentiated state.
Effect of RA, CHIR and their combination on 3D neuronal subtype specification
Combined treatment with RA and CHIR enhanced neuronal differentiation, and the dose-dependent effects of combined RA and CHIR on TH expression indicated that their combination may be effective in guiding neuronal subtype specification, e.g., subtype differentiation (Figure 3). Thus, we repeated the dose response experiment of RA, CHIR and their combination to investigate their impact on neuronal subtype specification. Expression of vesicular glutamate transporter 2 (VGLUT2), choline acetyltransferase (CHAT), glutamic acid decarboxylase (GAD65) and TH was measured to assess how RA and CHIR impact specification toward glutamatergic, cholinergic, GABAergic and dopaminergic neurons, respectively, as these are considered broad markers for these neuronal subtypes (Ichikawa, Ajiki, Matsuura, & Misawa, 1997; Todd et al., 2003; van den Pol et al., 1984; Zhao, Eisinger, & Gammie, 2013).s
Following differentiation, cultures were double-stained to assess expression of TUBB3 and one of the noted neuronal subtype protein markers. The Hoechst-normalized fluorescence intensities of TUBB3 and each subtype marker were plotted (Figure S9), and a two-way ANOVA analysis was used to identify whether RA and CHIR treatment had any significant effects on generating specific neuronal subtypes (Table 1). Individual treatment with either RA (p < 0.0001) or CHIR (p < 0.0001) was found to significantly increase TUBB3 expression, largely in agreement with our previous dose-response assessment (Table S2). However, a statistically significant interaction effect between RA and CHIR on TUBB3 expression was found during the subtype specification screen (Table 1), and CHIR was less effective at enhancing TUBB3 expression (Figure S9). The experimental variance resulting in these minor differences is likely a result of the non-clonal, heterogenous properties of the hNPC cell line and the undefined Matrigel matrix. As for the effects on neuronal subtype specification, we observed that RA alone significantly increased expression of GAD65, VGLUT2, TH and CHAT. Meanwhile, CHIR treatment was found to increase expression of GAD65, VGLUT2 and CHAT (Table 1, Figure S9); however, to a lesser extent than RA. Interactive effects that would enhance expression of any of the subtype markers tested were determined not to be significant. Together, these results indicate that while RA and CHIR may be used to enhance neuronal differentiation of mixed progenitors, they do not have a strong effect on biasing the subtype specification of the differentiating ReNcell VM by themselves. These findings appear to be consistent with the literature on RA induction of motor neuron development (Xiao et al., 2016), as well as the other predominant midbrain neuronal subtypes (Chatzi, Brade, & Duester, 2011; Cooper et al., 2010; Morales & Root, 2014; Root et al., 2016).
Table 1.
Nierode et al. ANOVA analysis of the individual and combined effects of RA and CHIR on expression of neuronal subtype specific protein markers. Analysis of a dose-response factorial screen of RA, CHIR and combined treatments on expression of pan-neuronal (TUBB3), dopaminergic (TH), GABAergic (GAD65), cholinergic (CHAT) and glutamatergic (VGLUT2) protein markers from two independent screens, wherein each condition had three technical replicates per chip screen (n=6 total replicates per condition and marker). N.S. = non-significant effect. ANOVA from a dose-response.
| Media Additive Effects | |||
|---|---|---|---|
| Protein | RA | CHIR | RA x CHIR |
| P-value | P-value | P-value | |
| TUBB3 | <0.0001 | <0.0001 | 0.002 |
| TH | <0.05 | N.S | N.S |
| GAD65 | <0.001 | <0.05 | N.S |
| CHAT | <0.0001 | <0.0001 | N.S |
| VGLUT2 | <0.0001 | <0.001 | N.S |
Scaling-up 3D hNPC differentiation
To qualitatively determine whether results identified on-chip translate to larger (bulk) scales, we repeated the 3D differentiation experiment using the previously chosen select combinations (RA + CHIR, BDNF + NPZ, and NRG1 + NT3) in well plates at a 3D matrix volume of 100 μL for a 1,000-fold scale up. The cell density was maintained constant between the on-chip and 3D bulk differentiation, but the ratio of cells to media could not be kept constant due to size restrictions of the well plate. On-chip differentiation consisted of a gel-to-media ratio of 1:8.5 (100 nL 3D culture in 850 nL of media) and 3D bulk differentiation was performed at a ratio of 1:4 (100 μL 3D culture in 400 μL of media). Western blot detection of TUBB3, GFAP and β-actin (loading control) expression was used to analyze of changes in protein expression during bulk 3D hNPC differentiation in the presence of select media additives relative to a spontaneous differentiation control (Figure S10).
Western blot densitometry analysis of TUBB3 expression following ReNcell VM differentiated in 100 μL 3D matrix cultures was qualitatively similar that observed in 100 nL 3D matrices within microscale chip-based cultures (Figure 5A). For example, at the microscale, RA, CHIR and their paired combination resulted in increased TUBB3 expression relative to spontaneous differentiation, and the paired RA + CHIR had the strongest positive influence on TUBB3 expression. This was similarly observed in 3D bulk cultures (Figure 5A). BDNF treatment was also found to enhance TUBB3 expression in both microscale and bulk. There were also similarities in changes in GFAP expression between microscale and bulk (Figure 5B). Specifically, NT3, CHIR and RA + CHIR resulted in decreased GFAP expression at the microscale and bulk.
Figure 5.
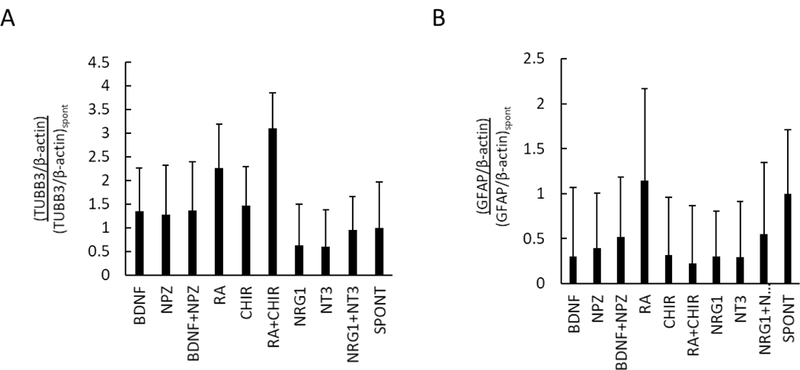
Western blot analysis of individual and combined effects of select factors on differentiation outcomes of 100 μL 3D Matrigel ReNcell VM hNPC cultures. (A) Densitometry analysis of western blot detection of (A) TUBB3 and (B) GFAP expression following 3D ReNcell VM differentiation in 100 μL of 1% Matrigel relative to the spontaneous (no factors added) condition. Mean ± SD plotted for n = 2 independent biological replicates.
Some qualitative differences were also observed in GFAP expression between 3D microscale and 3D bulk. In 3D microscale (100 nL), NPZ treatment increased GFAP expression, but in bulk NPZ treatment decreased GFAP expression relative to spontaneous differentiation (Figure 5B). In addition, RA treatment alone at the microscale resulted in decreased GFAP expression, yet minimal effect on GFAP expression was observed in the 3D 100 μL cultures. Conversely, NRG1 and NT3 did not strongly influence GFAP expression at the microscale, yet in bulk they decreased GFAP expression relative to spontaneous differentiation.
The higher variability observed in 3D bulk differentiation as compared with the chip may be a result of the increased diffusional limitations within the larger 3D matrix in the well plate experiments and the different experimental methodologies employed, e.g., immunofluorescence for the chip experiments and Western blots for the well plate experiments. Nonetheless, qualitatively, these results suggest that the scale of 3D culture did not impact the neurogenesis process imparted by addition of compounds but may impact astrocyte development. As indicated above, one possible cause for this scaling effect may be due to diffusional limitations at the larger scale. Our previous result with the HepG2 human hepatoma cell line showed enhanced diffusion of oxygen and/or nutrients at the microscale vs. in 96-well plates (Meli, Jordan, Clark, Linhardt, & Dordick, 2012), and this is similar to that observed by Ranga et al. (Ranga et al., 2014). Thus, the bulk 3D cultures may have decreased oxygen levels, and Mutoh and colleagues have demonstrated that decreased oxygen levels impact astrocyte differentiation in the developing brain through epigenetic modifications (Mutoh, Sanosaka, Ito, & Nakashima, 2012). The 3D microscale screening results are representative of conditions of minimal diffusional limitations on nutrients or oxygen and may, therefore, reflect a more direct indication of the effects of the tested components on 3D hNPC differentiation outcomes.
Conclusions
Due to the improved physiological relevance of 3D cultures, it is expected that use of 3D stem cell-derived cell culture models will continue to expand. Therefore, there is a demand for high-throughput cell culture screening platforms that can be used to investigate differentiation of stem cells in 3D cultures to identify optimal differentiation conditions. Herein, we used a cell culture microarray platform to screen rapidly individual and combined soluble factors for enhanced neuronal differentiation of 3D ReNcell VM hNPC cultures. Multiple conditions were identified from this initial screen, and subsequent dose-dependent differentiation screening more broadly characterized the differentiation effects for three selected conditions (RA+CHIR, BDNF+NPZ, and NT3+NRG1). From these studies, we found that combined RA and CHIR treatment resulted in a substantial increased neuronal differentiation and a simultaneous decrease in astrocyte differentiation. Further investigation of RA and CHIR on neuronal differentiation revealed that their combination alone does not bias the subtype specification of differentiating neurons but may be a good lead for further differentiation optimization. For example, there is great interest is controlling stem cell differentiation through engineering the ECM composition and 3D spatial patterning (Gattazzo, Urciuolo, & Bonaldo, 2014; Ranga et al., 2014; Solanki et al., 2010), and combined interrogation of ECM and soluble effects may result in even more finely-tuned control over differentiation outcomes.
Upon scale up, we observed that RA+CHIR had a similar effect on neuronal differentiation in both 100 nL and 100 μL 3D cultures. Together, these results begin to assess how differentiation factors influence differentiation outcomes of human neural progenitor cells when differentiated in 3D, while also demonstrating the application of a robust microarray-based platform capable of high-throughput and high-content characterization of 3D differentiation outcomes. This type of platform and screening approach will be useful for the development of and identification of specific conditions to improve the controlled differentiation of 3D stem cell cultures, which will enable their widespread use for applications such as drug discovery and toxicity screening.
Supplementary Material
Acknowledgements
This work was supported by NIH (ES020903) and the New York State Stem Cell Science Program.
References
- Adil MM, Rodrigues GMC, Kulkarni RU, Rao AT, Chernavsky NE, Miller EW, & Schaffer DV (2017). Efficient generation of hPSC-derived midbrain dopaminergic neurons in a fully defined, scalable, 3D biomaterial platform. Scientific Reports, 7, 40573 http://doi.org/10.1038/srep40573 [DOI] [PMC free article] [PubMed] [Google Scholar]
- Akashi T, Minami J, Ishige Y, Eishi Y, Takizawa T, Koike M, & Yanagishita M (2005). Basement membrane matrix modifies cytokine interactions between lung cancer cells and fibroblasts. Pathobiology, 72(5), 250–259. http://doi.org/10.1159/000089419 [DOI] [PubMed] [Google Scholar]
- Andersson ER, Salto C, Villaescusa JC, Cajanek L, Yang S, Bryjova L, … Arenas E (2013). Wnt5a cooperates with canonical Wnts to generate midbrain dopaminergic neurons in vivo and in stem cells. Proceedings of the National Academy of Sciences, 110(7), E602–E610. http://doi.org/10.1073/pnas.1208524110 [DOI] [PMC free article] [PubMed] [Google Scholar]
- Arenas E (2014). Wnt signaling in midbrain dopaminergic neuron development and regenerative medicine for Parkinson’s disease. Journal of Molecular Cell Biology. http://doi.org/10.1093/jmcb/mju001 [DOI] [PubMed] [Google Scholar]
- Breier JM, Gassmann K, Kayser R, Stegeman H, De Groot D, Fritsche E, & Shafer TJ (2010). Neural progenitor cells as models for high-throughput screens of developmental neurotoxicity: state of the science. Neurotoxicology and Teratology, 32(1), 4–15. http://doi.org/10.1016/j.ntt.2009.06.005 [DOI] [PubMed] [Google Scholar]
- Chatzi C, Brade T, & Duester G (2011). Retinoic acid functions as a key gabaergic differentiation signal in the basal ganglia. PLoS Biology, 9(4). http://doi.org/10.1371/journal.pbio.1000609 [DOI] [PMC free article] [PubMed] [Google Scholar]
- Chenn A (2008). Wnt/beta-catenin signaling in cerebral cortical development. Organogenesis, 4(2), 76–80. http://doi.org/10.4161/org.4.2.5852 [DOI] [PMC free article] [PubMed] [Google Scholar]
- Choi SH, Kim YH, Hebisch M, Sliwinski C, Lee S, D’Avanzo C, … Kim DY (2014). A three-dimensional human neural cell culture model of Alzheimer’s disease. Nature, 515(7526), 274–8. http://doi.org/10.1038/nature13800 [DOI] [PMC free article] [PubMed] [Google Scholar]
- Cooper O, Hargus G, Deleidi M, Blak A, Osborn T, Marlow E, … Isacson O (2010). Differentiation of human ES and Parkinson’s disease iPS cells into ventral midbrain dopaminergic neurons requires a high activity form of SHH, FGF8a and specific regionalization by retinoic acid. Molecular and Cellular Neuroscience, 45(3), 258–266. http://doi.org/10.1016/j.mcn.2010.06.017 [DOI] [PMC free article] [PubMed] [Google Scholar]
- Dabin I, & Courtois Y (1991). In vitro kinetics of basic fibroblast growth factor diffusion across a reconstituted corneal endothelium. Journal of Cellular Physiology, 147(3), 396–402. http://doi.org/10.1002/jcp.1041470303 [DOI] [PubMed] [Google Scholar]
- Dahlstrand J, Lardelli M, & Lendahl U (1995). Nestin mRNA expression correlates with the central nervous system progenitor cell state in many, but not all, regions of developing central nervous system. Developmental Brain Research, 84(1), 109–129. http://doi.org/10.1016/0165-3806(94)00162-S [DOI] [PubMed] [Google Scholar]
- Desbordes SC, Placantonakis DG, Ciro A, Socci ND, Lee G, Djaballah H, & Studer L (2008). High-Throughput Screening Assay for the Identification of Compounds Regulating Self-Renewal and Differentiation in Human Embryonic Stem Cells. Cell Stem Cell, 2(6), 602–612. http://doi.org/10.1016/j.stem.2008.05.010 [DOI] [PMC free article] [PubMed] [Google Scholar]
- Donato R, Miljan E. a, Hines SJ, Aouabdi, S., Pollock K, Patel S, … Sinden JD (2007). Differential development of neuronal physiological responsiveness in two human neural stem cell lines. BMC Neuroscience, 8, 36 http://doi.org/10.1186/1471-2202-8-36 [DOI] [PMC free article] [PubMed] [Google Scholar]
- Dowd CJ, Cooney CL, & Nugent MA (1999). Heparan sulfate mediates bFGF transport through basement membrane by diffusion with rapid reversible binding. Journal of Biological Chemistry, 274(8), 5236–5244. http://doi.org/10.1074/jbc.274.8.5236 [DOI] [PubMed] [Google Scholar]
- Dunnett CW, & Tamhane AC (1992). A step-up multiple test procedure. Journal of the American Statistical Association, 87(417), 162–170. http://doi.org/10.1080/01621459.1992.10475188 [Google Scholar]
- Encinas M, Iglesias M, Liu Y, Wang H, Muhaisen A, Ceña V, … Comella JX (2000). Sequential treatment of SH-SY5Y cells with retinoic acid and brain-derived neurotrophic factor gives rise to fully differentiated, neurotrophic factor-dependent, human neuron-like cells. Journal of Neurochemistry, 75(3), 991–1003. http://doi.org/10.1046/j.1471-4159.2000.0750991.x [DOI] [PubMed] [Google Scholar]
- Erceg S, Laínez S, Ronaghi M, Stojkovic P, Pérez-Aragó MA, Moreno-Manzano V, … Stojkovic M (2008). Differentiation of human embryonic stem cells to regional specific neural precursors in chemically defined medium conditions. PLoS ONE, 3(5). http://doi.org/10.1371/journal.pone.0002122 [DOI] [PMC free article] [PubMed] [Google Scholar]
- Formosa-Jordan P, Ibanes M, Ares S, & Frade JM (2012). Regulation of neuronal differentiation at the neurogenic wavefront. Development, 139(13), 2321–2329. http://doi.org/10.1242/dev.076406 [DOI] [PubMed] [Google Scholar]
- Frese CK, Mikhaylova M, Stucchi R, Gautier V, Liu Q, Mohammed S, … Hoogenraad CC (2017). Quantitative Map of Proteome Dynamics during Neuronal Differentiation. Cell Reports, 18(6), 1527–1542. http://doi.org/10.1016/j.celrep.2017.01.025 [DOI] [PMC free article] [PubMed] [Google Scholar]
- Gattazzo F, Urciuolo A, & Bonaldo P (2014). Extracellular matrix: A dynamic microenvironment for stem cell niche. Biochimica et Biophysica Acta - General Subjects. http://doi.org/10.1016/j.bbagen.2014.01.010 [DOI] [PMC free article] [PubMed] [Google Scholar]
- Gonzalez R, Garitaonandia I, Abramihina T, Wambua GK, Ostrowska A, Brock M, … Semechkin R. a. (2013). Deriving dopaminergic neurons for clinical use. A practical approach. Scientific Reports, 3, 1463 http://doi.org/10.1038/srep01463 [DOI] [PMC free article] [PubMed] [Google Scholar]
- Gupta K, Kim D-H, Ellison D, Smith C, Kundu A, Tuan J, … Levchenko A (2010). Lab-on-a-chip devices as an emerging platform for stem cell biology. Lab on a Chip, 10(16), 2019–2031. http://doi.org/10.1039/c004689b [DOI] [PubMed] [Google Scholar]
- Ichikawa T, Ajiki K, Matsuura J, & Misawa H (1997). Localization of two cholinergic markers, choline acetyltransferase and vesicular acetylcholine transporter in the central nervous system of the rat: In situ hybridization histochemistry and immunohistochemistry. Journal of Chemical Neuroanatomy, 13(1), 23–39. http://doi.org/10.1016/S0891-0618(97)00021-5 [DOI] [PubMed] [Google Scholar]
- Janesick A, Wu SC, & Blumberg B (2015). Retinoic acid signaling and neuronal differentiation. Cellular and Molecular Life Sciences. http://doi.org/10.1007/s00018-014-1815-9 [DOI] [PMC free article] [PubMed] [Google Scholar]
- Jang J, Quan Z, Yum YJ, Song HS, Paek S, & Kang HC (2014). Induced pluripotent stem cells for modeling of pediatric neurological disorders. Biotechnology Journal http://doi.org/10.1002/biot.201400010 [DOI] [PubMed] [Google Scholar]
- Joksimovic M, & Awatramani R (2014). Wnt/beta-catenin signaling in midbrain dopaminergic neuron specification and neurogenesis. Journal of Molecular Cell Biology. http://doi.org/10.1093/jmcb/mjt043 [DOI] [PubMed] [Google Scholar]
- Kasai M, Satoh K, & Akiyama T (2005). Wnt signaling regulates the sequential onset of neurogenesis and gliogenesis via induction of BMPs. Genes to Cells, 10(8), 777–783. http://doi.org/10.1111/j.1365-2443.2005.00876.x [DOI] [PubMed] [Google Scholar]
- Kohen NT, Little LE, & Healy KE (2009). Characterization of Matrigel interfaces during defined human embryonic stem cell culture. Biointerphases, 4(4), 69–79. http://doi.org/10.1116/1.3274061 [DOI] [PubMed] [Google Scholar]
- Lee H, Dellatore SM, Miller WM, & Messersmith PB (2007). Mussel-Inspired Surface Chemistry for Multifunctional Coatings. Science, 318(5849), 426–430. http://doi.org/10.1126/science.1147241 [DOI] [PMC free article] [PubMed] [Google Scholar]
- Lee H, Rho J, & Messersmith PB (2009). Facile conjugation of biomolecu les onto surfaces via mussel adhesive protein inspired coatings. Advanced Materials, 21(4), 431–434. http://doi.org/10.1002/adma.200801222 [DOI] [PMC free article] [PubMed] [Google Scholar]
- Lei Y, & Schaffer DV (2013). A fully defined and scalable 3D culture system for human pluripotent stem cell expansion and differentiation. Proceedings of the National Academy of Sciences of the United States of America, 110(52), E5039–48. http://doi.org/10.1073/pnas.1309408110 [DOI] [PMC free article] [PubMed] [Google Scholar]
- Mei L, & Xiong WC (2008). Neuregulin 1 in neural development, synaptic plasticity and schizophrenia. Nature Reviews Neuroscience. http://doi.org/10.1038/nrn2392 [DOI] [PMC free article] [PubMed] [Google Scholar]
- Meli L, Jordan ET, Clark DS, Linhardt RJ, & Dordick JS (2012). Influence of a three-dimensional, microarray environment on human Cell culture in drug screening systems. Biomaterials, 33(35), 9087–9096. http://doi.org/10.1016/j.biomaterials.2012.08.065 [DOI] [PMC free article] [PubMed] [Google Scholar]
- Menezes JR, & Luskin MB (1994). Expression of neuron-specific tubulin defines a novel population in the proliferative layers of the developing telencephalon. The Journal of Neuroscience : The Official Journal of the Society for Neuroscience, 14(September), 5399–5416. [DOI] [PMC free article] [PubMed] [Google Scholar]
- Metcalfe C, & Bienz M (2011). Inhibition of GSK3 by Wnt signalling - two contrasting models. Journal of Cell Science, 124(21), 3537–3544. http://doi.org/10.1242/jcs.091991 [DOI] [PubMed] [Google Scholar]
- Morales M, & Root DH (2014). Glutamate neurons within the midbrain dopamine regions. Neuroscience. http://doi.org/10.1016/j.neuroscience.2014.05.032 [DOI] [PMC free article] [PubMed] [Google Scholar]
- Mutoh T, Sanosaka T, Ito K, & Nakashima K (2012). Oxygen levels epigenetically regulate fate switching of neural precursor cells via hypoxia-inducible factor 1α-Notch signal interaction in the developing brain. Stem Cells, 30(3), 561–569. http://doi.org/10.1002/stem.1019 [DOI] [PubMed] [Google Scholar]
- Nierode GJ, Perea BC, McFarland SK, Pascoal JF, Clark DS, Schaffer DV, & Dordick JS (2016). High-Throughput Toxicity and Phenotypic Screening of 3D Human Neural Progenitor Cell Cultures on a Microarray Chip Platform. Stem Cell Reports, 7(5), 970–982. http://doi.org/10.1016/j.stemcr.2016.10.001 [DOI] [PMC free article] [PubMed] [Google Scholar]
- Nusse R, Fuerer C, Ching W, Harnish K, Logan C, Zeng A, … Kalani Y (2008). Wnt signaling and stem cell control. In Cold Spring Harbor Symposia on Quantitative Biology (Vol. 73, pp. 59–66). http://doi.org/10.1101/sqb.2008.73.035 [DOI] [PubMed] [Google Scholar]
- Park D, Xiang AP, Mao FF, Zhang L, Di CG, Liu XM, … Lahn BT (2010). Nestin is required for the proper self-renewal of neural stem cells. Stem Cells, 28(12), 2162–2171. http://doi.org/10.1002/stem.541 [DOI] [PubMed] [Google Scholar]
- Ranga A, Gobaa S, Okawa Y, Mosiewicz K, Negro A, & Lutolf MP (2014). 3D niche microarrays for systems-level analyses of cell fate. Nature Communications, 5, 4324 http://doi.org/10.1038/ncomms5324 [DOI] [PMC free article] [PubMed] [Google Scholar]
- Raponi E, Agenes F, Delphin C, Assard N, Baudier J, Legraverend C, & Deloulme JC (2007). S100B expression defines a state in which GFAP-expressing cells lose their neural stem cell potential and acquire a more mature developmental stage. GLIA, 55(2), 165–177. http://doi.org/10.1002/glia.20445 [DOI] [PMC free article] [PubMed] [Google Scholar]
- Rhim JH, Luo X, Xu X, Gao D, Zhou T, Li F, … Wong STC (2015). A High-content screen identifies compounds promoting the neuronal differentiation and the midbrain dopamine neuron specification of human neural progenitor cells. Scientific Reports, 5(April), 16237 http://doi.org/10.1038/srep16237 [DOI] [PMC free article] [PubMed] [Google Scholar]
- Root DH, Wang HL, Liu B, Barker DJ, Mód L, Szocsics P, … Morales M (2016). Glutamate neurons are intermixed with midbrain dopamine neurons in nonhuman primates and humans. Scientific Reports, 6, 30615 http://doi.org/10.1038/srep30615 [DOI] [PMC free article] [PubMed] [Google Scholar]
- Segal R. a. (2003). Selectivity in neurotrophin signaling: theme and variations. Annual Review of Neuroscience, 26, 299–330. http://doi.org/10.1146/annurev.neuro.26.041002.131421 [DOI] [PubMed] [Google Scholar]
- Solanki A, Shah S, Memoli KA, Park SY, Hong S, & Lee KB (2010). Controlling Differentiation of Neural Stem Cells Using Extracellular Matrix Protein Patterns. Small, n/a--n/a. http://doi.org/10.1002/smll.201001341 [DOI] [PMC free article] [PubMed] [Google Scholar]
- Takahashi J, Palmer TD, & Gage FH (1999). Retinoic acid and neurotrophins collaborate to regulate neurogenesis in adult-derived neural stem cell cultures. Journal of Neurobiology, 38(1), 65–81. http://doi.org/10.1002/(SICI)1097-4695(199901)38:1<65::AID-NEU5>3.0.CO;2-Q [PubMed] [Google Scholar]
- Todd AJ, Hughes DI, Polg??r E, Nagy GG, Mackie M, Ottersen OP, & Maxwell DJ (2003). The expression of vesicular glutamate transporters VGLUT1 and VGLUT2 in neurochemically defined axonal populations in the rat spinal cord with emphasis on the dorsal horn. European Journal of Neuroscience, 17(1), 13–27. http://doi.org/10.1046/j.1460-9568.2003.02406.x [DOI] [PubMed] [Google Scholar]
- Tsilibary EC, Koliakos GG, Charonis AS, Vogel AM, Reger LA, & Furcht LT (1988). Heparin type IV collagen interactions: Equilibrium binding and inhibition of type IV collagen self-assembly. Journal of Biological Chemistry, 263(35), 19112–19118. [PubMed] [Google Scholar]
- Underhill GH, & Bhatia SN (2007). High-throughput analysis of signals regulating stem cell fate and function. Current Opinion in Chemical Biology, 11(4), 357–366. http://doi.org/10.1016/j.cbpa.2007.05.036 [DOI] [PMC free article] [PubMed] [Google Scholar]
- van den Pol AN, Herbst RS, & Powell JF (1984). Tyrosine hydroxylase-immunoreactive neurons of the hypothalamus: A light and electron microscopic study. Neuroscience, 13(4), 1117–1156. http://doi.org/10.1016/0306-4522(84)90292-6 [DOI] [PubMed] [Google Scholar]
- Warashina M, Min KH, Kuwabara T, Huynh A, Gage FH, Schultz PG, & Ding S (2006). A synthetic small molecule that induces neuronal differentiation of adult hippocampal neural progenitor cells. Angewandte Chemie (International Ed. in English), 45(4), 591–3. http://doi.org/10.1002/anie.200503089 [DOI] [PubMed] [Google Scholar]
- Wu D, & Pan W (2010). GSK3: a multifaceted kinase in Wnt signaling. Trends in Biochemical Sciences. http://doi.org/10.1016/j.tibs.2009.10.002 [DOI] [PMC free article] [PubMed] [Google Scholar]
- Xiao C, Cho JR, Zhou C, Treweek JB, Chan K, McKinney SL, … Gradinaru V (2016). Cholinergic Mesopontine Signals Govern Locomotion and Reward through Dissociable Midbrain Pathways. Neuron, 90(2), 333–347. http://doi.org/10.1016/j.neuron.2016.03.028 [DOI] [PMC free article] [PubMed] [Google Scholar]
- Yang F, Cho S-W, Son SM, Hudson SP, Bogatyrev S, Keung L, … Anderson DG (2010). Combinatorial Extracellular Matrices for Human Embryonic Stem Cell Differentiation in 3D. Biomacromolecules, 11(8), 1909–1914. http://doi.org/10.1021/bm100357t [DOI] [PMC free article] [PubMed] [Google Scholar]
- Zhao C, Eisinger B, & Gammie SC (2013). Characterization of GABAergic Neurons in the Mouse Lateral Septum: A Double Fluorescence In Situ Hybridization and Immunohistochemical Study Using Tyramide Signal Amplification. PLoS ONE, 8(8). http://doi.org/10.1371/journal.pone.0073750 [DOI] [PMC free article] [PubMed] [Google Scholar]
Associated Data
This section collects any data citations, data availability statements, or supplementary materials included in this article.