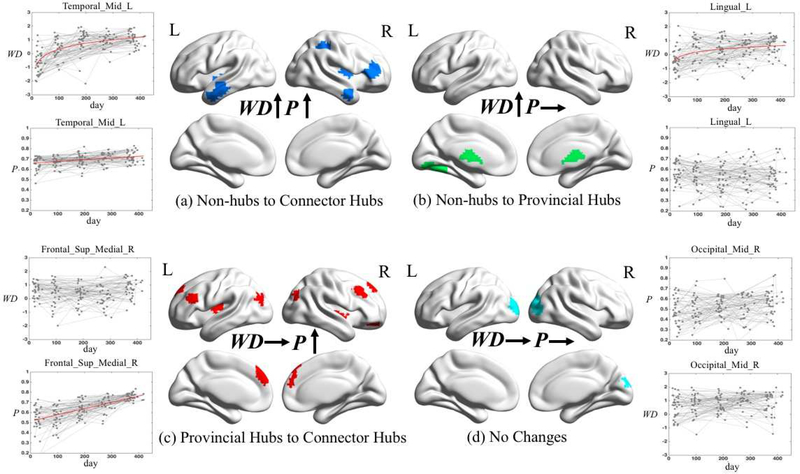
Fig. 5.
The spatial distributions of hubs with (a) both within-module degree (WD) and participation coefficient (P) significantly increased (p<0.001 FDR corrected); (b) only WD significantly increased (p<0.001 FDR corrected); (c) only P significantly increased (p<0.001 FDR corrected); (d) both WD and P having no significant changes (p<0.001 FDR corrected). For each category, we select one brain region and plot its developmental trajectories of WD and P. Statistically significant increasing curves are fitted with the red lines.

