

Abstract
Multidimensional magic-angle spinning solid-state NMR experiments are described that permit cis and trans peptide bonds in uniformly 13C,15N-labeled peptides and proteins to be unambiguously distinguished in residue-specific manner by determining the relative orientations of the amide 13C’ CSA and 1H-15N dipolar coupling tensors. The experiments are demonstrated for model peptides glycylglycine and 2,5-diketopiperazine containing trans and cis peptide bonds, respectively. Subsequently, the measurements are extended to two representative proteins that contain exclusively trans peptide bonds, microcrystalline B3 immunoglobulin domain of protein G and Y145Stop human prion protein amyloid fibrils, to illustrate their applicability to a wide range of protein systems.
Keywords: protein structure, peptide bond conformation, tensor correlation, magic-angle spinning solid-state NMR
Graphical abstract
1. Introduction
Magic angle spinning (MAS) solid-state nuclear magnetic resonance (NMR) has become a widely used technique for the elucidation of atomic-level structure of biological macromolecules [1–8]. Such structural studies typically rely upon experimental restraints on interatomic distances and backbone and side-chain dihedral angles derived from measurements of isotropic chemical shifts, chemical shift anisotropies (CSAs), magnitudes of nuclear dipolar couplings and relative orientations of dipolar coupling and/or CSA tensors [9], and, more recently, paramagnetism-based restraints including pseudocontact shifts and paramagnetic relaxation enhancements [10–12].
A multitude of MAS solid-state NMR tensor correlation techniques, designed to directly measure dihedral angles in uniformly 13C,15N-enriched peptides and proteins, have been developed to date [13–26], with primary focus on determining backbone torsion angles ϕ (Cʹi-1–Ni–Cαi–Cʹi) and ψ (Ni–Cαi–Cʹi–Ni+1) which vary significantly for different secondary structures. In contrast, analogous tensor correlation experiments that are capable of directly probing the peptide bond conformation, defined by torsion angle ω (Cαi-1–Cʹi-1–Ni–Cαi), on a residue-by-residue basis have not been reported; although, we note here that conformations of specific peptide bonds in selectively 13C-labeled peptide and peptoid molecules have been characterized previously using solid-state NMR by determining the relative orientation of the 13Cʹ CSA tensor and the dipolar coupling between that 13Cʹ and a 13Cα spin of the adjacent amino acid residue [27] and the magnitude of the dipolar coupling between two 13Cα nuclei located in neighboring residues [28].
One reason for the somewhat limited focus on directly probing peptide bond ω torsion angles in peptides and proteins by NMR techniques is that the peptide bonds are almost always present in their most thermodynamically stable trans (ω ~ 180°) conformation, while the less favorable cis (ω ~ 0°) conformation or other conformations that are intermediate between cis and trans are relatively rare by comparison [29]. Indeed, a comprehensive survey carried out for a set of nearly six hundred non-redundant proteins with high-resolution X-ray crystal structures deposited in the PDB [30,31], containing over 150,000 peptide bonds, identified only 429 cis peptide bonds altogether (~90% of these corresponded to Xaa-Pro and ~10% to Xaa-non-Pro, where Xaa is any amino acid). Within the same dataset only ~5.2% of all Xaa-Pro and ~0.03% of all Xaa-non-Pro peptide bonds were found to adopt the cis conformation. Interestingly, however, the same study noted a significant correlation between the number of cis peptide bonds identified and the resolution of the crystal structure (e.g., Xaa-non-Pro cis peptide bonds were encountered approximately four times more frequently in structures with <2.0 Å resolution compared to those with ≥2.5 Å resolution), leading to the suggestion that a non-negligible number of cis peptide bonds in proteins may not have been recognized as such during the course of structure determination, particularly for lower resolution structures [30,31]. Additionally, it appears that, in cases where they have been unambiguously identified, Xaa-non-Pro cis peptide bonds may be of particular significance for biological function and mechanism, given that they tend to be located at or in the immediate vicinity of functionally important sites [32–36]. For example, in the structural study of the GyrA intein the peptide bond at the extein-intein boundary was found to be present in a highly strained cis conformation, likely providing part of the driving force required for isomerization and cleavage [35,36].
Xaa-Pro cis and trans peptide bonds in peptides and proteins can be readily distinguished by solution and solid-state NMR on the basis of 13Cβ and 13Cγ chemical shifts of the proline residue [37–40]. In contrast, no similar chemical shift-based approaches are available to unambiguously identify the rare, but potentially functionally relevant, Xaa-non-Pro cis peptide bonds. While, Xaa-non-Pro cis peptide bonds in proteins could in principle be detected from solution NMR measurements of 1Hα−1Hα NOEs between adjacent amino acid residues [41] or from analogous measurements of 1Hα−1Hα and/or 13Cα−13Cα dipolar couplings by MAS solid-state NMR, such measurements may be difficult or impossible to perform in a quantitative manner in either protonated or deuterated uniformly 13C,15N-enriched proteins. Here, we describe multidimensional MAS solid-state NMR experiments that enable the unambiguous identification of cis and trans peptide bonds in uniformly 13C,15N-labeled peptides and proteins in residue-specific fashion by determining the relative orientation of two tensorial interactions: the 13C’ CSA of a selected amino acid residue and the amide 1H-15N dipolar coupling of the following residue. These experiments build upon previous solid-state NMR tensor correlation techniques developed to measure backbone and side-chain dihedral angles [13–26] as well as relative orientations of dipolar and CSA tensorial interactions at specific sites in peptides and proteins [42]. The experiments are first demonstrated on two peptides glycylglycine (GG) and 2,5-diketopiperazine (DKP), which serve as models for trans and cis peptide bonds, respectively (Fig. 1). Subsequently, the experiments are extended toward two representative proteins, microcrystalline B3 immunoglobulin domain of protein G (GB3) and Y145Stop human prion protein (huPrP23– 144) amyloid fibrils, to illustrate their applicability to a wide range of protein systems.
Figure 1.
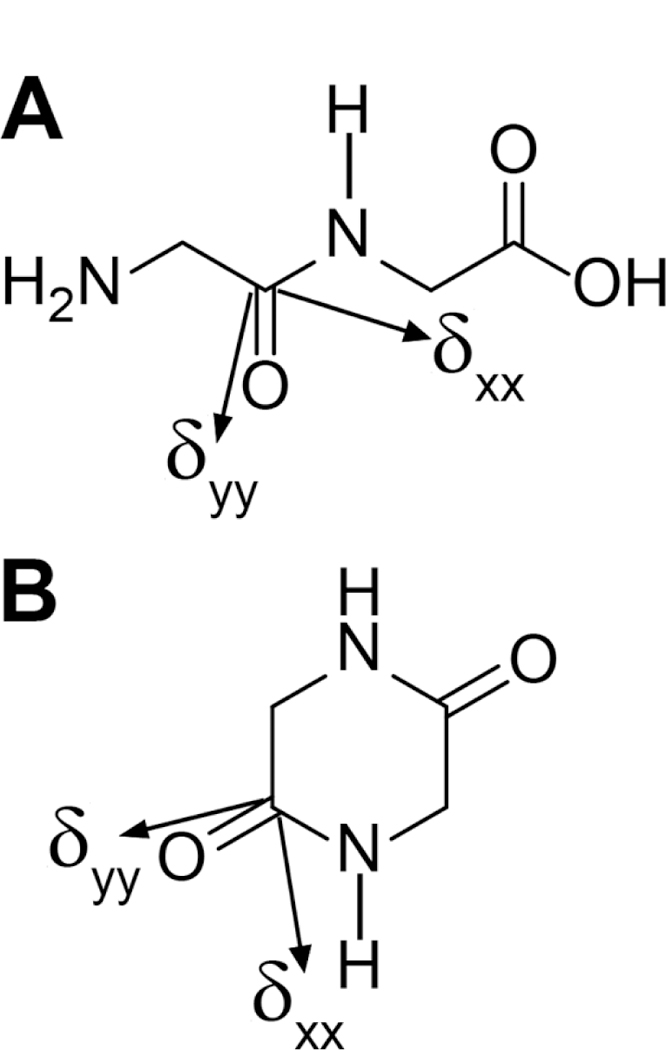
Model peptides (A) glycylglycine and (B) 2,5-diketopiperazine containing peptide bonds with trans and cis conformation, respectively. The 15N-1H dipolar coupling and 13C’ CSA interactions within the peptide bond of interest are indicated. For the 15N-1H dipolar coupling tensor the unique principal axis coincides with the 15N-1H bond. For the 13C’ CSA tensor the approximate orientations of the δxx and δyy principal axes in the molecular frame are indicated (the angle between the δxx axis and the C’-N bond is ~40o), with the δzz axis being perpendicular to the peptide plane [43–45]. The relative orientation of the 13C’ CSA and 15N-1H dipolar coupling tensors depends on the peptide bond torsion angle ω.
2. Materials and methods
2.1. U-13C,15N-glycylglycine
U-13C,15N-labeled glycylglycine was prepared via standard Fmoc solid-phase peptide synthesis using U-13C,15N-Fmoc-glycine purchased from Cambridge Isotope Labs. 2.00 g of Wang resin (AAPPTec) was washed with dichloromethane (DCM) for 30 min and with 10% (v/v) solution of dimethylformamide (DMF) in DCM for 30 min. 200.6 mg of hydroxybenzotriazole monohydrate (HOBt· H2O) and 20.7 mg 4-dimethylaminopyridine (DMAP) were added to 400 mg of U-13C,15N-Fmoc-glycine and dissolved in minimum volume of DMF (~3 mL), followed by addition of 200 μL of N,N’-diisopropylcarbodiimide (DIC). This mixture was then added to the resin and shaken for 14 h, after which 0.1 mL pyridine and 120 μL acetic anhydride were added and the mixture shaken for an additional 30 min. The liquid was removed and the resin washed alternately with DCM and DMF four times. The resin was then dried and washed once more with DMF, followed by addition of 20% (v/v) piperidine in DMF and shaking for 30 min. After drying the resin, a Kaiser test was done confirming presence of free amine. The resin was then washed alternately with DCM and DMF four times, dried, and washed with 10% (v/v) DMF in DCM. A mixture of HOBt·H2O, DMAP and U-13C,15N-Fmoc-glycine and DIC in DMF was then prepared as described above, added to the resin and shaken for 8 h, followed by the alternating wash procedure in DCM and DMF. After the resin was dried, 50% (v/v) trifluoroacetic acid (TFA) in DCM was added and the resin shaken for 2 h. The filtrate was collected, and DCM and TFA removed by drying under vacuum at 60 oC for 2 h and then at 35 oC overnight, followed by air drying at ambient temperature for 24 h. The resulting residue was then combined with 20% (v/v) piperidine in DMF and shaken for 24 h, followed by air drying. The crude GG product was dissolved in water and purified by using reversed-phase HPLC (Waters 1525 HPLC system) with a preparative C18 column, gradient elution with water/acetonitrile containing 0.01% (v/v) TFA, where the H2O concentration was varied from 95% to 70% in 20 min, and a flow rate of 8 mL/min. The identity of the final purified GG was confirmed by routine ESI mass spectrometry and 1H and 13C NMR, with additional comparison to corresponding data obtained for a commercially available glycylglycine (Bachem) reference. For the solid-state NMR experiments the U-13C,15N- glycylglycine was lyophilized, crystallized from aqueous solution as a hydrochloride salt [46], and transferred to a Varian 3.2 mm zirconia rotor.
2.2. U-13C,15N-2,5-diketopiperazine
U-13C,15N-labeled 2,5-diketopiperazine was synthesized by using a microwave-assisted protocol described in the literature [47]. Briefly, 250 mg of U-13C,15N-glycine (Cambridge Isotope Labs) was dissolved in 2 mL of DMF in a 10 mL microwave reaction vessel and placed in a CEM Discover microwave reactor with a set point temperature of 210 oC and a hold time of 30 min. The reaction mixture, which consisted primarily of the desired DKP product, was purified using reversed-phase HPLC under conditions described above for GG, and the identity of the final purified DKP was confirmed by 1H and 13C NMR with additional comparisons to corresponding data obtained for a commercially available 2,5- diketopiperazine (Sigma-Aldrich) reference. For the solid-state NMR experiments U-13C,15N- 2,5-diketopiperazine was lyophilized, crystallized from aqueous solution and transferred to a Varian 3.2 mm zirconia rotor.
2.3. 13C,15N-labeled proteins
Protein samples described in detail in our earlier studies were used including U- 13C,15N-labeled B3 immunoglobulin binding domain of protein G [48], and 13C,15N-enriched Y145Stop human prion protein amyloid fibrils generated from protein expressed using the 1,3-13C-glycerol labeling scheme [49].
2.4. NMR data acquisition and processing
All NMR experiments were performed on a three-channel Varian VNMRS spectrometer operating at frequencies of 499.8 MHz for 1H, 125.7 MHz for 13C, and 50.6 MHz for 15N, equipped with a 3.2 mm BioMAS 1H-13C-15N probe. The MAS frequency was set to 9.921 kHz ± 3 Hz and the effective sample temperature was maintained at ~5°C for all experiments.
Correlation of the 15N-1H dipole and 13C’ CSA tensors as well as encoding of up to two isotropic chemical shift dimensions was performed by using variations of the pulse sequence shown in Fig. 2. The carrier positions were as follows: 4.7 ppm for 1H, 120 ppm for 15N, and 170 ppm (GG and DKP) or 175 ppm (proteins) for 13C. Recycle delays of 2.5 s were used for all experiments except those involving DKP, for which the recycle delay was 10 s due to the longer 1H T1. The 90° pulse lengths were 2.5 μs for 1H, 5 μs for 13C, and 5.5 μs for 15N. 1H-15N cross-polarization (CP) was achieved using a ~45 kHz 1H field and a ~35 kHz 15N field (with a linear ramp), with a contact time of 1.2 ms. Both CW and TPPM [51] 1H decoupling was used as indicated in the pulse scheme with fields of ~100 kHz and ~71 kHz, respectively. Selective 15N-13C’ magnetization transfer was achieved using SPECIFIC CP [52], with a ~35 kHz 15N field, a ~25 kHz 13C field (with a tangent ramp), and a 3.5 ms contact time. The details of the R1817 and R1423 sequences used to recouple the 15N-1H dipolar coupling and 13C’ CSA interactions are provided in Fig. 2, and the dwell times and total durations of these frequency dimensions, which were varied for the different experiments, are provided in the corresponding figure captions.
Figure 2.
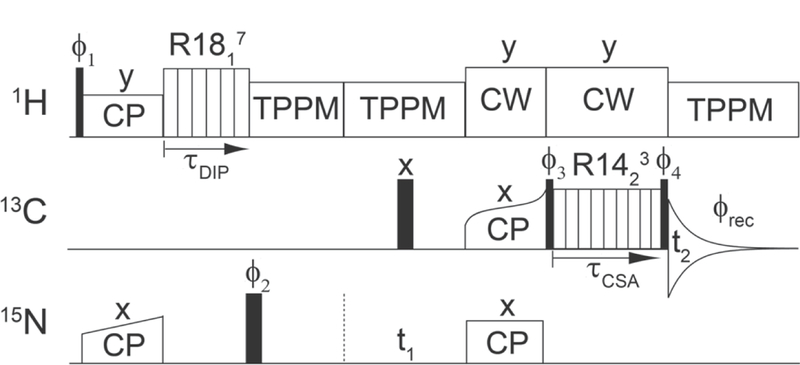
General pulse scheme used to record the 1H-15N dipolar/13C’ CSA tensor correlation spectra. Narrow and wide black rectangles correspond to 90° and 180° pulses, respectively, and cross-polarization (with appropriate shapes) and CW and TPPM 1H decoupling periods are indicated. The 1H-15N dipolar coupling and 13C’ CSA interactions are reintroduced by using the γ-encoded R1817 and R14 3 sequences, incremented during τand τ, respectively, while the 15N and 13C isotropic chemical shifts are encoded during t1 and t2, respectively. Additional description of the R-symmetry sequences is provided in the text. Briefly, for the 9.921 kHz MAS rate (τr = 100.8 μs) employed in this study, one complete cycle of the R1817 sequence consists of 18 π pulses with 5.6 μs length (~89.3 kHz field) applied on the 1H channel within one rotor period in phase-altered (−70°, +70°) manner, and one complete cycle of the R1423 sequence consists of 14 π pulses with 14.4 μs length (~34.7 kHz field) applied on the 13C channel within two rotor periods in phase-altered (−38.57°, +38.57°) manner. Note that for the model peptides the spectra were recorded without 15N chemical shift evolution (i.e., t1 = 0) in either pseudo-3D (independent 1H-15N dipolar coupling and 13C’ CSA dimensions) or pseudo-2D manner (concurrent 1H-15N dipolar coupling and 13C’ CSA evolution achieved by simultaneously incrementing τDIP and τCSA) as described in the text. For protein samples, the spectra were recorded in pseudo-3D manner with 15N chemical shift evolution during t1 and concurrent 1H- 15N dipolar coupling/13C’ CSA evolution. Phase cycling: ϕ1=8(x),8(-x); ϕ2=2(x,y); ϕ3=4(y),4(-y); ϕ4=2(- y),2(y); ϕrec=x,-x,-x,x,-x,x,x,-x,-x,x,x,-x,x,-x,-x,x. Where applicable, quadrature detection in the 15N dimension was achieved by changing the phase of the 15N spin-lock pulse during 15N-13C’ CP from x to y according to the States method [50].
Data were processed in NMRPipe [53]. For GG and DKP a squared cosine bell window was used for apodization for the isotropic chemical shift dimensions, while for the protein samples a 60° shifted sine bell window was used. The time-domain dephasing profiles under the recoupled 15N-1H dipolar coupling and 13C’ CSA interactions were extracted either from a series of 1D 13C spectra (GG and DKP) or from a series of 2D 15N- 13C’ chemical shift correlation spectra (proteins), using python scripts in nmrglue [54]. These time-domain data were imported into Origin 9.0, zero-filled to 2048 points and Fourier transformed without applying any line-broadening to generate the 1D frequency-domain lineshapes reporting on combined evolution under the recoupled 15N-1H dipolar and 13C’ CSA interactions. The 2D 15N-1H dipolar/13C’ CSA frequency-domain lineshapes for GG and DKP were obtained after zero-filling to 512 points in each dimension.
2.5. Simulations of NMR spectra
A molecular model corresponding to a peptide bond fragment consisting of three coupled spins (1H, 15N and 13Cʹ) as well as the Cα and O atoms was built with the following bond distances and angles, N-H 1.04 Å, N-Cʹ 1. Å, Cʹ-Cα 1.52 Å, H-N-Cʹ: 119.5°, N-Cʹ- O: 123.2°, and O-Cʹ-Cα 121.2°. For the trans conformation of the peptide bond, corresponding to GG, the H-N-Cʹ-O torsion angle was set to 180°, while for the cis conformation, corresponding to DKP, the H-N-Cʹ-O torsion angle was set to 0°. 13Cα was not considered as part of the coupled spin system in the simulations of 15N-1H dipole/13C’ CSA correlation spectra since the R1817 and R1423 sequences do not recouple homonuclear dipolar interactions.
Numerical simulations of the NMR spectra were performed using the SPINEVOLUTION software package [55], with 1H Larmor frequency of 499.8 MHz, MAS frequency of 9.921 kHz, and other acquisition and processing parameters corresponding to their experimental values. The ZCW987 α, β angle set and three γ angle values were used to generate the powder averaged spectra. All the dipolar coupling magnitudes were obtained directly from the corresponding bond lengths in the molecular model, while the 13Cʹ CSA tensor parameters (δ = 82.3 ppm and η = 0.84) and orientation in the molecular frame corresponded to the previously reported experimental values for GG [43]. Since the R1817 and R1423 sequences recouple both the heteronuclear dipolar couplings and CSA for the irradiated spin [56], and in our experiments efficient 15N decoupling was not feasible during the R1423 period due to probe limitations, the simulations also included the amide 1H CSA (ẟ= 8.9 ppm and η = 0.75) [42] during the R1817 15N-1H dipolar evolution period and the 13Cʹ- 15N dipolar coupling during the R1423 13Cʹ CSA evolution period. Finally, for best agreement between the experimental and simulated spectra, the simulations also included the effects of transverse relaxation during the 15N-1H dipolar and 13Cʹ CSA evolution periods.
3. Results and discussion
3.1. Pulse sequence description
The pulse scheme shown in Fig. 2 was used to record the 1H-15N dipolar/13C’ CSA tensor correlation spectra. Briefly, following 1H-15N CP, the resulting amide 15N magnetization was allowed to evolve during the period τDIP primarily under the 15N-1H dipolar interaction recoupled by using the R1817 sequence (see below). This was followed by a period of 15N isotropic chemical shift evolution during t1 (used here only for the protein samples to generate residue-specific correlations, but not necessary for GG and DKP), and subsequently SPECIFIC CP [52] was employed to transfer the 15N magnetization to the 13C’ of the preceding residue. The 13C’ magnetization was then allowed to evolve during the period τCSA primarily under the 13C’ CSA interaction recoupled by using the R1423 sequence, and finally detected during t2. Note that the τDIP and τCSA periods were incremented either independently or concurrently, as discussed in detail in the text.
The 15N-1H dipolar coupling and 13Cʹ CSA interactions were reintroduced under MAS by using well-known R-symmetry sequences—R1817 and R1423 applied during the periods τDIP and τCSA, respectively, as noted above—described in detail previously [42,56–60]. In general, a sequence consists of N basic elements R that each rotate the nuclear spins by 180o (single π pulse in our case), applied as phase-alternated pairs with an overall phase shift ϕ = πv/N within the interval , where is the rotor period, repeated multiple times as required [56]:
| (1) |
In the interaction frame of the applied RF irradiation, the first-order average Hamiltonian for the internal spin interactions during a sequence is given by [56]:
| (2) |
where Λ indicates the specific spin interaction (i.e., CSA, heteronuclear dipolar coupling, etc.), l is the space rank of interaction Λ with m=-l-l+1,…+l being the space rotational component, and λ is the spin rank of interaction Λ with μ = −λ, −λ +1, …, +λ being the spin rotational component. is the scaling factor due to RF irradiation, is the spatial component of the interaction that depends on the Euler angles .connecting the principal axis system to the rotor-fixed frame, is the Wigner matrix element dependent on the angle ßRL connecting the rotor- fixed frame to the lab frame, and is the spin component of the interaction.
For a sequence, symmetry imposes the following selection rule for the first-order average Hamiltonian terms, which enables selective recoupling of the different nuclear spin interactions based on their rotational properties [56]:
| (3) |
where Zλ is an integer with the same parity as λ. Consequently, both the R1817 and R1423 sequences utilized in this study provide γ-encoded recoupling of the CSA and heteronuclear dipolar coupling interactions for the irradiated spin (l=2 and λ =1for both interactions), with selection of the {l, m, λ μ} and{2,2,1,−1}terms, and concurrent suppression of homonuclear dipolar couplings and isotropic chemical shifts [42,56–60]. Note that during R1817 the amide 15N magnetization evolves primarily under its dipolar coupling to the directly bonded amide 1H, since the magnitude of this interaction significantly exceeds the amide 1H CSA as well as couplings between the amide 1H and other spins. Likewise, the 13Cʹ CSA is the dominant interaction during R1423 evolution, given that the recoupled 13Cʹ- 15N dipolar interaction is much smaller in magnitude and that couplings to 1H nuclei are suppressed by using high-power proton decoupling.
3.2. Recoupling of heteronuclear dipolar and CSA interactions by R-symmetry sequences
Prior to recording the tensor correlation spectra, control experiments were carried out for the model peptides GG and DKP using the pulse scheme in Fig. 2, with either the R1817 or the R1423 period incremented, in order to quantitatively assess the performance of 1H-15N dipolar and 13Cʹ CSA recoupling under our experimental conditions. Fig. 3A shows the 1H- 15N dipolar trajectory in the time domain for GG, obtained by incrementing the R1817 period up to ~2 ms, with the corresponding frequency-domain dipolar lineshape shown in Fig. 3C. The trajectory shows pronounced oscillations indicative of efficient γ-encoded dipolar recoupling, and the best-fit simulations are consistent with a 1H-15N dipolar coupling constant of ~10.8 kHz and R1817 scaling factor of ~0.18 [58] as expected (corresponding data for DKP are shown in SI Fig. S1A and S1C). Fig. 3B shows the time-domain 13Cʹ CSA trajectory for GG obtained by incrementing the R1423 period up to ~3.5 ms, with the corresponding CSA lineshape in the frequency domain shown in Fig. 3D and data for DKP shown in SI Fig. S1B and S1D. Since in peptides and proteins some site-to-site variation in the 13Cʹ CSA magnitude and orientation in the molecular frame is expected [61–63], for simplicity, rather than attempting to fit these parameters individually for each site, all calculations performed in this study were carried out with the 13Cʹ CSA parameters fixed to the values previously reported for GG (δ = 82.3 ppm and η = 0.84) [43]. Consequently, the best-fit simulations for GG are of particularly high quality and consistent with the known 13Cʹ CSA tensor parameters and R1423 scaling factor of ~0.3 [58,60]. On the other hand, while the fit quality for DKP is not as high as for GG, the use of the fixed GG 13Cʹ CSA parameters in the simulations is nevertheless sufficient to readily distinguish between cis and trans peptide bond conformations in the context of the tensor correlation experiments discussed below.
Figure 3.
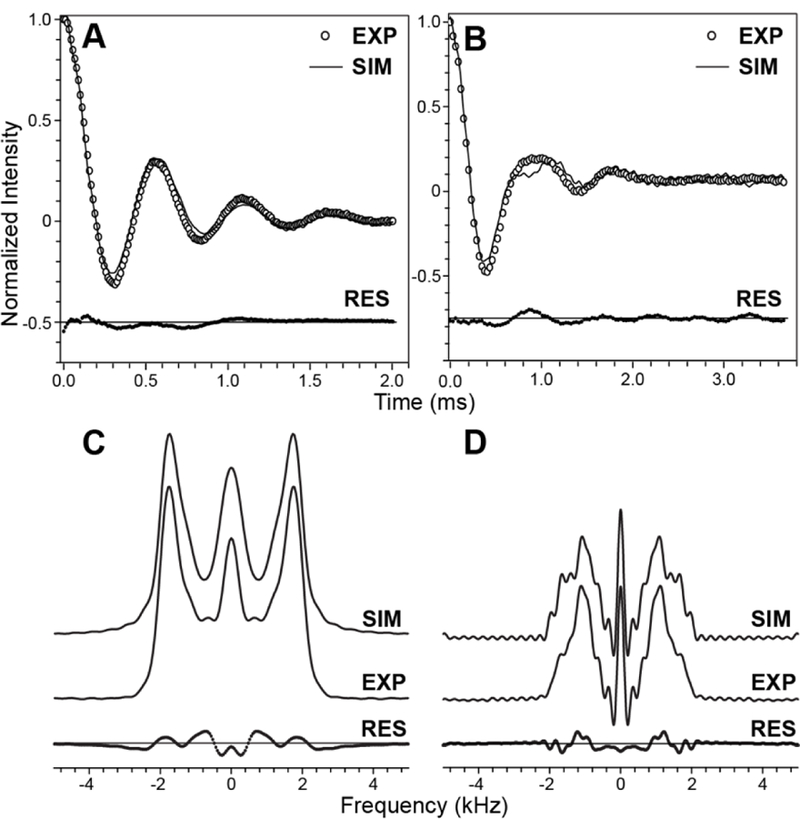
(A) Time-domain 1H-15N dipolar trajectory for GG obtained by using the pulse scheme in Fig. 2 with t1 and τCSA set to zero and the duration of the R1817 (τDIP) period incremented in units of 11.2 μs corresponding to two π pulses with −70°, +70° phase alternation. (B) Time-domain 13Cʹ CSA trajectory for GG obtained by using the pulse scheme in Fig. 2 with t1 and τDIP set to zero and the duration of the R14 3 (τCSA) period incremented in units of 28.8 μs corresponding to two π pulses with −38.57°, +38.57° phase alternation. In panels (A) and (B) the experimental trajectories are shown as open circles and best-fit simulations as solid lines, with the residuals shown beneath the trajectories. (C,D) Experimental and simulated 1H-15N dipolar (C) and 13Cʹ CSA (D) lineshapes in the frequency domain corresponding to the time-domain trajectories in panels (A) and (B), respectively.
3.3. Tensor correlation experiments for model peptides
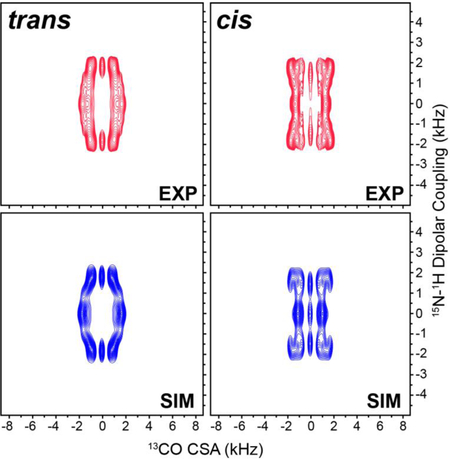
For GG and DKP, as well as other peptides with well-resolved 13Cʹ resonances in a 1D spectrum, the 1H-15N dipolar/13C’ CSA tensor correlation spectra can be recorded within reasonable measurement times in a pseudo-3D manner with complete 1H-15N dipolar and 13C’ CSA frequency dimensions by using the pulse scheme in Fig. 2 with no 15N chemical shift evolution (i.e., t1 = 0) while independently incrementing the R1817 and R1423 blocks during τDIP and τCSA, respectively. In Fig. 4A and 4B we show the experimental 1H-15N dipolar/13C’ CSA tensor correlation spectra for GG and DKP, respectively. The spectra are clearly distinct from one another owing to the different relative orientations of the 1H-15N dipolar and 13Cʹ CSA tensors for the trans vs. cis peptide bond conformation. Remarkably, the corresponding simulated spectra shown in Fig. 4C and 4D, calculated for the trans and cis peptide bond conformations using the GG 13Cʹ CSA tensor parameters, and 15N-1H dipolar coupling magnitudes and relaxation rate constants for GG and DKP determined using the control experiments as discussed above, are in good agreement with the experimental data confirming the ability of the 1H-15N dipolar/13C’ CSA tensor correlation method to unambiguously differentiate between trans and cis peptide bonds.
Figure 4.
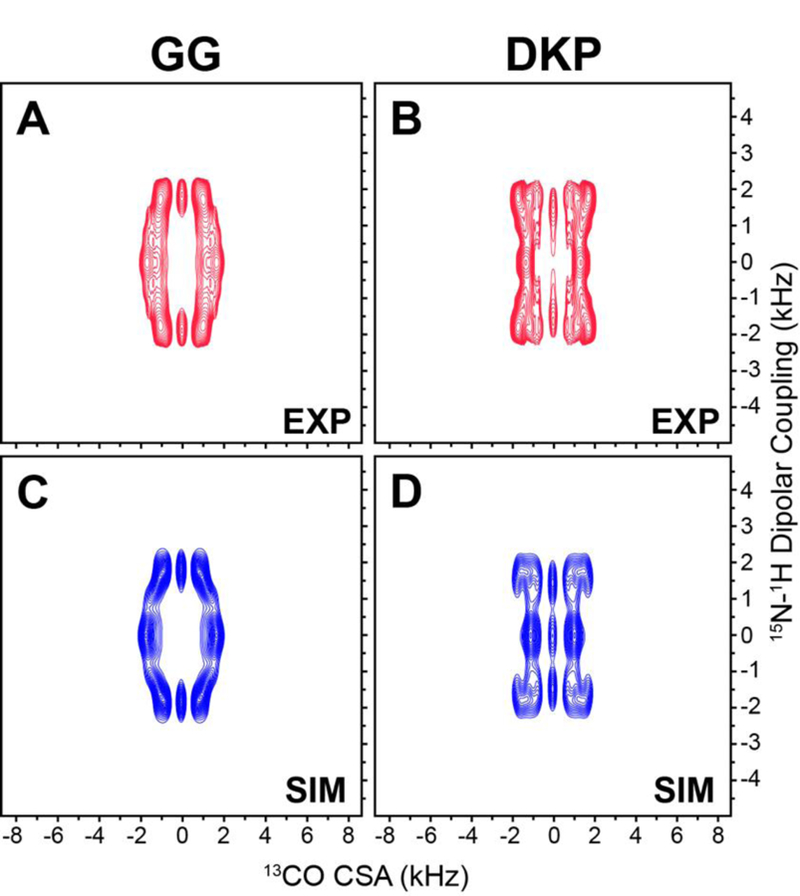
Experimental (A,B) and simulated (C,D) 1H-15N dipolar coupling/13Cʹ CSA correlation spectra for GG (A,C) and DKP (B,D). The experimental spectra were recorded in pseudo-3D fashion as described in the text, as 16 (τDIP, 1H-15N dipolar coupling) x 2 (τCSA, 13Cʹ CSA) data matrices with 100.8 μs and 57.6 μs dwell times in τDIP and τCSA, respectively, and 16 scans per FID. Spectra are drawn with lowest contours at ~20 times the root-mean-square (rms) noise level.
While the above approach could in principle be directly extended to larger peptides and proteins with overlapping 13Cʹ resonances by incorporating an additional 15N chemical shift dimension (by independently incrementing t1, in addition to τDIP and τCSA) the resulting pseudo-4D experiment would be extremely time-consuming if recorded in a conventional manner. Two possible approaches that may be considered to overcome this challenge and record residue-specific 1H-15N dipolar/13C’ CSA tensor correlations within manageable measurement times include the use of: (1) non-uniform sampling for the 15N chemical shift dimension [64,65] and (2) accordion spectroscopy [66,67] to simultaneously encode the 1H- 15N dipolar/13C’ CSA evolution in a time-shared manner. The latter approach was explored here by concurrently incrementing the τDIP and τCSA periods to yield correlated recoupled 1H- 15N dipolar/13C’ CSA lineshapes within a single frequency dimension.
To realize significant interplay between concurrently evolving tensorial interactions that is highly sensitive to their relative orientations, the product of the scaled interaction magnitude and evolution time must be comparable for the two interactions [22,26]. For the 1H-15N dipolar coupling and 13C’ CSA interactions being recoupled using the R1817 and R1423 sequences, respectively, this can be achieved by: (i) concurrently incrementing the R1817 and R1423 periods in units of two π pulses each resulting in the CSA ratio of 7:18 (we refer to this as a 1:1 accordion experiment, since both the R1817 and R1423 periods are incremented by the smallest possible unit of two π pulses) or (ii) incrementing the R1817 period by four π pulses while concurrently incrementing the R1423 period by two π pulses resulting in the CSA ratio of 7:9 (we refer to this as a 2:1 accordion experiment, since twice as many π pulses are applied during the R1817 period versus the R1423 period).
Fig. 5 shows the correlated 1H-15N dipolar/13Cʹ CSA frequency-domain lineshapes for GG and DKP obtained in pseudo-2D fashion by using the 1:1 and 2:1 accordion experiments described above. The distinctive experimental and corresponding simulated lineshapes— particularly for the 1:1 accordion experiments which yield a ~4 kHz splitting between the most intense features for GG and a ~2 kHz splitting for DKP—indicate that using this approach it is possible to readily distinguish between the trans and cis peptide bond conformations while employing measurement times that are 10-fold shorter than those needed for the corresponding pseudo-3D experiments with independent 1H-15N dipolar coupling and 13Cʹ CSA dimensions (c.f., Fig. 4).
Figure 5.
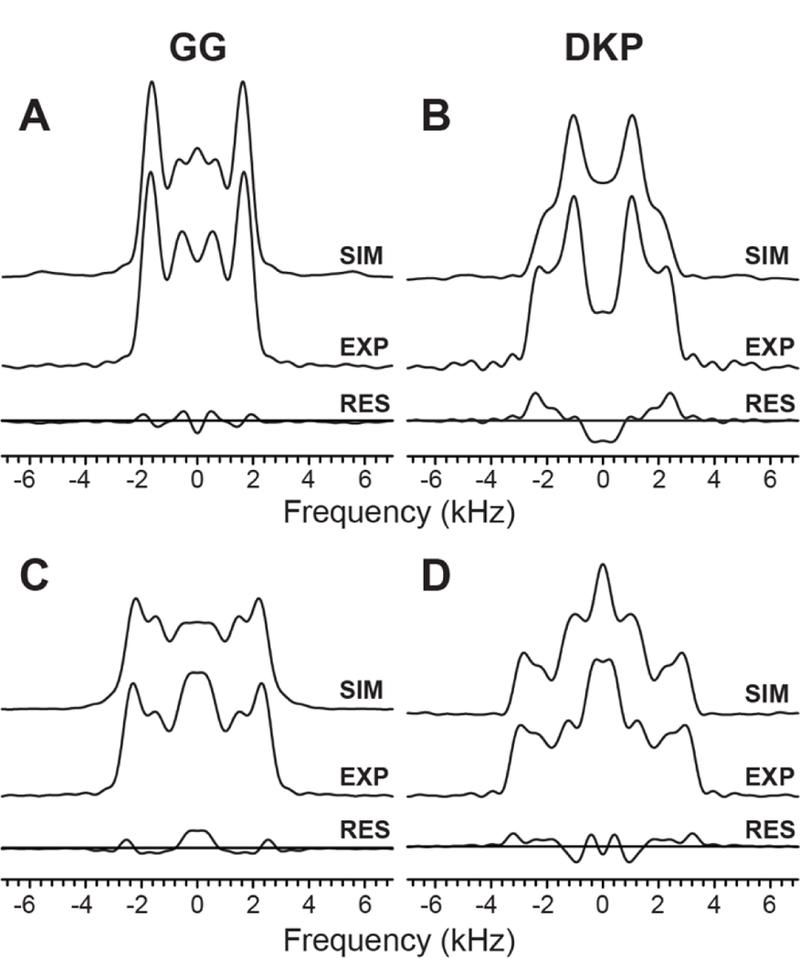
Experimental and best-fit simulated correlated 1H-15N dipolar/13Cʹ CSA lineshapes for GG (A,C) and DKP (B,D) obtained in pseudo-2D fashion by using the 1:1 (A,B) and 2:1 (C,D) accordion experiments described in the text. For the 1:1 accordion experiments, 51 spectra were recorded in the τDIP/τCSA dimension with increments of 11.2 μs for τDIP and 28.8 μs for τCSA and 16 scans per spectrum. Parameters were identical for the 2:1 accordion experiments, except that incrments of 22.4 μs for τDIP and 28.8 μs for τCSA were used in the τDIP/τCSA dimension. For each experiment the residuals are shown beneath the experimental and simulated lineshapes.
3.4. Tensor correlation experiments for proteins
Having established the ability of the 1H-15N dipolar/13Cʹ CSA tensor correlation experiments to unambiguously detect cis and trans peptide bond conformations in model peptides, we next used microcrystals of a globular 56-residue protein GB3 and Y145Stop prion protein amyloid fibrils as representative models to evaluate the applicability of these experiments to larger protein systems. Note that since no cis peptide bonds are expected to be present for either protein, this part of the study was primarily focused on issues related to spectral sensitivity and ability of the tensor correlation experiments to clearly identify trans peptide bonds in these proteins in a residue-specific manner. The 1H-15N dipolar/13Cʹ CSA tensor correlation experiments for both protein samples were carried out as pseudo-3D’s, consisting of two isotropic chemical shift dimensions (15N and 13Cʹ) for site resolution and an accordion dimension during which simultaneous evolution under the 1H-15N dipolar coupling and 13Cʹ CSA interactions was encoded as described above for GG and DKP (c.f., Fig. 5). Note that in comparison to the model peptides the use of the reduced-dimensionality accordion approach was particularly critical for the protein samples, where the collection of pseudo-3D spectra required measurement times ranging from ca. 2 to 6 days (i.e., if they were to be pursued the corresponding pseudo-4 ‘s, consisting of two regularly sampled chemical shift dimensions and independent 1H-15N dipolar coupling and 13Cʹ CSA dimensions, would have required prohibitively long measurement times on the order of weeks to months).
Fig. 6 shows the experimental 1H-15N dipolar/13Cʹ CSA tensor correlation lineshapes obtained using the 1:1 accordion experiment for representative residues in GB3, with the complete set of lineshapes for all residues with resolved cross-peaks in the 15N-13Cʹ spectrum provided in SI Fig. S2. First, we note that the spectral sensitivity is sufficient to yield high quality 1H-15N dipolar/13Cʹ CSA lineshapes. Furthermore, as expected, we find that all of the lineshapes display splittings of ~4 kHz between the most intense outer features and, on the whole, strongly resemble the corresponding trans peptide bond lineshape obtained for GG (c.f., Fig. 5A), in spite of relatively minor site-to-site variations in the central part of the lineshape that likely result from differences in 13Cʹ CSA parameters and relaxation properties [61–63]. In Fig. 7 we show the results of the same 1H-15N dipolar/13Cʹ CSA tensor correlation experiment performed for huPrP23–144 amyloid fibrils, which have previously been extensively investigated by our group using solid-state NMR methods [49,68–75] and are representative of more challenging protein assemblies in comparison to GB3 and other small microcrystalline proteins. As was the case for GB3, we find that for all residues with resolved 15N-13Cʹ correlations, the 1H-15N dipolar/13Cʹ CSA lineshapes exhibit prominent splittings of ~4 kHz between the most intense outer features that are characteristic of trans peptide bond conformation.
Figure 6.
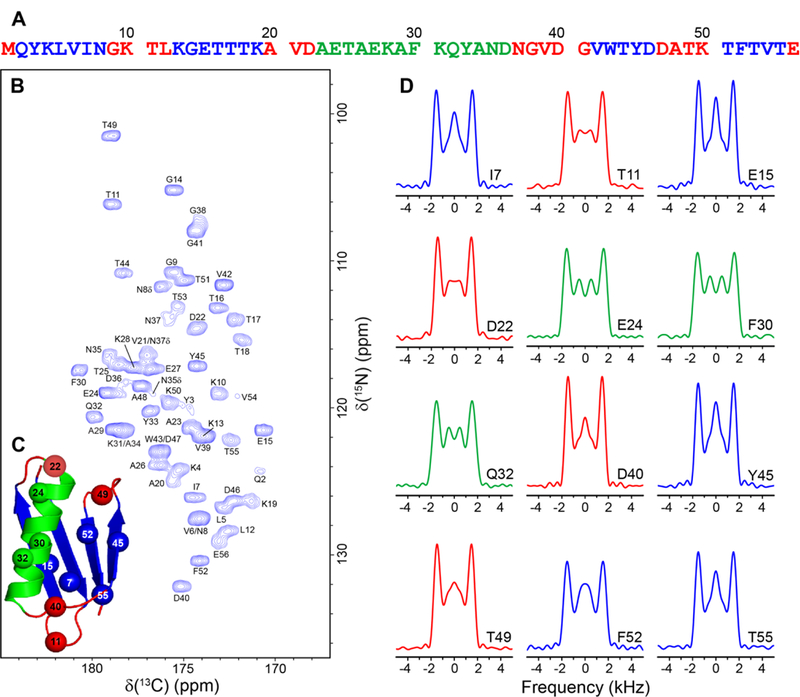
1H-15N dipolar coupling/13Cʹ CSA tensor correlation experiments on GB3. (A) Amino acid sequence of GB3 with α-helix, β-sheet and loop residues shown in green, blue and red, respectively. (B) Two-dimensional 500 MHz 15N-13Cʹ correlation spectrum of GB3 recorded at 9.921 kHz MAS rate as a 80* (t1, 15N) x 1500* (t2, 13C) data matrix with acquisition times of 28.44 ms and 30 ms in t1 and t2, respectively, and 8 scans per FID. Cross-peaks are drawn with the lowest contour at ~12 times the rms noise level, and labeled with residue number according to the 15N frequency [48]. (C) Structure of GB3 (PDB ID: 1P7E) [76] with locations of representative residues for which correlated 1H-15N dipole/13Cʹ lineshapes are shown indicated by spheres. (D) Experimental correlated 1H-15N dipolar/13Cʹ CSA lineshapes for representative residues in GB3 obtained in pseudo-3D fashion by using the 1:1 accordion experiment described in the text, where a set of 51 2D 15N-13Cʹ correlation spectra with parameters listed in panel (B) was recorded with the τDIP/τCSA dimension incremented by 11.2 μs for τDIP and 28.8 μs for τCSA. The lineshapes for the different residues are colored according to the secondary structure as indicated in panel (A) (see SI Fig. S2 for the complete set of experimental lineshapes).
Figure 7.
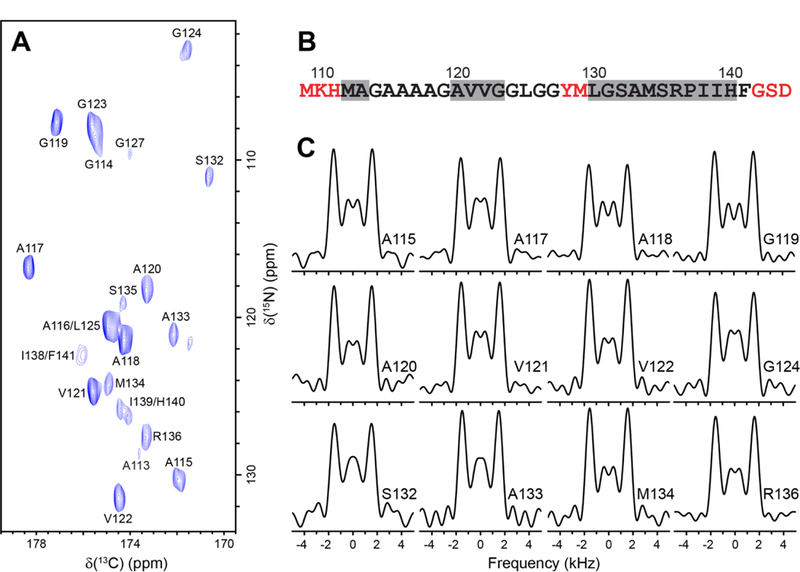
1H-15N dipolar coupling/13Cʹ CSA tensor correlation experiments on huPrP23–144 amyloid fibrils. (A) Two-dimensional 500 MHz 15N-13Cʹ correlation spectrum of huPrP23–144 fibrils prepared using the 1,3-13C-glycerol labeling scheme recorded at 9.921 kHz MAS rate as a 128* (t1, 15N) x 1500* (t2, 13C) data matrix with acquisition times of 11.43 ms and 30 ms in t1 and t2, respectively, and 16 scans per FID. Cross-peaks are drawn with the lowest contour at ~6 times the rms noise level, and labeled with residue number according to the 15N frequency [68]. (B) Amino acid sequence for the huPrP23–144 amyloid core (amino acids 112–141) and several flanking residues. The most rigid residues are shown in black, flexible residues not detectable in CP-based spectra are shown in red, and predicted β-strands [72] based on TALOS-N analysis [77] are indicated by grey rectangles. (C) Experimental correlated 1H-15N dipolar/13Cʹ CSA lineshapes for representative residues in huPrP23– 144 fibrils obtained in pseudo-3D fashion by using the 1:1 accordion experiment described in the text, where a set of 51 2D 15N-13Cʹ correlation spectra with parameters listed in panel (A) was recorded with the τDIP/τCSA dimension incremented by 11.2 μs for τDIP and 28.8 μs for τCSA.
4. Concluding remarks
In summary, we have demonstrated that the relative orientation of the amide 1H-15N dipolar coupling and 13Cʹ CSA tensors is highly sensitive to peptide bond conformation, and that it can be probed in uniformly 13C,15N-labeled peptides and proteins by using multidimensional MAS solid-state NMR to readily distinguish between cis and trans peptide bonds in a residue-specific manner. The results obtained in this study for two model peptides, glycylglycine and 2,5-diketopiperazine, microcrystalline GB3 and huPrP23–144 amyloid fibrils indicate that these experiments should be broadly applicable to other peptides and microcrystalline and non-crystalline proteins. Of particular note in the context of these experiments, especially as they relate to larger proteins, is that accordion spectroscopy concepts can be employed to concurrently encode evolution under 1H-15N dipolar coupling and 13Cʹ CSA interactions within a single dimension. This reduces the experiment time by roughly an order of magnitude relative to that required with independent frequency dimensions, but without majorly sacrificing the information content. The 1H-15N dipolar/13Cʹ CSA tensor correlation experiments on proteins presented in this study were demonstrated at moderate MAS rates with 13C detection, and utilized samples containing on the order of 1 μmol of protein while requiring ~2–6 days of measurement time. Additionally, by employing extensions of these experiments based on approaches including faster MAS, paramagnetic- assisted condensed data collection and/or proton detection [78–86] it may be possible to further enhance the spectral sensitivity and resolution while concurrently reducing both the required sample amounts and measurement times. Given these considerations, applications to specific protein systems as well as larger scale survey type studies aimed at the characterization of the frequency of occurrence of cis peptide bonds in proteins can be envisioned.
Supplementary Material
Highlights.
In proteins Xaa-non-Pro cis peptide bonds are rare but often functionally important
Cis and trans peptide bonds are distinguished by tensor correlation solid-state NMR
The methodology is expected to be widely applicable to peptides and proteins
Acknowledgments
This work was supported by the National Science Foundation (grants MCB-1243461 and MCB-1715174 to C.P.J.), the National Institutes of Health (grants R01GM094357, R01GM118664 and R01GM123743 to C.P.J.) and the Camille & Henry Dreyfus Foundation (Camille Dreyfus Teacher-Scholar Award to C.P.J.). We thank Dr. Subhradeep Paul for helpful discussions and Dr. Philippe Nadaud for assistance with GB3 sample preparation.
Footnotes
Publisher's Disclaimer: This is a PDF file of an unedited manuscript that has been accepted for publication. As a service to our customers we are providing this early version of the manuscript. The manuscript will undergo copyediting, typesetting, and review of the resulting proof before it is published in its final citable form. Please note that during the production process errors may be discovered which could affect the content, and all legal disclaimers that apply to the journal pertain.
References
- [1].McDermott A, Annu. Rev. Biophys 38 (2009) 385–403. [DOI] [PubMed] [Google Scholar]
- [2].Tycko R, Annu. Rev. Phys. Chem 62 (2011) 279–299. [DOI] [PMC free article] [PubMed] [Google Scholar]
- [3].Loquet A, Habenstein B, Lange A, Acc. Chem. Res 46 (2013) 2070–2079. [DOI] [PubMed] [Google Scholar]
- [4].Comellas G, Rienstra CM, Annu. Rev. Biophys 42 (2013) 515–536. [DOI] [PubMed] [Google Scholar]
- [5].Wang S, Ladizhansky V, Prog. Nucl. Magn. Reson. Spectrosc 82 (2014) 1–26. [DOI] [PubMed] [Google Scholar]
- [6].Meier BH, Bockmann A, Curr. Opin. Struct. Biol 30 (2015) 43–9. [DOI] [PubMed] [Google Scholar]
- [7].Kaplan M, Pinto C, Houben K, Baldus M, Q. Rev. Biophys 49 (2016) e15. [DOI] [PubMed] [Google Scholar]
- [8].Quinn CM, Polenova T, Q. Rev. Biophys 50 (2017) e1. [DOI] [PMC free article] [PubMed] [Google Scholar]
- [9].Baldus M, Prog. Nucl. Magn. Reson. Spect 41 (2002) 1–47. [Google Scholar]
- [10].Pintacuda G, Kervern G, Top. Curr. Chem 335 (2012) 157–200. [DOI] [PubMed] [Google Scholar]
- [11].Bhaumik A, Luchinat C, Parigi G, Ravera E, Rinaldelli M, CrystEngComm 15 (2013) 8639–8656. [Google Scholar]
- [12].Jaroniec CP, J. Magn. Reson 253 (2015) 50–59. [DOI] [PMC free article] [PubMed] [Google Scholar]
- [13].Tycko R, Weliky DP, Berger AE, J. Chem. Phys 105 (1996) 7915–7930. [Google Scholar]
- [14].Feng X, Lee YK, Sandström D, Eden M, Maisel H, Sebald A, Levitt MH, Chem. Phys. Lett 257 (1996) 314–320. [Google Scholar]
- [15].Feng X, Eden M, Brinkmann A, Luthman H, Eriksson L, Gräslund A, Antzutkin ON, Levitt MH, J. Am. Chem. Soc 119 (1997) 12006–12007. [Google Scholar]
- [16].Hong M, Gross JD, Griffin RG, J. Phys. Chem. B 101 (1997) 5869–5874. [Google Scholar]
- [17].Costa PR, Gross JD, Hong M, Griffin RG, Chem. Phys. Lett 280 (1997) 95–103. [Google Scholar]
- [18].Hong M, Gross JD, Hu W, Griffin RG, J. Magn. Reson 135 (1998) 169–177. [DOI] [PubMed] [Google Scholar]
- [19].Ishii Y, Hirao K, Terao T, Terauchi T, Oba M, Nishiyama K, Kainosho M, Solid State Nucl. Magn. Reson 11 (1998) 169–175. [DOI] [PubMed] [Google Scholar]
- [20].Reif B, Hohwy M, Jaroniec CP, Rienstra CM, Griffin RG, J. Magn. Reson 145 (2000) 132–141. [DOI] [PubMed] [Google Scholar]
- [21].Blanco FJ, Tycko R, J. Magn. Reson 149 (2001) 131–138. [Google Scholar]
- [22].Rienstra CM, Hohwy M, Mueller LJ, Jaroniec CP, Reif B, Griffin RG, J. Am. Chem. Soc 124 (2002) 11908–11922. [DOI] [PubMed] [Google Scholar]
- [23].Ladizhansky V, Veshtort M, Griffin RG, J. Magn. Reson 154 (2002) 317–324. [DOI] [PubMed] [Google Scholar]
- [24].Ladizhansky V, Jaroniec CP, Diehl A, Oschkinat H, Griffin RG, J. Am. Chem. Soc 125 (2003) 6827–6833. [DOI] [PubMed] [Google Scholar]
- [25].Chan JCC, Tycko R, J. Am. Chem. Soc 125 (2003) 11828–11829. [DOI] [PubMed] [Google Scholar]
- [26].Jaroniec CP, MacPhee CE, Bajaj VS, McMahon MT, Dobson CM, Griffin RG, Proc. Natl. Acad. Sci. USA 101 (2004) 711–716. [DOI] [PMC free article] [PubMed] [Google Scholar]
- [27].Costa PR, Kocisko DA, Sun BQ, Lansbury PT, Griffin RG, J. Am. Chem. Soc 119 (1997) 10487–10493. [Google Scholar]
- [28].Hudson BC, Battigelli A, Connolly MD, Edison J, Spencer RK, Whitelam S, Zuckermann RN, Paravastu AK, J. Phys. Chem. Lett 9 (2018) 2574–2578. [DOI] [PubMed] [Google Scholar]
- [29].Ramachandran GN, Sasisekharan V, Adv. Prot. Chem 23 (1968) 283–438. [DOI] [PubMed] [Google Scholar]
- [30].Weiss MS, Jabs A, Hilgenfeld R, Nat. Struct. Biol 5 (1998) 676. [DOI] [PubMed] [Google Scholar]
- [31].Jabs A, Weiss MS, Hilgenfeld R, J. Mol. Biol 286 (1999) 291–304. [DOI] [PubMed] [Google Scholar]
- [32].Rees DC, Lewis M, Honzatko RB, Lipscomb WN, Hardman KD, Proc. Natl. Acad. Sci. USA 78 (1981) 3408–3412. [DOI] [PMC free article] [PubMed] [Google Scholar]
- [33].Volz KW, Matthews DA, Alden RA, Freer ST, Hansch C, Kaufman BT, Kraut J, J. Biol. Chem 257 (1982) 2528–2536. [PubMed] [Google Scholar]
- [34].Weiss MS, Metzner HJ, Hilgenfeld R, FEBS Lett 423 (1998) 291–296. [DOI] [PubMed] [Google Scholar]
- [35].Klabunde T, Sharma S, Telenti A, Jacobs WR, Sacchettini JC, Nat. Struct. Biol 5 (1998) 31–36. [DOI] [PubMed] [Google Scholar]
- [36].Stoddard BL, Pietrokovski S, Nat. Struct. Biol 5 (1998) 3–5. [DOI] [PubMed] [Google Scholar]
- [37].Sarkar SK, Torchia DA, Kopple KD, VanderHart DL, J. Am. Chem. Soc 106 (1984) 3328–3331. [Google Scholar]
- [38].Schubert M, Labudde D, Oschkinat H, Schmieder P, J. Biomol. NMR 24 (2002) 149–154. [DOI] [PubMed] [Google Scholar]
- [39].Neal S, Berjanskii M, Zhang H, Wishart DS, Magn. Reson. Chem 44 (2006) S158– S167. [DOI] [PubMed] [Google Scholar]
- [40].Shen Y, Bax A, J. Biomol. NMR 46 (2010) 199–204. [DOI] [PMC free article] [PubMed] [Google Scholar]
- [41].Wüthrich K, NMR of Proteins and Nucleic Acids, Wiley, New York, NY, 1986. [Google Scholar]
- [42].Hou G, Paramasivam S, Byeon IJL, Gronenborn AM, Polenova T, Phys. Chem. Chem. Phys 12 (2010) 14873–14883. [DOI] [PMC free article] [PubMed] [Google Scholar]
- [43].Stark RE, Jelinski LW, Ruben DJ, Torchia DA, Griffin RG, J. Magn. Reson 55 (1983) 266–273. [Google Scholar]
- [44].Hartzell CJ, Whitfield M, Oas TG, Drobny GP, J. Am. Chem. Soc 109 (1987) 5966–5969. [Google Scholar]
- [45].Oas TG, Hartzell CJ, McMahon TJ, Drobny GP, Dahlquist FW, J. Am. Chem. Soc 109 (1987) 5956–5962. [Google Scholar]
- [46].Koetzle TF, Hamilton WC, Parthasarathy R, Acta Crystallogr. B 28 (1972) 2083– 2090. [Google Scholar]
- [47].Nonappa K Ahonen, Lahtinen M, Kolehmainen E, Green Chem 13 (2011) 1203– 1209. [Google Scholar]
- [48].Nadaud PS, Helmus JJ, Jaroniec CP, Biomol. NMR Assign 1 (2007) 117–120. [DOI] [PubMed] [Google Scholar]
- [49].Theint T, Nadaud PS, Aucoin D, Helmus JJ, Pondaven SP, Surewicz K, Surewicz WK, Jaroniec CP, Nat. Commun 8 (2017) 753. [DOI] [PMC free article] [PubMed] [Google Scholar]
- [50].States DJ, Haberkorn RA, Ruben DJ, J. Magn. Reson 48 (1982) 286–292. [Google Scholar]
- [51].Bennett AE, Rienstra CM, Auger M, Lakshmi KV, Griffin RG, J. Chem. Phys 103 (1995) 6951–6957. [Google Scholar]
- [52].Baldus M, Petkova AT, Herzfeld J, Griffin RG, Mol. Phys 95 (1998) 1197–1207. [Google Scholar]
- [53].Delaglio F, Grzesiek S, Vuister GW, Zhu G, Pfeifer J, Bax A, J. Biomol. NMR 6 (1995) 277–293. [DOI] [PubMed] [Google Scholar]
- [54].Helmus JJ, Jaroniec CP, J. Biomol. NMR 55 (2013) 355–367. [DOI] [PMC free article] [PubMed] [Google Scholar]
- [55].Veshtort M, Griffin RG, J. Magn. Reson 178 (2006) 248–282. [DOI] [PubMed] [Google Scholar]
- [56].Levitt MH, Symmetry-Based Pulse Sequences in Magic-Angle Spinning Solid-State NMR, in: Grant DM, Harris RK (Eds.), Encyclopedia of Nuclear Magnetic Resonance, Volume 9: Advances in NMR, Wiley, Chichester, 2002, pp. 165–196. [Google Scholar]
- [57].Brinkmann A, Levitt MH, J. Chem. Phys 115 (2001) 357–384. [Google Scholar]
- [58].Zhao X, Eden M, Levitt MH, Chem. Phys. Lett 342 (2001) 353–361. [Google Scholar]
- [59].Levitt MH, J. Chem. Phys 128 (2008) 052205. [DOI] [PubMed] [Google Scholar]
- [60].Hou G, Byeon I-JL, Ahn J, Gronenborn AM, Polenova T, J. Chem. Phys 137 (2012) 134201. [DOI] [PMC free article] [PubMed] [Google Scholar]
- [61].Markwick PR, Sattler M, J. Am. Chem. Soc 126 (2004) 11424–11425. [DOI] [PubMed] [Google Scholar]
- [62].Wylie BJ, Sperling LJ, Frericks HL, Shah GJ, Franks WT, Rienstra CM, J. Am. Chem. Soc 129 (2007) 5318–5319. [DOI] [PubMed] [Google Scholar]
- [63].Wei Y, Lee D-K, Ramamoorthy A, J. Am. Chem. Soc 123 (2001) 6118–6126. [DOI] [PubMed] [Google Scholar]
- [64].Hoch JC, Maciejewski MW, Mobli M, Schuyler AD, Stern AS, Nonuniform Sampling in Multidimensional NMR, Wiley, Chichester, 2012. [Google Scholar]
- [65].Paramasivam S, Suiter CL, Hou G, Sun S, Palmer M, Hoch JC, Rovnyak D, Polenova T, J. Phys. Chem. B 116 (2012) 7416–7427. [DOI] [PMC free article] [PubMed] [Google Scholar]
- [66].Bodenhausen G, Ernst RR, J. Magn. Reson 45 (1981) 367–373. [DOI] [PubMed] [Google Scholar]
- [67].Bodenhausen G, Ernst RR, J. Am. Chem. Soc 104 (1982) 1304–1309. [Google Scholar]
- [68].Helmus JJ, Surewicz K, Nadaud PS, Surewicz WK, Jaroniec CP, Proc. Natl. Acad. Sci. USA 105 (2008) 6284–6289. [DOI] [PMC free article] [PubMed] [Google Scholar]
- [69].Helmus JJ, Surewicz K, Surewicz WK, Jaroniec CP, J. Am. Chem. Soc 132 (2010) 2393–2403. [DOI] [PMC free article] [PubMed] [Google Scholar]
- [70].Helmus JJ, Surewicz K, Apostol MI, Surewicz WK, Jaroniec CP, J. Am. Chem. Soc 133 (2011) 13934–13937. [DOI] [PMC free article] [PubMed] [Google Scholar]
- [71].Jones EM, Wu B, Surewicz K, Nadaud PS, Helmus JJ, Chen S, Jaroniec CP, Surewicz WK, J. Biol. Chem 286 (2011) 42777–42784. [DOI] [PMC free article] [PubMed] [Google Scholar]
- [72].Theint T, Nadaud PS, Surewicz K, Surewicz WK, Jaroniec CP, Biomol. NMR Assign 11 (2017) 75–80. [DOI] [PMC free article] [PubMed] [Google Scholar]
- [73].Aucoin D, Xia Y, Theint T, Nadaud PS, Surewicz K, Surewicz WK, Jaroniec CP, J. Struct. Biol (2018) published online, doi: 10.1016/j.jsb.2018.04.002. [DOI] [PMC free article] [PubMed] [Google Scholar]
- [74].Shannon MD, Theint T, Mukhopadhyay D, Surewicz K, Surewicz WK, Marion D, Schanda P, Jaroniec CP, ChemPhysChem (2018) published online, doi: 10.1002/cphc.201800779. [DOI] [PMC free article] [PubMed] [Google Scholar]
- [75].Theint T, Xia Y, Nadaud PS, Mukhopadhyay D, Schwieters CD, Surewicz K, Surewicz WK, Jaroniec CP, J. Am. Chem. Soc 140 (2018) 13161–13166. [DOI] [PMC free article] [PubMed] [Google Scholar]
- [76].Ulmer TS, Ramirez BE, Delaglio F, Bax A, Journal of the American Chemical Society 125 (2003) 9179–9191. [DOI] [PubMed] [Google Scholar]
- [77].Shen Y, Bax A, J. Biomol. NMR 56 (2013) 227–241. [DOI] [PMC free article] [PubMed] [Google Scholar]
- [78].Wickramasinghe NP, Parthasarathy S, Jones CR, Bhardwaj C, Long F, Kotecha M, Mehboob S, Fung LWM, Past J, Samoson A, Ishii Y, Nat. Methods 6 (2009) 215–218. [DOI] [PMC free article] [PubMed] [Google Scholar]
- [79].Linser R, Chevelkov V, Diehl A, Reif B, J. Magn. Reson 189 (2007) 209–216. [DOI] [PubMed] [Google Scholar]
- [80].Laage S, Sachleben JR, Steuernagel S, Pierattelli R, Pintacuda G, Emsley L, J. Magn. Reson 196 (2009) 133–141. [DOI] [PubMed] [Google Scholar]
- [81].Bertini I, Emsley L, Lelli M, Luchinat C, Mao J, Pintacuda G, J. Am. Chem. Soc 132 (2010) 5558–5559. [DOI] [PubMed] [Google Scholar]
- [82].Nadaud PS, Helmus JJ, Sengupta I, Jaroniec CP, J. Am. Chem. Soc 132 (2010) 9561–9563. [DOI] [PubMed] [Google Scholar]
- [83].Yamamoto K, Xu J, Kawulka KE, Vederas JC, Ramamoorthy A, J. Am. Chem. Soc 132 (2010) 6929–6931. [DOI] [PMC free article] [PubMed] [Google Scholar]
- [84].Tang M, Berthold DA, Rienstra CM, J. Phys. Chem. Lett 2 (2011) 1836–1841. [DOI] [PMC free article] [PubMed] [Google Scholar]
- [85].Mukhopadhyay D, Nadaud PS, Shannon MD, Jaroniec CP, J. Phys. Chem. Lett 8 (2017) 5871–5877. [DOI] [PMC free article] [PubMed] [Google Scholar]
- [86].Andreas LB, Le Marchand T, Jaudzems K, Pintacuda G, J. Magn. Reson 253 (2015) 36–49. [DOI] [PubMed] [Google Scholar]
Associated Data
This section collects any data citations, data availability statements, or supplementary materials included in this article.