

Abstract
Background.
Intracortical myelin is a key determinant of neuronal synchrony and plasticity that underpin optimal brain function. Magnetic resonance imanging (MRI) facilitiates the examination of intracortical myelin but presents with methodological challenges. Here we describe a whole-brain approach for the in vivo investigation of intracortical myelin in the human brain using ultra-high field MRI.
Methods.
Twenty-five healthy adults were imaged in a 7 Tesla MRI scanner using diffusion-weighted imaging and a T1-weighted sequence optimized for intracortical myelin contrast. Using an automated pipeline, T1 values were extracted at 20 depth-levels from each of 148 cortical regions. In each cortical region, T1 values were used to infer myelin concentration and to construct a non-linearity index as a measure the spatial distribution of myelin across the cortical ribbon. The relationship of the myelin concertation and non-linearity index with other neuroanatomical properties were investigated. Five patients with multiple sclerosis were also assessed using the same protocol as positive controls.
Results.
Intracortical T1 values decreased between the outer brain surface and the gray-white matter boundary following a slope that showed a slight leveling between 50% and 75% of cortical depth. Higher order regions in the prefrontal, cingulate cortex and insular cortices, displayed higher non-linearity indices than sensorimotor regions. Across all regions, there was a positive association between T1 values and non-linearity indices (p < 10−5). Both T1 values (P < 10−5) and non-linearity indices (P < 10−15) were associated with cortical thickness. Higher myelin concentration but only in the deepest cortical levels was associated with increased subcortical fractional anisotropy (P=0.05).
Conclusions.
We demonstrate the use of an automatic, whole-brain method to perform depth-dependent examination of intracortical myelin organization. The extracted metrics, T1 values and the non-linearity index, have characteristic patterns across cortical regions, and are associated with thickness and underlying white matter microstructure.
Keywords: ultra-high field, neuroimaging, cortical depth-levels, myeloarchitecture
1. INTRODUCTION
Nearly half the human brain comprises myelinated axons that connect brain regions with each other. Myelin is formed by oligodendrocytes that sheath and insulate neuronal axons (Nave & Werner, 2014). Myelination supports the speed of axonal conduction which determines the time of arrival of signals from multiple axons and hence neuronal spiking (Nave & Werner 2014). Myelin also provides trophic axonal support which is particularly relevant for longer axons that extend far beyond the neuronal soma (Bercury & Macklin, 2015). Myelination is therefore essential for the efficient inter-neuronal communication that underlies mental processing and experience-induced plasticity (Fields et al., 2014; Fields, 2015; Hunt et al., 2016; Glasser et al., 2014).
Although myelination is a prominent feature of deep white matter, oligodendrocytes are also abundant within the cortical ribbon. Within the cortex, myelin density is higher in deeper compared to superficial layers and in sensorimotor compared to association regions (Nave and Werner, 2014). Intracortical myelin has a prolonged period of maturation extending into late adolescence and adulthood (Carey et al., 2017; Shafee et al., 2015; Whitaker et al., 2016) which is associated with age-related changes in grey matter volume (Mills et al., 2016) and in functional connectivity (Huntenburg et al., 2017). Intracortical myelin is sensitive to experience-dependent neuronal activity throughout the lifespan thus actively contributing to brain plasticity and remodeling (Fields, 2015; Purger et al., 2016). These features suggest that myeloarchitecture is relevant to the fine-tuning of cortical circuits, a notion that is supported by the association between intracortical myelin and individual variability in cognitive function (Grydeland et al., 2013).
The majority of studies on cortical myelination to date have been performed at the standard field strength of 3 Tesla with typical spatial resolutions of 1mm. Since the thickness of the human cortex ranges from approximately 2mm to 4mm, these standard MR techniques are suboptimal for the characterization of intracortical myelin concentration. Ultra-high field imaging at 7 Tesla now allows for the sub-millimeter resolution in MR sequences (Fracasso et al., 2016; Waehnert et al., 2015; Marques et al., 2010; 2017; Sanchez-Panchuelo et al., 2010; Tardif et al., 2015). Initial studies suggest that depth-dependent intracortical myelin properties in the sensorimotor (Dinse et al., 2015) and the visual (Fracasso, 2016) cortices obtained using ultra-high field MRI are consistent with post mortem histological data. MRI-based laminar T1 maps align with cortical folding patterns (Tardif et al., 2015) and with regional functional specialization (Sanchez-Panchuelo et al., 2010; Kuehn et al., 2017), further supporting a close relationship between plasticity and laminar myelin.
The ability to approximate the distribution of myelin across lamina by sub-sampling the cortex at different depth-levels is an important new development for two reasons. Firstly, myelin is highly unequally distributed across cortical lamina. Hence, measuring myelin at low spatial resolutions yields metrics that are influenced by partial volume effects across lamina, and are therefore less sensitive to inter-regional or inter-individual variation than depth-specific estimates. Secondly, cortical myelination across development (Konner, 1991) and the myelination response to inflammation (Gardner et al., 2013) are lamina-specific processes. Thus, myelin concentration in different cortical layers can play distinct roles in neuronal circuit functioning, neurodevelopment and pathology. In psychiatric disorders such as schizophrenia, the importance of layer-specific cortical investigations has also been emphasized in the context of histological studies (Höistad et al., 2013; Rajkoswka et al., 2002).
In order to study lamina-specific myelin pathology in histology, each layer tends to be investigated separately for clinical associations with cell density or myelin stains. However, explorative whole-brain MRI studies would benefit from a single marker for cross-laminar distribution of myelin, as increased multiple testing results in low statistical power. In the present study, we present an optimized whole-brain MR sequence and automated pipeline for the investigation of the myeloarchitecture of the brain in healthy individuals using ultra-high field imaging. In addition to analyzing T1 values at each cortical depth level, we explored myelin profile nonlinearity as a single index of myelin organization. To aid interpretation of this new metric, we provide information on how this nonlinearity index relates to standard MRI measures of cortical thickness and sub-cortical white matter fractional anisotropy (FA) measured using diffusion weighted imaging.
2. METHODS
2.1. Sample
The sample consisted of 25 healthy volunteers (14 male and 11 female) with a mean age of 29 years (sd=5.88) recruited through adverts in the local community. They were interviewed to exclude any past or current medical disorder or head trauma and any psychiatric disorder based on the Mini-International Neuropsychiatric Interview (M.I.N.I.) (Sheehan et al., 1998). We also recruited 5 patients from the local specialist clinic diagnosed with multiple sclerosis (MS) (2 male and 3 female; age range: 32–55 years), as “positive controls” since MS represents the prototypical demyelinating condition (details in Supplement). The study was approved by the institutional review board of the Icahn School of Medicine at Mount Sinai (ISMMS). All study participants provided written informed consent.
2.2. MRI Acquisition
All participants were scanned at ISMMS using a 7T MR scanner (Magnetom, Siemens Healthcare) with a 32-channel with a Nova head coil (Nova Medical, Wilmington MA). Whole brain T1-weighted images were acquired using ultra-high resolution MP2RAGE sequence with the following parameters: 0.5 mm isotropic resolution, repetition time (TR) = 5000ms, echo time (TE) = 5.75 ms, inversion time (TI) TI1/TI2=900ms/2780ms, 224 axial slices with slab thickness 11.5 cm, field-of-view=224.5×203×112mm3, and slab selective excitation and flow suppression (Marquez et al., 2010). Total scan time was 25 minutes. Images at the two inversion times (TI1/TI2) were used to calculate bias-field corrected quantitative T1 maps and T1 weighted images.
Diffusion-weighted images were also acquired in the same session with a single shot spin echo EPI sequence with monopolar diffusion encoding (Ugerbil et al., 2013; Vu et al., 2015). Parameters included: 2 mm isotropic resolution, 108 directions/b-values from 0–2000 s/mm2, TR/TE = 4000/62 ms, whole brain coverage, multi-band factor of 2 (Auerbach et al., 2013), in-plane GRAPPA acceleration R=3. Paired acquisitions with reversed phase encoding in the AP/PA direction were acquired at 7.5 min per scan for a total scan time for dMRI of 15 min. The gradient table for the scan was identical to that presented in Chiang and colleagues (Chiang et al., 2014) with 99 diffusion-encoding directions isotropically distributed from b=200 s/mm2 to b=2000 s/mm2 with 9 b=0 s/mm2 images interleaved. De-identified data may be made available to researchers in other institutions, upon request to the corresponding author, under a legally binding data use agreement that specifies of the planned data use.
High resolution intracortical myelin profiling using T1 maps
Image preprocessing followed the procedures developed by Dinse and colleagues (Dinse et al., 2015). The T1 maps, T1-weighted images and TI2 images were skull-stripped, background-masked and aligned (using rigid 6 degrees-of-freedom registration, normalized mutual information) to a 0.4 mm MNI template using the CBS Tools (https://www.nitrc.org/projects/cbs-tools). Next, images were corrected for field inhomogeneities and histogram-matched to a template image from the sample of Dinse at al. (2015) using 3D Slicer (https://www.slicer.org/). Using the Topology-preserving, Anatomy-Driven Segmentation (TOADS) (Bazin & Pham, 2007) and Multi-object Geometric Deformable Model (MGDM) (Bazin et al., 2014) segmentation algorithms as integrated in the CBS Tools, images were filtered with arteries and dura segmentations, corrected for partial volume effects and were then segmented into gray matter, white matter and cerebrospinal fluid (CSF). The cortex was extracted using the CRUISE algorithm (Landman et al., 2013), which is robust to white matter lesions (Shiee et al., 2014), and divided into 20 cortical depth-levels using a volume-preserving approach as implemented in the Volumetric Layering module of CBS Tools (Waehnert et al., 2014). This level-set approach generates one 2-dimensional surface per layer containing T1 values at each surface location. Next, the Profile Sampling module of CBS Tools was used to transform the 2-dimensional level-sets to 3-dimensional representations of T1 values. This transformation represents each vertex T-values of each level-set surface as a column of identical T1 values perpendicular to the surface (Dinse et al., 2015). The final result of this pipeline is 20 volumes of cortical profiles, one for each depth-level, for each of 15 healthy and the 5 MS patients. The whole process was completed within each individual’s native space. A set of exemplary results from healthy individuals and patients with MS are shown in Supplemental Figures 1 and 2.
Next, the cortex was segmented and parcellated in native space using Freesurfer (https://surfer.nmr.mgh.harvard.edu/). This parcellation was based on the pre-processed T1-weighted images alone (independent of the cortex extraction described above) and was used to obtain 148 cortical regions-of-interest (ROIs) in native-space based on the Destrieux atlas. We used the Destrieux atlas, which separates gyri from sulci (Destrieux et al., 2010) because cortical myelin profile and content varies between gyri and sulci (Waehnert et al., 2014; Sereno et al., 2013). Prior to further analyses, we implement a strict quality control protocol whereby whole brain 3D segmentations were visually inspected and we further checked the Freesurfer cortical thickness estimates for regions around long/short gyri and the claustrum where segmentation is often challenging. Mean thickness values, for left and right respectively, were 3.44mm and 3.37mm for the short gyrus, 2.92mm and 2.94mm for the anterior insula, 2.59mm and 2.50mm for the inferior insula, and 2.54mm and 2.74mm for the superior insula. Overall mean cortical thickness according to FreeSurfer was 2.47 (sd=0.32).
In each participant and for each cortical ROI, we estimated (a) the absolute T1 value as an index of myelin concentration at each depth-level, (b) the non-linearity index, a novel measure reflecting the depth-dependent distribution of T1 values along the cortical depths from the outer CSF boundary to the inner white-matter boundary, (c) distinct positive and negative deviations from linearity, (d) cortical thickness as provided in the Freesurfer output. The non-linearity index is the deviation from linearity from the curve of T1 value distribution along the cortical ribbon, which was calculated as the squared difference between the observed T1 values and the linear regression line approximated by the curve (Figure 1). The positive and negative deviations from linearity represent respectively the area above and underneath the regression line in Figure 1. Figure 1 also contains two illustrative examples from occipital and prefrontal regions, respectively with low and high profile nonlinearity. We chose to derive cortical thickness from Freesurfer on the basis of the T1-weighted maps alone, independent of the myelin profiling pipeline, to minimize confounding of cortical thickness estimation with the T1 values and the cortex extraction. The scripts we used to run the pipeline is available upon request, here.
Figure 1. Two examples of myelin profiles, representative of a high non-linearity index (top) and low nonlinearity index (bottom).
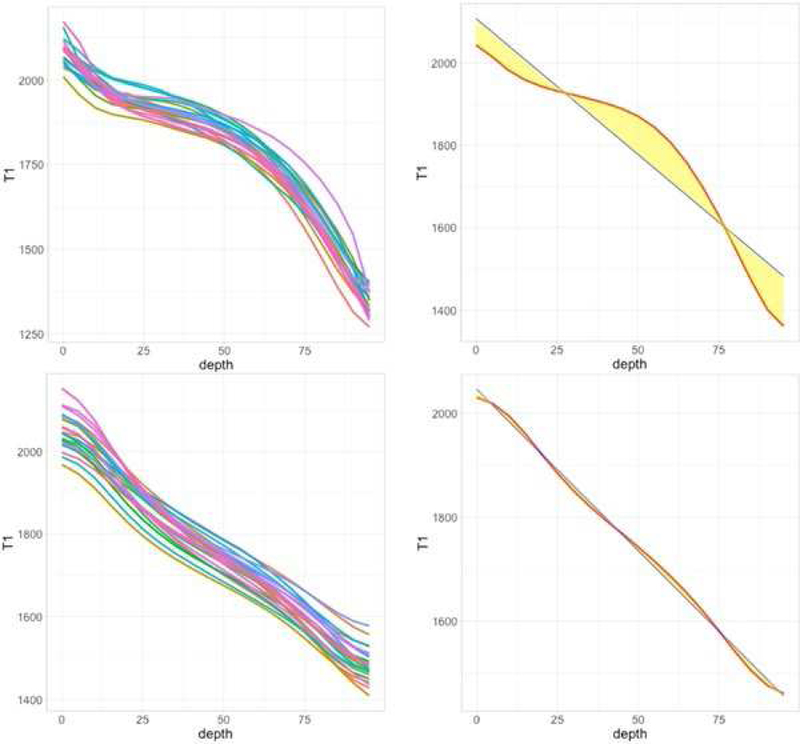
The top example is the left mid-anterior cingulate cortex; the bottom example is the left superior occipital gyrus. The left column shows profiles for each individual participant. The right column highlights the nonlinearity index (yellow area) for a single participant, as the deviation from the linear fit (blue) to the profile (red). Figures of all individual profiles for all regions are available in Supplemental Information-2.
For the MS patients, we simply transformed their T1 values to Z-scores based on the T1 distributions in the healthy individuals, and inspected the degree of deviation from the normative values as a qualitative validation of the interpretation of the T1 profiles.
2.3. Quality Assessment of T1 profiling in the healthy participants
Several steps were undertaken to ensure the data quality of the final T1 profiles. First, three participants were excluded after visual inspection of the raw volumes and the Freesurfer cortical parcellations. Second, across all participants we excluded individual regions with outlier values based on the deviation from the median T1 profile of each region. To this end, we calculated shape of the median profile of each region which closely a cubic spline (all R2 > 0.98). Individual regions were excluded case-wise (1) their fit (R2) to the median spline was <0.70; or (2) their absolute deviation from the median spline was at the 5% extreme end of the sample. These criteria allowed stricter control with regards to the shape of the cortical myelin profiles and less strict control on the height of the curve. This is because we considered significant deviations from the typical regional myelin profile shape as indicators of poor data quality. A deviation in myelin content at a specific depth-level may, on the other hand, indicate subtle but real differences in cortical organization. Following the application of these quality control criteria, 34 of the 148 cortical regions were excluded completely from the analysis because many participants had deviant profiles (Supplemental Table 1). Figures of all myelin profiles are available in Supplemental Information-2, with profiles excluded after quality control depicted in red. Visual inspection of these figures suggests that the objective quality control criteria were adequate at consistently identifying profiles that deviated a lot from typical patterns. In accordance with previous reports (Glasser & Van Essen, 2011; Haast et al., 2016), artifacts due to residual inhomogeneity were observed in the medial orbitofrontal and inferior temporal lobes. We also observed artifacts in the most superior medial fronto-parietal regions due to RF inhomogeneity and reduced field of view. As mentioned, these regions were removed from the analyses following our quality control procedures. The data for the MS patients were subject to quality control as described above with the exception of their myelin profiles of the MS patients because deviations from “typical” profiles are likely in this population. Generally, it is (as always) possible that some subtle artefacts or segmentation biases, not visible by the naked eye or not captured by our quality control algorithm, could have persisted. However, to really alter our conclusions, they would have to be non-random in relation to cortical depth and thickness, and this we consider unlikely.
2.5. Extraction of sub-cortical white matter FA values
Diffusion-weighted MRI data were pre-processed in accordance to pipelines developed by the human connectome project (HCP) (Glasser et al., 2013) modified in-house to accommodate the imaging protocol and the strong B0-eddy currents of our scanner (O’Halloran et al., 2015). Multi-band dMRI images were reconstructed using SENSE (Sotiropoulos et al., 2013). Preprocessing consisted of slice-wise eddy current correction of the first 2 acquired slice groups, fitting of the field map from oppositely encoded non-diffusion-weighted (b=0) images with “topup” in FSL, correction of distortions due to eddy currents using FSL, and correction of gradient non-linearities using “gradunwarp”, an HCP routine implemented in python. The diffusion-weighted volumes were visually inspected for quality assurance. The data were then skull-stripped and diffusion tensors were calculated respectively using “bet” and “dtifit” in FSL. To extract white matter FA-values underneath each cortical region, the Destrieux cortical regions were dilated with 1mm, binarized, and multiplied by the white matter segmentation. For each subject, the individual T1-weighted image was linearly transformed to each subject’s b0 image using “FLIRT2 in FSL with 6 degrees of freedom and used to transform the Freesurfer ROIs to the FA map. The subcortical regional masks were then overlaid on the FA maps to extract the mean FA values underneath each region (Supplemental Figure 3).
2.6. Statistical analyses
Statistical analyses were implemented in R. To help interpret the non-linearity index, we first investigated the contribution of each depth-level to the non-linearity index. For this, we used stepwise mixed linear models with non-linearity as dependent variable, cortical region as fixed factor, subject as random factor (with random intercept), and all T1 values at each depth level as separate fixed regressors. Next, analyses of T1 values (indicative of myelin concentration) and analyses of the non-linearity index were conducted separately using the same mixed linear models with cortical thickness as continuous predictor. We also calculated Spearman’s rank correlation coefficients between cortical thickness and T1 values and non-linearity indices within each region across all individuals as well as within each individual. The aim of these correlational analyses was to confirm that the pattern identified using the mixed regression models was also observed at the level of univariate correlations and not to make inferences about statistical significance. The same methods (mixed-models and correlations) were used to investigate associations between subcortical FA values with T1 and non-linearity indices. To investigate whether positive deviations or negative deviations were mainly driving the observed associations with non-linearity, significant associations of the non-linearity index were also tested for positive and negative deviations from linearity specifically, using the same mixed linear model approach.
We then tested whether regions formed separate clusters with respect to their average non-linearity using Gaussian mixture modelling clustering as implemented in the mclust package in R (Scrucca et al., 2016). This algorithm uses an expectation-maximization algorithm to decide upon the optimal clustering solution and also provides the Bayesian information criterion (BIC) to corroborate the choice.
3. RESULTS
3.1. Properties of intracortical myelin profiles in healthy individuals.
As expected T1 values were lower (a) near the gray-white matter boundary and higher near the CSF surface with a slight leveling between 50% and 75% of cortical depth and (b) around the central sulcus and in the visual and auditory cortices. Figure 2A shows the median T1 values at three cortical depth-levels. At each level, the expected increase in myelin around the central sulcus, the visual cortices and the auditory cortices are clearly visible. Figure 2B shows the distribution of the non-linearity index across the cortical ribbon. Although cortical regions differed in their non-linearity index these differences did not form discreet clusters (Supplemental Table 2). Stepwise mixed model regression on nonlinearity across all regions, with T1 values of all depth levels as predictors revealed that, in general, T1 values at 5%, 10%, 80% and 100% were the strongest negative predictors of non-linearity, whereas T1 values at 40%, 55% and 65% were the strongest positive predictors or profile nonlinearity (all P < 0.0025). This indicates that nonlinearity across regions was driven mostly by a T1 “plateau” of lower myelin in the middle layers in combination with higher myelin estimates at ends of the curve. The nonlinearity indices of outliers were differently influenced by T1 values at each depth-level (interactions with depth-level: 0.01 < P < 1016), indicating that nonlinearity profiles of these outliers do not always represent the same characteristics as for the typical profiles.
Figure 2: Median T1 values and Non-linearity indices across cortical regions-of-interest.

Red indicates higher myelin concentrations (i.e., lower T1 values); Blue indicates lower myelin concentrations (i.e., higher T1 values); Gray indicates regions excluded after following quality control (details on see methods 2.4). GWB=gray-white matter boundary.
3.2. Comparison to MS patients
Figure 3 and Supplemental Figure 4 show individual MS patients’ deviation from controls in terms of overall and region-specific intracortical T1 values. There was a high degree of inter-individual heterogeneity. One patient very clearly had widespread and pronounced (Z > 4) reductions in estimated myelin concentrations. At the other extreme, one patient appeared to have increased myelin concentration in several, different cortical regions. Taken together, results were most consistent at deeper cortical levels around 75% of depth, and around the central sulcus and in the cingulate cortex. In both of these regions 3 of the five patients showed myelin levels that were 2–5 standard deviations lower than those in controls.
Figure 3. Individual MS patients’ Z-scores relative to healthy controls at 75% of cortical depth.

Each column is a patient with MS. Rows, from top to bottom: left lateral surface, left medial surface, right lateral surface, right medial surface.
3.3. Association between T1 values and cortical thickness
Across all regions (modeling region as a fixed factor and subject as a random factor), there was a positive association (4.23 < t < 14.69; P values between 10−4 and < 10−13) between cortical thickness and T1 values at deeper (30%−100%) but not outer (0%−25%) cortical depth-levels (Supplemental Table 3). This pattern was also apparent in the univariate correlations across and within individuals. The correlation between T1 values and cortical thickness was positive across individuals at 75% of cortical depth but not at 25% (Supplemental Table 4). Within individuals, T1 values across regions also correlated consistently with cortical thickness in the deeper (ρ range: 0.32 to 0.62) rather than outer cortical depth-levels (ρ range: −0.10 to 0.38) (Supplemental Table 5). There were no noteworthy effects of age, age2 but there were region-by-sex interactions on T1 at 25% (P=0.003), 50% (P=5.83*10−5), and 75% of cortical depth-level (P=1.88*10−7); women tended to have higher T1 values compared to men (Supplemental Table 6).
3.4. Association between non-linearity indices and cortical thickness
Across all regions (modeling region as a fixed factor and subject as a random factor), there was a positive relationship between non-linearity indices and cortical thickness (t = 8.27; P < 10−15). This was a consistent observation across and within individuals (Supplemental Tables 7 and 8). The association between cortical thickness and profile non-linearity was equally driven by both positive (t = 6.30; P < 10−9) and negative (t = 6.33; P P < 10−9) deviations from linearity. Similar analyses also found a positive relationship between non-linearity index and average T1 values (t = 4.54; P < 10−5). The prefrontal and cingulate cortices and the insula, displayed markedly more profile nonlinearity than sensorimotor regions such as occipital regions, the superior temporal gyri, and the postcentral gyri (Figure 2B). When we included the outliers in the analysis, the overall association of nonlinearity with cortical thickness in the general mixed model remained significant, although somewhat attenuated (all P < 10^−5). There were no noteworthy effects of age, age2 or sex on non-linearity indices in any region (all P > 0.39).
3.5. Association between subcortical FA and intracortical myelin measures
There was an interaction between depth-level and FA on T1 value (F = 80.41, P < 2.2*10−16). At 95% of cortical depth every individual displayed a negative correlation between FA and T1 value, ranging from - 0.13 (P=0.18) to −0.46(P < 10^−7)(Figure 4), indicating that regions with higher myelin concentration at the gray matter – white matter boundary also have higher FA below this boundary. Correlations at multiple cortical depth-levels, within regions, and within individuals, are available in Supplementary Tables 10−11. There was a positive correlation between subcortical FA and non-linearity indices across regions for all individuals (0.06 < ρ < 0.54; 10−9 < P < 0.50, Supplemental Tables 12–13). For both positive and negative deviations from linearity correlations with FA were between 0.10 (P=0.29) and 0.56 (P < 10−9). When we included the outliers, the individual correlations with FA remained consistently positive (0.10 < rho < 0.54).
Figure 4. Fractional anisotropy (FA) in the segment just below the cortex was negatively associated with T1 values in deep cortical layers.

Each line represents one subject, showing the consistency of these relationships across individuals. Each line is a linear fit of one subject’s T1 values at 95% depth regressed on sub-cortical FA values across the brain.
4. DISCUSSION
We used quantitative ultra-high field MR imaging to examine intracortical myelin organization in the living human brain in relation to cortical thickness and subcortical FA values. In addition to estimating myelin concentration, we computed the non-linearity index, a novel metric that assesses the spatial distribution of myelin along the cortical ribbon.
We found that estimates of myelin concentration were higher in sensory and motor cortices and lower in higher-order association areas (Figure 2A). Our results confirm previous findings in healthy individuals obtained using the same acquisition and processing methods (Dinse et al., 2015) as well other methods such as T1/T2 ratios (Glasser et al., 2016; Glasser et al., 2014; Haast et al., 2016; Marques et al., 2017; Van Essen & Glasser, 2014), and T2* (Haast et al., 2016; Marques et al., 2017). Qualitative comparison with 5 patients with MS, used as “positive controls”, showed that the current method identified cortical myelin concentration alterations in this prototypical demyelinating disease.
Cortical thickness and estimated myelin concentration (inferred from T1 values) were positively associated. This association was present across regions but also across individuals. This interregional variability in cortical thickness and myelin concentration is also thought to underlie inter-individual variability (Grydeland et al., 2013) although methodological explanations relating to cortical segmentation cannot be fully ruled out. Failure to include highly myelinated deep cortical layers would result in lower myelin concentration estimates while erroneous inclusion of subcortical white matter would lead to higher estimates. However, our results are less likely to be confounded by segmentation errors given that the cortical thickness measures were derived from a different segmentation than the myelin estimates.
The results reported here suggest that subcortical FA values are associated with higher myelin concentrations at the deeper cortical levels (Figure 4). FA reflects a number of white matter properties including, but not limited to, myelin. In general, FA values estimated near the gray-white matter boundary are more susceptible to artifacts in the modeling of white matter fibers close to the cortex. However, regions where highly myelinated fibers enter or leave the cortex are expected to have both higher FA and lower T1 values. The consistency of this association across subjects, and its lack in the outer cortical layers, supports a neurophysiological interpretation. Moreover, confounding effects due to cortical segmentation errors are unlikely, because over-estimation of the cortical depth is less likely for high-FA, stereotypical white matter. Thus, the association between sub-cortical FA and quantitative T1 values is in line with neurophysiological properties and represents a cross-modal confirmation of the T1 profiling approach used here.
A key novelty of this paper is the introduction of the non-linearity index as a measure of intracortical myelin organization (Figure 1). The availability of an automatically generated, single metric for myelin organization obtained from in vivo MRI benefits future, larger-scale, data-driven studies in terms of statistical power and required resources. In addition, in studies of pathology, the nonlinearity index will be more sensitive to deviations from the norm in the presence of etiological heterogeneity in the type of myelin disorganization across patients, as may be the case in major psychiatric disorders. Variability in the non-linearity index was primarily driven by decreased myelin in the middle cortical layers, in combination with increased myelin at both outer and inner depth-levels. Associations of total nonlinearity with other anatomical metrics was driven by equal contributions of both decreased myelin in middle layers and increased myelin at both inner white matter and outer CSF boundaries. The interregional correlations of T1 values and profile nonlinearity with cortical thickness and FA likely reflect general organizational principles of the brain linking regional morphology and connectivity (Barbas, 2015; Beul et al., 2015; Huntenburg et al., 2017; Scholtens et al., 2014). For example, unimodal sensory cortical are relatively thin, have more myelinated neurons, fewer and less elaborate dendrites, and sparser functional connections compared to higher-order areas (Beul et al., 2015; Huntenburg et al., 2017; Scholtens et al., 2014). Higher-order regions, on the other hand, contain less myelin, have more abundant connections with the rest of the brain (Beul et al., 2015; Huntenburg et al., 2017; Scholtens et al., 2014), and more complex dendritic arborization that takes up more unmyelinated space within the cortex (Glasser & Van Essen, 2011). These organizational principles are also reflected in distinct evolutionary origins and developmental trajectories, where ontological and phylogenic early regions serve more primary functions and are less plastic throughout life, compared to late evolved and late developing cortical regions. Raw T1 values, cortical profiles and nonlinearity indices appear to capture partly overlapping and partly unique aspects of these general organizational principles of the brain.
Taken together, our results suggest that the non-linearity index effectively captures inter-regional and inter-individual variation in laminar myelin organization that is not represented by absolute T1 values or other metrics alone. Despite these indications, an understanding of the physiological properties underlying the non-linearity index is beyond the resolution of neuroimaging. Evidence from post-mortem human studies suggests that the higher non-linearity index observed in prefrontal regions may be due to lower myelin content in deep layers (Nave and Werner, 2014). On the other hand, investigations of the mouse cortex have shown that in the superficial cortical layers 2 and 3 there exists a surprising amount of a distinct type of myelin surrounding inhibitory neurons (Micheva et al., 2016), raising the possibility that an increase in this myelin could influence nonlinearity. The non-linearity index may also be influenced by cortical thickness per se as thicker cortices allow for improved sampling of the T1 values across the cortical ribbon leading to smaller partial volume effects. Post-mortem evidence in humans and animal studies are required to better understand the physiological underpinnings of the non-linearity index. Given the importance of intracortical myelin organization for human behavior and neuropsychiatric disorders (Haroutunian et al., 2014), the non-linearity index may be an enticing new imaging phenotype to investigate in clinical populations and across the lifespan. A notable advantage of the present work is that is extends previous manual procedures of cortical myelin profiling to become automated and data-driven, and therefore applicable to large datasets and exploratory research in bran disorders with unknown etiology.
Several limitations of this study ought to be clarified. Firstly, the signal-to-noise ratio was relatively low, but still acceptable, due to the high resolution of our quantitative whole-brain T1 maps. The inhomogeneous transmit field at 7T caused considerable signal dropout in the most inferior regions and frequent clipping of the superior medial regions. These cortical regions were therefore removed from our analysis (Supplemental Table 1). This tradeoff allowed us to achieve maximum brain coverage at 0.5mm isotropic resolution in a reasonable scan time ensuring that the data acquisition would be easily tolerated by participants. Issues of tolerability and cost-containment are particularly important for the application of this method to larger samples and to clinical populations. We choose to use cortical parcellation, rather than vertex-wise analyses, to avoid normalization to a common template, which requires reshaping individual cortical surfaces to a template and can obscure inter-individual differences in folding. Moreover, we used the Destrieux cortical parcellation scheme because it was developed according to precise anatomical rules, taking into account cytoarchitectural boundaries and curvature landmarks, and it produces anatomical labels that are closely matched to expert manual tracings (Destrieux et al., 2010). Therefore, whilst we might lose some anatomical resolution, we argue that our approach achieves greater power, minimal confounding of inter-individual variability in curvature and improved interpretability, compared to template-normalized vertex-wise analyses. We note the obvious limitation that T1 values do not directly reflect myelin concentrations, but are a close approximation. T1 values are also influenced to a lesser extent by iron concentrations although this is unlikely to be a major factor in a sample of young healthy individuals. Despite these limitations, we obtained quantitative measurements that passed quality control, and are consistent with previous in vivo and ex vivo reports from independent research groups using variable methods. Intracortical myelin quantification and high-field MRI are very fast developing areas of research, and the present findings contribute to this work in progress.
In conclusion, we demonstrate the use of an automatic, whole-brain method to perform data-driven examination of intracortical myelin organization using quantitative MRI in vivo. The extracted metrics, T1 values and the non-linearity index, have characteristic patterns across cortical regions, and are associated with thickness and underlying white matter microstructure. This approach enables large-scale and longitudinal investigations of intracortical myelin throughout development and aging and in clinical populations.
Supplementary Material
Acknowledgements.
We would like to thank Eugene Fluder from Scientific Computing at the Icahn School of Medicine at Mount Sinai for his help in implementing the analysis on the high performance computing cluster. E.S. is supported by a Hypatia Tenure Track grant from the Radboudumc and a NARSAD Young Investigator Award (ID: 25034).
Funding: This work was supported in part through computational resources and staff expertise provided by Scientific Computing at the Icahn School of Medicine at Mount Sinai. Dr. Frangou received support from the National Institutes of Health (R01MH113619). Dr. Sprooten is supported by a Hypatia Tenure Track grant from the Radboud University Medical Centre and a NARSAD Young Investigator Grant from the Brain and Behavior Foundation (ID: 25034).
Footnotes
Publisher's Disclaimer: This is a PDF file of an unedited manuscript that has been accepted for publication. As a service to our customers we are providing this early version of the manuscript. The manuscript will undergo copyediting, typesetting, and review of the resulting proof before it is published in its final citable form. Please note that during the production process errors may be discovered which could affect the content, and all legal disclaimers that apply to the journal pertain.
References
- Auerbach EJ, Xu J, Yacoub E, Moeller S, Ugurbil K. Multiband accelerated spin-echo echo planar imaging with reduced peak RF power using time-shifted RF pulses. Magnetic Resonance in Medicine 2013; 69:1261–1267. [DOI] [PMC free article] [PubMed] [Google Scholar]
- Barbas H General cortical and special prefrontal connections: principles from structure to function. Annu Rev Neurosci 2015; 38:269–89. 10.1146/annurev-neuro-071714-033936. [DOI] [PubMed] [Google Scholar]
- Bazin PL, Pham DL. Topology-preserving tissue classification of magnetic resonance brain images. IEEE Trans Med Imaging 2007;487–496. [DOI] [PubMed]
- Bazin PL, Weiss M, Dinse J, Schafer A, Trampel R. Turner R. A computational framework for ultra-high resolution cortical segmentation at 7Tesla. Neuroimage 2014; 201–209. [DOI] [PubMed]
- Bercury KK, Macklin WB. Dynamics and mechanisms of CNS myelination. Dev Cell 2015;32(4):447–458. 10.1016/j.devcel.2015.01.016. [DOI] [PMC free article] [PubMed] [Google Scholar]
- Beul SF, Grant S, Hilgetag CC. A predictive model of the cat cortical connectome based on cytoarchitecture and distance. Brain Struct Funct 2015; 220(6):3167–84. 10.1007/s00429-014-0849-y. [DOI] [PMC free article] [PubMed] [Google Scholar]
- Bock NA, Kocharyan A, Liu JV, Silva AC. Visualizing the entire cortical myelination pattern in marmosets with magnetic resonance imaging. J Neurosci Methods 2009;185(1):15–22. 10.1016/j.jneumeth.2009.08.022. [DOI] [PMC free article] [PubMed] [Google Scholar]
- Bock NA, Hashim E, Kocharyan A, Silva AC. Visualizing myeloarchitecture with magnetic resonance imaging in primates. Ann N Y Acad Sci 2011;1225 Suppl 1:E171–181. 10.1111/j.1749-6632.2011.06000.x. [DOI] [PMC free article] [PubMed] [Google Scholar]
- Carey D, Caprini F, Allen M, Lutti A, Weiskopf N, Rees G, Callaghan MF, Dick F. Quantitative MRI provides markers of intra-, inter-regional, and age-related differences in young adult cortical microstructure. NeuroImage 2017. pii: S1053–8119 (17): 31012–1. 10.1016/j.neuroimage.2017.11.066. [DOI] [PMC free article] [PubMed] [Google Scholar]
- Chiang CW, Wang Y, Sun P, Lin TH, Trinkaus K, Cross AH, Song SK. Quantifying white matter tract diffusion parameters in the presence of increased extra-fiber cellularity and vasogenic edema. Neuroimage 2014; 101:310–319. [DOI] [PMC free article] [PubMed] [Google Scholar]
- Destrieux C, Fischl B, Dale A, Halgren E. Automatic parcellation of human cortical gyri and sulci using standard anatomical nomenclature. Neuroimage 2010; 53(1):1–15. 10.1016/j.neuroimage.2010.06.010. [DOI] [PMC free article] [PubMed] [Google Scholar]
- Dinse J, Härtwich N, Waehnert MD, Tardif CL, Schäfer A, Geyer S, Preim B, Turner R, Bazin PL. A cytoarchitecture-driven myelin model reveals area-specific signatures in human primary and secondary areas using ultra-high resolution in-vivo brain MRI. Neuroimage 2015;114:71–87. 10.1016/j.neuroimage.2015.04.023 [DOI] [PubMed] [Google Scholar]
- Fracasso A, van Veluw SJ, Visser F, Luijten PR, Spliet W, Zwanenburg JJM, Dumoulin SO, Petridou N Lines of Baillarger in vivo and ex vivo: Myelin contrast across lamina at 7T MRI and histology 2016;133:163–175. 10.1016/j.neuroimage.2016.02.072. [DOI] [PubMed] [Google Scholar]
- Fields RD, Araque A, Johansen-Berg H, Lim SS, Lynch G, Nave KA, Nedergaard M, Perez R, Sejnowski T, Wake H. Glial biology in learning and cognition. Neuroscientist 2014;20(5):426–431. 10.1177/1073858413504465. [DOI] [PMC free article] [PubMed] [Google Scholar]
- Fields RD. A new mechanism of nervous system plasticity: activity-dependent myelination. Nat Rev Neurosci 2015;16(12):756–767. 10.1038/nrn4023 [DOI] [PMC free article] [PubMed] [Google Scholar]
- Gardner C, Magliozzi R, Durrenberger PF, Howell OW, Rundle J, Reynolds R. Cortical grey matter demyelination can be induced by elevated pro-inflammatory cytokines in the subarachnoid space of MOG-immunized rats. Brain 2013;136(12):3596–3608. [DOI] [PubMed] [Google Scholar]
- Glasser MF, Coalson TS, Robinson EC, Hacker CD, Harwell J, Yacoub E, Ugurbil K, Andersson J, Beckmann CF, Jenkinson M, Smith SM, Van Essen DC. A multi-modal parcellation of human cerebral cortex. Nature 2016; 536: 171–178. 10.1038/nature18933 [DOI] [PMC free article] [PubMed] [Google Scholar]
- Glasser MF, Goyal MS, Preuss TM, Raichle ME, Van Essen DC. Trends and properties of human cerebral cortex: correlations with cortical myelin content. Neuroimage 2014;93 Pt 2:165–175. 10.1016/j.neuroimage.2013.03.060. [DOI] [PMC free article] [PubMed] [Google Scholar]
- Glasser MF, Sotiropoulos SN, Wilson JA, Coalson TS, Fischl B, Andersson JL, Xu J, Jbabdi S, Webster M, Polimeni JR, Van Essen DC, Jenkinson M; WU-Minn HCP Consortium. The minimal preprocessing pipelines for the Human Connectome Project. Neuroimage 2013;80:105–124. 10.1016/j.neuroimage.2013.04.127. [DOI] [PMC free article] [PubMed] [Google Scholar]
- Glasser MF, Van Essen DC. Mapping human cortical areas in vivo based on myelin content as revealed by T1- and T2-weighted MRI. J Neurosci 2011;31(32):11597–11616. 10.1523/JNEUROSCI.2180-11.2011. [DOI] [PMC free article] [PubMed] [Google Scholar]
- Grydeland H, Walhovd KB, Tamnes CK, Westlye LT, Fjell AM. Intracortical myelin links with performance variability across the human lifespan: results from T1- and T2-weighted MRI myelin mapping and diffusion tensor imaging. J Neurosci 2013;33(47):18618–18630. 10.1523/JNEUROSCI.2811-13.2013 [DOI] [PMC free article] [PubMed] [Google Scholar]
- Haast RA, Ivanov D, Formisano E 1, Uludaǧ K Reproducibility and Reliability of Quantitative and Weighted T1 and T2* Mapping for Myelin-Based Cortical Parcellation at 7 Tesla. Front Neuroanat 2016;10:112 eCollection 2016. [DOI] [PMC free article] [PubMed] [Google Scholar]
- Haroutunian V, Katsel P, Roussos P, Davis KL, Altshuler LL, Bartzokis G. Myelination, oligodendrocytes, and serious mental illness. Glia 2014; 62(11), 1856–1877. doi:10.1002/glia.22716 [DOI] [PubMed] [Google Scholar]
- Höistad M, Heinsen H, Wicinski B, Schmitz C, Hof PR . Stereological assessment of the dorsal anterior cingulate cortex in schizophrenia: absence of changes in neuronal and glial densities. Neuropathol Appl Neurobiol 2013; 39(4): 348–361. [DOI] [PMC free article] [PubMed] [Google Scholar]
- Hunt BA, Tewarie PK, Mougin OE, Geades N, Jones DK, Singh KD, Morris PG, Gowland PA, Brookes MJ. Relationships between cortical myeloarchitecture and electrophysiological networks. Proc Natl Acad Sci U S A 2016;113(47):13510–13515. [DOI] [PMC free article] [PubMed] [Google Scholar]
- Huntenburg JM, Bazin PL, Goulas A, Tardif CL, Villringer A, Margulies DS. A Systematic Relationship Between Functional Connectivity and Intracortical Myelin in the Human Cerebral Cortex. Cereb Cortex 2017;27(2):981–997. [DOI] [PMC free article] [PubMed] [Google Scholar]
- Konner M Universals of Behavioral Development in Relation to Brain Myelination. In: Gibson KR, Petersen AC, editors. Brain Maturation and Cognitive Development New York: Aldine de Gruyter; 1991. pp. 181–223. [Google Scholar]
- Kuehn E, Dinse J, Jakobsen E, Long X, Schäfer A, Bazin PL, Villringer A, Sereno MI, Margulies DS Body Topography Parcellates Human Sensory and Motor Cortex. Cerebral Cortex, 2017; 27(7):3790–3805. 10.1093/cercor/bhx026. [DOI] [PMC free article] [PubMed] [Google Scholar]
- Landman BA 1, Bogovic JA, Carass A, Chen M, Roy S, Shiee N, Yang Z, Kishore B, Pham D, Bazin PL, Resnick SM, Prince JL System for integrated neuroimaging analysis and processing of structure. Neuroinformatics 2013;11(1):91–103. 10.1007/s12021-012-9159-9. [DOI] [PMC free article] [PubMed] [Google Scholar]
- Marques JP, Khabipova D, Gruetter R. Studying cyto and myeloarchitecture of the human cortex at ultra-high field with quantitative imaging: R1, R2* and magnetic susceptibility. Neuroimage 2017;147:152–163. 10.1016/j.neuroimage.2016.12.009. [DOI] [PubMed] [Google Scholar]
- Marques JP, Kober T, Krueger G, van der Zwaag W, Van de Moortele PF, Gruetter R. MP2RAGE, a self bias-field corrected sequence for improved segmentation and T1-mapping at high field. Neuroimage 2010;49(2):1271–1281. 10.1016/j.neuroimage.2009.10.002. . [DOI] [PubMed] [Google Scholar]
- Micheva KD, Wolman D, Mensh BD, Pax E, Buchanan J, Smith SJ, Bock DD. A large fraction of neocortical myelin ensheathes axons of local inhibitory neurons. Elife 2016, 5. doi:10.7554/eLife.15784 [DOI] [PMC free article] [PubMed] [Google Scholar]
- Mills KL, Goddings AL, Herting MM, Meuwese R, Blakemore SJ, Crone EA, Dahl RE, Güro ğlu B, Raznahan A, Sowell ER, Tamnes CK. Structural brain development between childhood and adulthood: Convergence across four longitudinal samples. Neuroimage 2016;141:273–281. 10.1016/j.neuroimage.2016.07.044. [DOI] [PMC free article] [PubMed] [Google Scholar]
- Mottershead JP, Schmierer K, Clemence M, Thornton JS, Scaravilli F, Barker GJ, Tofts PS, Newcombe J, Cuzner ML, Ordidge RJ, McDonald WI, Miller DH. High field MRI correlates of myelin content and axonal density in multiple sclerosis--a post-mortem study of the spinal cord. J Neurol 2003;250(11):1293–12301. [DOI] [PubMed] [Google Scholar]
- Nave KA, Werner HB. Myelination of the nervous system: mechanisms and functions. Annu Rev Cell Dev Biol 2014;30:503–533. 10.1146/annurev-cellbio-100913-013101. [DOI] [PubMed] [Google Scholar]
- O’Halloran RL, Yang C, Xu J. Correction of Artifacts Caused by Transient Eddy Currents In Simultaneous Multi-Slice dMRI. Abstract 2931. In the Proceedings of the 23rd Annual Meeting of the International Society for Magnetic Resonance in Medicine, Toronto, Canada, 2015. [Google Scholar]
- Purger D, Gibson EM, Monje M. Myelin plasticity in the central nervous system. Neuropharmacology 2016;110(Pt B):563–573. [DOI] [PubMed] [Google Scholar]
- Rajkowska G, Miguel-Hidalgo JJ, Makkos Z, Meltzer H, Overholse J, Stockmeier C. Layer-specific reductions in GFAP-reactive astroglia in the dorsolateral prefrontal cortex in schizophrenia. Schizophr Res 2002; 57(2–3):127–138. [DOI] [PubMed] [Google Scholar]
- Sanchez-Panchuelo RM, Francis S, Bowtell R, Schluppeck D. Mapping human somatosensory cortex in individual subjects with 7T functional MRI. J Neurophysiol 2010;103(5):2544–56. 10.1152/jn.01017.2009. [DOI] [PMC free article] [PubMed] [Google Scholar]
- Scholtens LH, Schmidt R, de Reus MA, van den Heuvel MP. Linking macroscale graph analytical organization to microscale neuroarchitectonics in the macaque connectome. J Neurosci 2014; 3;34(36):12192–205. 10.1523/JNEUROSCI.0752-14.2014. [DOI] [PMC free article] [PubMed] [Google Scholar]
- Scrucca L, Fop M, Murphy TB, Raftery AE. mclust 5: Clustering, Classification and Density Estimation Using Gaussian Finite Mixture Models. The R journal, 2016;8(1):289–317. [PMC free article] [PubMed] [Google Scholar]
- Sereno MI, Lutti A, Weiskopf N, Dick F. Mapping the human cortical surface by combining quantitative T(1) with retinotopy. Cereb Cortex 2013;23(9):2261–2268. [DOI] [PMC free article] [PubMed] [Google Scholar]
- Shafee R, Buckner RL, Fischl B. Gray matter myelination of 1555 human brains using partial volume corrected MRI images. Neuroimage 2015;105:473–485. 10.1016/j.neuroimage.2014.10.054. [DOI] [PMC free article] [PubMed] [Google Scholar]
- Sheehan DV, Lecrubier Y, Sheehan KH, Amorim P, Janavs J, Weiller E, Hergueta T, Baker R, Dunbar GC. The Mini-International Neuropsychiatric Interview (M.I.N.I.): the development and validation of a structured diagnostic psychiatric interview for DSM-IV and ICD-10. J Clin Psychiatry 1998; 59 (Suppl 20); 22–33. [PubMed] [Google Scholar]
- Shiee N, Bazin PL, Cuzzocreo JL, Ye C, Kishore B, Carass A, Calabresi PA, Reich DS, Prince JL, Pham DL. Reconstruction of the human cerebral cortex robust to white matter lesions: method and validation. Hum Brain Mapp 2014;35(7):3385–401. 10.1002/hbm.22409. [DOI] [PMC free article] [PubMed] [Google Scholar]
- Sotiropoulos SN, Jbabdi S, Xu J, Andersson JL, Moeller S, Auerbach EJ, Glasser MF, Hernandez M, Sapiro G, Jenkinson M, Feinberg DA. Advances in diffusion MRI acquisition and processing in the Human Connectome Project. Neuroimage 2013;80:125–143. [DOI] [PMC free article] [PubMed] [Google Scholar]
- Tardif CL, Schäfer A, Waehnert M, Dinse J, Turner R, Bazin PL. Multi-contrast multi-scale surface registration for improved alignment of cortical areas. Neuroimage 2015; 111, 107–122. [DOI] [PubMed] [Google Scholar]
- Ugurbil K, Xu J, Auerbach EJ, Moeller S, Vu AT, DuarteCarvajalino JM, Lenglet C, Wu X, Schmitter S, Van de Moortele PF et al. Pushing spatial and temporal resolution for functional and diffusion MRI in the human connectome project. Neuroimage 2013; 80:80–104. [DOI] [PMC free article] [PubMed] [Google Scholar]
- Van Essen DC, Glasser MF. In vivo architectonics: a cortico-centric perspective. Neuroimage 2014; 93 Pt 2:157–164. doi:10.1016/j.neuroimage.2013.04.095 [DOI] [PMC free article] [PubMed] [Google Scholar]
- Vu A, Auerbach E, Lenglet C, Moeller S, Sotiropoulos S, Jbabdi S, Andersson J, Yacoub E, Ugurbil K. High resolution whole brain diffusion imaging at 7T for the human connectome project. NeuroImage 2015; 122:318–331. [DOI] [PMC free article] [PubMed] [Google Scholar]
- Waehnert MD, Dinse J, Schäfer A, Geyer S, Bazin PL, Turner R, Tardif CL. A subject-specific framework for in vivo myeloarchitectonic analysis using high resolution quantitative MRI. Neuroimage 2016;125:94–107. 10.1016/j.neuroimage.2015.10.001. [DOI] [PubMed] [Google Scholar]
- Waehnert MD, Dinse J, Weiss M, Streicher MN, Waehnert P, Geyer S, Turner R, Bazin PL. Anatomically motivated modeling of cortical laminae. Neuroimage 2014;93 Pt 2:210–220. 10.1016/j.neuroimage.2013.03.078. [DOI] [PubMed] [Google Scholar]
- Whitaker KJ, Vértes PE, Romero-Garcia R, Váša F, Moutoussis M, Prabhu G, Weiskopf N, Callaghan MF, Wagstyl K, Rittman T, Tait R, Ooi C, Suckling J, Inkster B, Fonagy P, Dolan RJ, Jones PB, Goodyer IM; NSPN Consortium, Bullmore ET. Adolescence is associated with genomically patterned consolidation of the hubs of the human brain connectome. Proc Natl Acad Sci U S A 2016;113(32):9105–9110. 10.1073/pnas.1601745113. [DOI] [PMC free article] [PubMed] [Google Scholar]
Associated Data
This section collects any data citations, data availability statements, or supplementary materials included in this article.