Abstract
Purpose:
To develop a wideband cardiac perfusion pulse sequence and test whether it is capable of suppressing image artifacts in patients with a cardiac implantable electronic device (CIED), while not exceeding the specific absorption rate (SAR) limit (2.0 W/kg).
Methods:
A wideband perfusion pulse sequence was developed by incorporating a wideband saturation pulse to achieve a good balance between saturation of magnetization and SAR. Clinical standard and wideband perfusion MRI scans were performed back-to-back in a randomized order on 16 patients with a CIED undergoing clinical cardiac MRI. Two expert readers graded the artifact intensity and extent on a segmental basis using a 5-point Likert scale, where significant artifact was defined by a composite score. The variance in myocardial signal prior to tissue-enhancement was analyzed to quantify artifact-intensity. Whole-body SAR values computed by the MR scanner were read from the DICOM header. Either a paired t-test or Wilcoxon signed-rank test was performed to compare two groups.
Results:
While the mean whole-body SAR for a single-slice wideband perfusion scan (0.38 ± 0.08W/kg) was significantly (p < 0.05) higher than for a single-slice standard perfusion scan (0.11 ± 0.03W/kg), it was 81% below 2.0 W/kg. The mean variance in myocardial signal prior to tissue-enhancement was significantly (p < 0.001) higher for standard (422.6 ± 306.6 a.u.) than wideband (107.0 ± 60.9 a.u.). Among 105 myocardial segments, standard produced 19 segments (18%) that were deemed to have significant artifacts, whereas wideband produced only 3 segments (3%).
Conclusion:
A wideband perfusion pulse sequence is capable of suppressing image artifacts induced by a CIED while not exceeding SAR at 2.0 W/kg.
Keywords: myocardial perfusion, artifact, cardiac device, CIED, wideband
Introduction
Over 3 million Americans (1) have a cardiac implantable electronic device (CIED). Three broad classes of CIED are in widespread use today: pacemaker, implantable cardioverter-defibrillator (ICD), and cardiac resynchronization therapy (CRT), with each device serving a specific purpose for increasing the survival rate and/or quality of life. A previous study estimated that over 480,000 (16% of 3 million) patients with a CIED will have a clinical indication (e.g, viability, right ventricular dysplasia, aortic disease, sarcoidosis, congenital malformations, infiltrative cardiomyopathies) for a cardiac MRI within their lifetime (2).
Another important application of cardiac MRI is its role as a gatekeeper to cardiac catheterization for patients with intermediate to high pre-test probability of coronary artery disease (CAD)(3), which may co-exist in patients with a CIED or be the underlying cause of conduction defects (4). MRI perfusion is at least as accurate as SPECT for diagnosis of CAD (5) and does not involve ionizing radiation. Additional advantages of MRI include more accurate assessment of function and wall motion, and the ability to simultaneously evaluate thoracic aortic disease, microvascular disease (6), and pericarditis (7) in patients presenting with chest pain. Note, a recent study has reported the feasibility and safety of vasodilator stress perfusion MRI in a small number of patients with a CIED (8).
While a CIED was considered to be a relative contraindication for MRI (9), growing evidence suggests that cardiac MRI can be performed on patients with a CIED, even for those with non-MR-conditional (i.e. legacy) labeling, with manageable risk following established guidelines (10,11). Nonetheless, the diagnostic yield of cardiac MRI is low because of severe image artifacts, regardless of MR-conditional or non-MR conditional labeling. Specifically, up to 1/3 of clinical cases produce non-diagnostic image quality, whereas the remaining 2/3 of cases produce diagnostically adequate but nonetheless suboptimal image quality (12). As per the 2017 HRS expert consensus statement (13), “the importance of MRI for patient evaluation cannot be overstated, and the presence of a CIED should not preclude the performance of MR scanning when clinically indicated.” Thus, there is a need to develop advanced cardiac MRI methods that suppress image artifacts arising from a CIED.
Rashid et al. (14) first introduced the “wideband” concept for late gadolinium enhanced (LGE) MRI, where the investigators employed a wideband inversion pulse to invert highly off-resonant spins induced by a CIED and suppress “bright” image artifacts. Since then, Ranjan et al. (15) replicated wideband LGE MRI at 3T, and the same two groups advanced the wideband concept for cardiac T1 mapping (16,17). A wideband LGE pulse sequence is useful for detecting myocardial scar (18), whereas wideband T1 mapping and its derived metric extracellular volume fraction are useful for detecting myocardial infiltration (19) and diffuse fibrosis (20), respectively. The purpose of this work is to extend the “wideband” concept further and develop a wideband cardiac perfusion pulse sequence, testing whether it is capable of suppressing image artifacts in patients with a CIED while not exceeding the safe specific absorption rate (SAR) limit (2.0 W/kg)(21).
Methods
Saturation RF Pulse Modules
We modified a radio-frequency (RF) field (B1)-insensitive train to obliterate signal (BISTRO)(22) pulse to achieve a good balance between saturation of magnetization and specific absorption rate (SAR). Briefly, a BISTRO pulse module consists of a train of adiabatic inversion pulses designed to violate the adiabatic condition on purpose and achieve a net rotation of 90° over a wide range of frequencies, which is exactly what is needed for first-pass cardiac perfusion MRI in the presence of a CIED.
Using the methods described in our previous work (16), we implemented a BISTRO pulse module as a train of three hyperbolic secant inversion pulses with a net full width at half maximum (FWHM) of 9.2 kHz. Each hyperbolic secant pulse had a duration of 2.82 msec, frequency modulation parameter β = 750 radian/sec, and phase modulation parameter μ = 10 (dimensionless). The total duration including three RF pulses and spoiler and crusher gradients was 18.0 msec (Figure 1). For reference, we used a standard saturation RF pulse module consisting of three 90° rectangular RF pulses (23) with a net FWHM = 2.5 kHz. Each rectangular RF pulse had a duration of 0.5 msec, and the total duration including three RF pulses and spoiler and crusher gradients was 11.0 msec (Figure 1).
Figure 1.
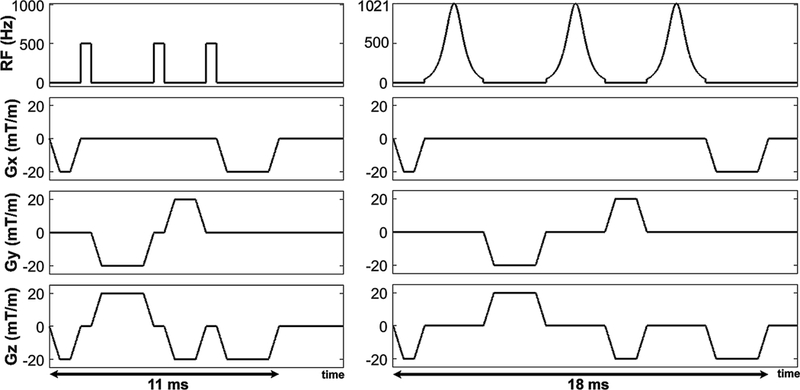
Pulse sequence diagram of standard (left) and wideband (right) saturation RF pulse modules. The pulse duration of standard and wideband modules was 11 and 18 ms, respectively. Note, 500 Hz corresponds to the transmit RF field (when normalized by the gyromagnetic ratio of water) needed to achieve 90° rotation by a rectangular RF pulse with 0.5 ms pulse duration. An identical gradient cycling scheme was used by the two saturation pulse modules.
To verify the performance of BISTRO, we conducted a previously described phantom experiment (16) where the center frequency offset was adjusted from −6.0 to 6.0 kHz (0.2 kHz steps) to measure the residual longitudinal magnetization (Mz) immediately after applying a saturation pulse module. For ease of interpretation, we normalized the magnetization by equilibrium magnetization (M0) such that Mz/M0 1 = no saturation and 0 = perfect saturation. As shown in Figure 2, the full width at half maximum (FWHM) of standard and wideband saturation pulse module was 2.5 and 9.2 kHz, respectively.
Figure 2.
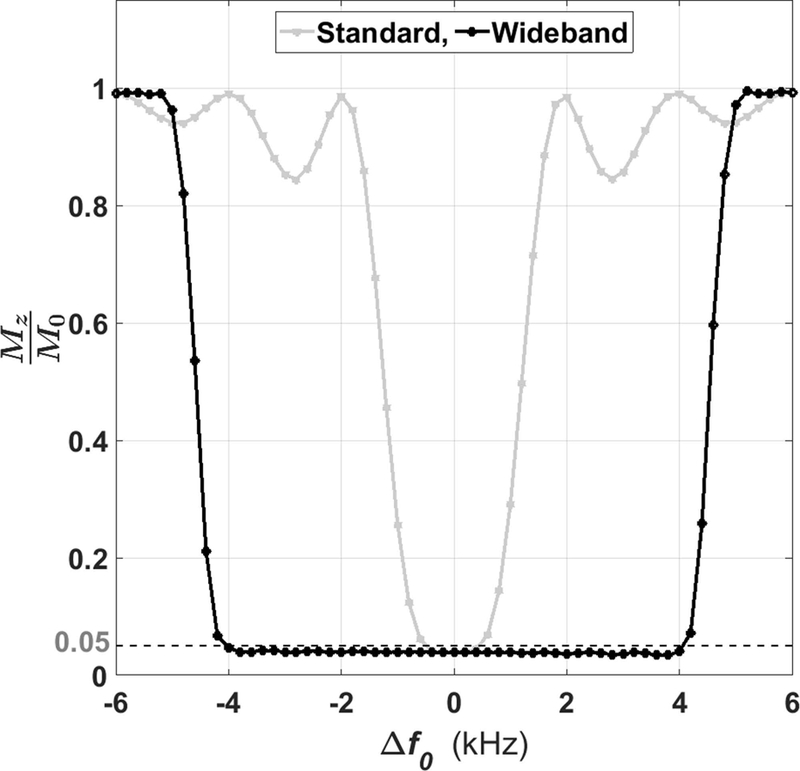
Experimentally derived frequency bandwidths of standard and wideband saturation RF pulse modules. The FWHM was 2.5 kHz for standard and 9.2 kHz for wideband. Δf0: center frequency offset; Mz: longitudinal magnetization; M0: equilibrium magnetization.
RF Energy and SAR Calculation
Using the pulse sequence simulator (IDEA, Siemens Healthcare, Erlangen, Germany), we calculated the transmit RF energy for each saturation pulse module, assuming that the RF voltage needed for transmit RF field of 500 Hz (when normalized by the gyromagnetic ratio of water) is 250 V. This RF calibration assumption is based on our extensive experience with cardiac MRI at 1.5T. The theoretically calculated transmit RF energy of the standard and wideband pulse module was 3.7 and 22.5 J, respectively. While this corresponds to approximately a 6-fold increase in RF energy, note that the duty cycle of a saturation pulse is relatively low in first-pass perfusion MRI (e.g., 3 times per heart beat for sampling three short-axis planes). To verify that the whole-body SAR is below the safe limit (2.0 W/kg) established by the Johns Hopkins group (21), we documented the SAR values computed by the MR scanner by reading them from the Digital Imaging and Communications in Medicine (DICOM) header.
MRI System and Imaging Protocol
Imaging was performed on a single whole-body 1.5 Tesla MRI scanner (Avanto, Siemens Healthcare, Erlangen, Germany), equipped with a gradient system capable of achieving a maximum gradient strength of 45 mT/m and a slew rate of 200 T/m/s. RF excitation was performed using the body coil, and a total of 12–15 coil elements was used for signal reception.
Both standard and wideband pulse sequences used, other than the saturation pulse, the same set of imaging parameters, which included: field of view (FOV) = 360 mm x 270 mm (phase-encoding (PE)), acquisition matrix = 192 × 144 (PE), in-plane resolution = 1.9 mm x 1.9 mm, slice thickness = 8 mm, echo time (TE) = 1.0 msec, repetition time (TR) = 2.4 msec, receiver bandwidth = 745 Hz/pixel, linear k-space ordering, gradient echo readout, readout duration = 172 msec, flip angle = 15°, repetition = 60, and temporal generalized autocalibrating partially parallel acquisitions (TGRAPPA) (24) with an acceleration factor of 2. The saturation-recovery time (TS) was 107 msec, where TS is defined as the duration between the last RF pulse in the saturation module and the center of the excitation RF pulse sampling the center of k-space.
Experiment 1: Retrospective Study of Quality Control in Patients
All patients provided written consent to an umbrella Institutional Review Board (IRB) approved protocol, which describes the risk involved with an MRI in patients with a CIED and that MRI in patients with a non-MR-conditional device is considered off-label. Given the low yield (~33% failure rate) by a clinical standard MR protocol in patients with a CIED (12), our radiology department made a concerted effort to conduct a series of quality control projects for the purpose of providing better clinical service to patients with a CIED. From January 2016 to October 2017, wideband and standard cardiac perfusion pulse sequences were incorporated into our department’s clinical MRI protocol to determine whether wideband produces better diagnostic quality than standard scans in patients with a CIED. Because these clinical MRI scans did not involve a dynamic contrast-enhanced MRI, they provided us an opportunity to add two resting perfusion scans without significantly altering the clinical MRI protocol, particularly the timing for clinical LGE MRI. In a subset of patients, clinical MR technologists ran wideband and standard perfusion scans back-to-back (i.e. zero time gap) in a randomized order, either in one short- or long-axis plane based on their preference. For each scan, 0.075 or 0.1 mmol/kg of gadobutrol (Gadavist, Bayer HealthCare Whippany, USA) was administered with a power injector at 5 cc/sec, followed by an injection of 20 ml of saline at 5 cc/sec. To minimize risk to the patients, we only acquired one plane per heart beat (either in a mid-ventricular short-axis or 2-chamber view). All perfusion scans were performed during shallow free-breathing for patient comfort.
Given these circumstances (MRI is considered off-label in patients with a non-MR-conditional device, 33% failure rate), our IRB approved this retrospective study, waived the need for informed consent, and provided access to the patient data. In addition, our retrospective study was found to comply with the Health Insurance Portability and Accountability Act (HIPPA). The retrospective review of our imaging database identified 16 consecutive patients (10 males, 6 females, mean age = 54.2 ± 17.7 years, age range = 18 to 76 years) in whom standard and wideband perfusion acquisitions were conducted. Fifteen patients had a transvenous CIED (pacemaker, ICD, or CRT) implanted on their left shoulder below the clavicle. One patient had a subcutaneous ICD (S-ICD) implanted on the left lateral rib. Table 1 summarizes the patient characteristics including device and disease types.
Table 1.
Patient characteristics including device and disease types. Age represents mean ± standard deviation, and values in parenthesis represent the percentage among 16 patients.
| Age | 54.2 ± 17.7 yrs | |
|---|---|---|
| Sex | Men | 10 (62.50%) |
| Women | 6 (37.50%) | |
| CIED | ICD | 11 (68.75%) |
| CRT-D* | 2 (12.50%) | |
| Pacemaker | 2 (12.50%) | |
| S-ICD** | 1 (6.25%) | |
| MR-conditional | 8 (50.00%) | |
| Heart Disease | Heart failure | 8 (50.00%) |
| Ventricular tachycardia | 6 (37.50%) | |
| Myocardial infarction | 5 (31.25%) | |
| Coronary artery disease | 4 (25.00%) | |
| Dilated cardiomyopathy | 3 (18.75%) | |
| Ischemic cardiomyopathy | 3 (18.75%) | |
| Atrial fibrillation/flutter | 3 (18.75%) | |
| Pericarditis | 2 (12.50%) | |
| Hypertrophic cardiomyopathy | 2 (12.50%) | |
| Takotsubo cardiomyopathy | 1 (6.25%) | |
| Heart transplant rejection | 1 (6.25%) | |
| Kawasaki disease | 1 (6.25%) | |
| Myocardial fibroma | 1 (6.25%) | |
| Pulmonary hypertension | 1 (6.25%) | |
| Mitral regurgitation | 1 (6.25%) |
CRT-D: cardiac resynchronization therapy with defibrillator
S-ICD: subcutaneous ICD.
Experiment 2: Prospective Study in a Phantom and Volunteer
As a secondary evaluation, after obtaining a written consent, we prospectively scanned a 40-year old male volunteer with and without a CRT-D (Viva S, Metronic, Minneapolis, Minnesota) taped on the subject’s left shoulder below the clavicle, approximately 5 cm away from the heart, to compare the image quality between wideband and standard perfusion scans using the same imaging parameters described above. Taping a CIED on a subject’s left shoulder is a plausible approach to mimic image artifacts induced by a CIED (14–16). For this experiment without contrast agent, we performed wideband and standard perfusion acquisitions in a basal short-axis plane. This prospective scan was performed in accordance with protocols approved by our IRB and was HIPAA compliant.
We also scanned an American College of Radiology approved phantom with and without a CRT-D attached to its side. Since the T1 of this phantom is short (T1 = 145 msec), we shortened the TS to 57 ms, while keeping all other parameters the same, to bring out the impact of image artifacts in a saturation recovery experiment. Specifically, TS was lowered by reducing the FOV in the phase-encoding direction to 145 mm and the matrix size to 192 × 77. The phantom experiment was performed near magnet isocenter after performing static magnetic field shimming to minimize the influence of static magnetic field and radio-frequency field inhomogeneities on the results.
Visual Assessment
One radiologist (JDC) with 12 years and one cardiologist (DCL) with 16 years of clinical experience in reading cardiovascular MRI, respectively, performed visual assessment of image artifacts. Given the back-to-back perfusion scans without adequate clearance of gadolinium and the challenge in identifying device artifacts, we paired the first and second perfusion scans per patient for dynamic display, where the first perfusion scan was always positioned on the left panel. Note, standard-wideband and wideband-standard tandems were randomized and de-identified for visual analysis. The two readers were given training datasets to calibrate their scores together, where a score of 3 is defined as clinically adequate. Following training, each reader was blinded to image acquisition type, the other reader, and clinical history and read the images independently. Each pair of perfusion images (standard vs. wideband) was graded on a 5-point Likert scale: artifact intensity (5: non-diagnostic; 4: severe; 3: moderate; 2: mild; 1: minimal) and artifact extent (5: 76–100%; 4: 51–75%; 3: 26–50%; 2: 1–25%; 1: 0%). For both artifact categories, we used the 17-segment American Heart Association model (25) to score them on a segmental basis (i.e., 6 and 7 segments for short- and long-axis imaging, respectively), and subsequently averaged the segments to compare across subjects with a mixture of short- and long-axis views. We also assigned a binary score for myocardial segments as having significant artifact if the artifact intensity score is greater than 3 and the artifact extent score is greater than 1. To compare between two pulse sequences, the two readers’ scores were averaged.
Myocardial Tissue Assessment
Another investigator (KH) performed a quantitative analysis as follows. At peak blood enhancement, prior to tissue enhancement, endocardial and epicardial contours were manually segmented to calculate myocardial signal intensity. The segmentation was performed conservatively to minimize partial volume averaging. The variance in myocardial signal intensity prior to tissue enhancement was recorded to measure artifact intensity. We elected to use variance over mean to account for the residual contrast agent in the second perfusion scan.
Statistical Analysis
A Kolmogorov-Smirnov test was performed to test the null hypothesis that each variable is normally distributed at the 5% significance level. A paired t-test was performed for normal distribution, whereas the Wilcoxon signed rank test was performed for non-normal distribution. Assuming normal distribution, a paired t-test was used to compare the mean whole-body SAR and myocardial signal variation between the standard and wideband perfusion scans. Assuming non-normal distribution, the Wilcoxon signed rank test was used to compare the mean reader scores between standard and wideband perfusion scans. A p < 0.05 was considered statistically significant for each statistical test. Normally distributed data were presented as mean ± standard deviation, whereas non-normally distributed data were presented as median and range.
Results
Experiment 1: Retrospective Study of Quality Control in Patients
While the mean whole-body SAR for a single-slice wideband perfusion scan (0.38 ± 0.08 W/kg) was significantly (p < 0.05) higher than that for a single-slice standard perfusion scan (0.11 ± 0.03 W/kg), it was 81% below the safe SAR limit of 2.0 W/kg. This implies that it is possible to perform wideband perfusion MRI with up to 5 slices per heart beat within 2.0 W/kg, which we verified to be the case in non-device patients at 1.5T. Figures 3 and 4 show two representative cases, where Figure 3 shows wideband as the first perfusion scan, and Figure 4 shows standard as the first perfusion scan (see corresponding Supporting Information Video S1 and S2 for dynamic display). In both instances, the wideband pulse sequence suppressed image artifacts induced by a CIED, whereas the standard sequence was sensitive to CIED and produced noticeable artifacts that obscured visualization of myocardial wall enhancement. Figure 5 shows a patient with an S-ICD, where a perfusion defect can be appreciated in both scans. For the standard perfusion scan, image artifacts were considerably high, and if the perfusion defect had coincided with the artifacts (e.g. anterior-lateral wall) then it would have been obscured. The perfusion defect is corroborated with the corresponding wideband LGE image. Figures 6 and 7 show images from the remaining 13 patients at peak blood enhancement, where wideband performed similar or better than standard in suppressing image artifacts.
Figure 3.
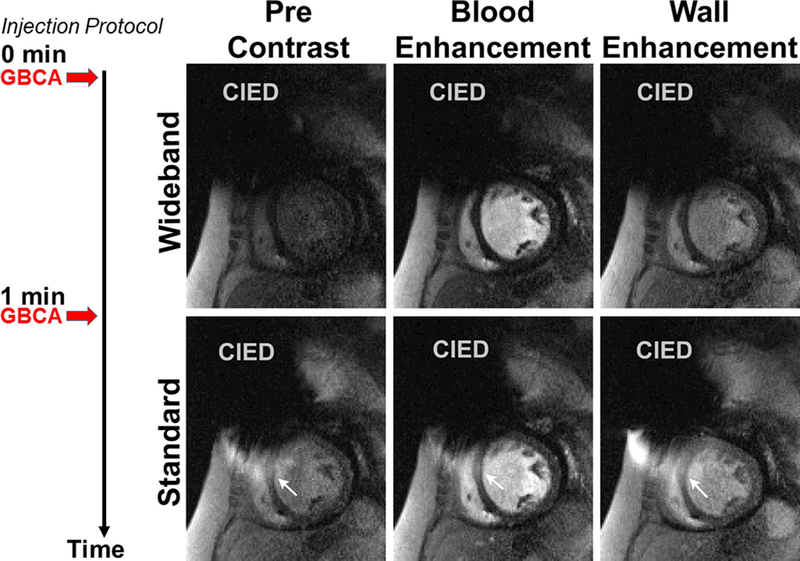
Representative perfusion image sets in a mid-ventricular short-axis plane where wideband perfusion scan was performed first (top row) and standard perfusion scan was performed second (bottom row): before contrast arrival (left column), at peak blood enhancement (middle column), and at peak myocardial wall enhancement (right column). White arrows point to image artifacts induced by a CIED. A timing diagram displays the injection protocol. GBCA: gadolinium-based contrast agent. See Supporting Information Video S1 for dynamic display.
Figure 4.
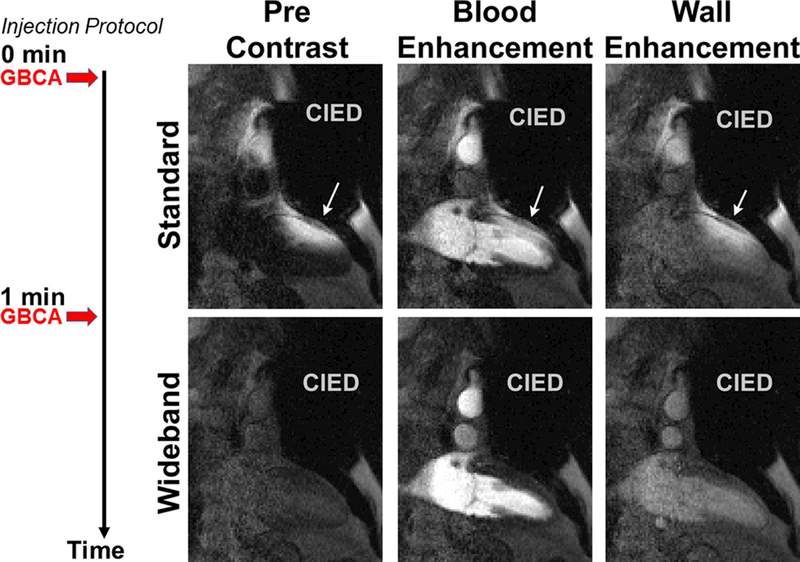
Representative perfusion image sets in a 2-chamber view where standard perfusion scan was performed first (top row) and wideband perfusion scan was performed second (bottom row): before contrast arrival (left column), at peak blood enhancement (middle column), and at peak myocardial wall enhancement (right column). White arrows point to image artifacts induced by a CIED. A timing diagram displays the injection protocol. GBCA: gadolinium-based contrast agent. See Supporting Information Video S2 for dynamic display.
Figure 5.
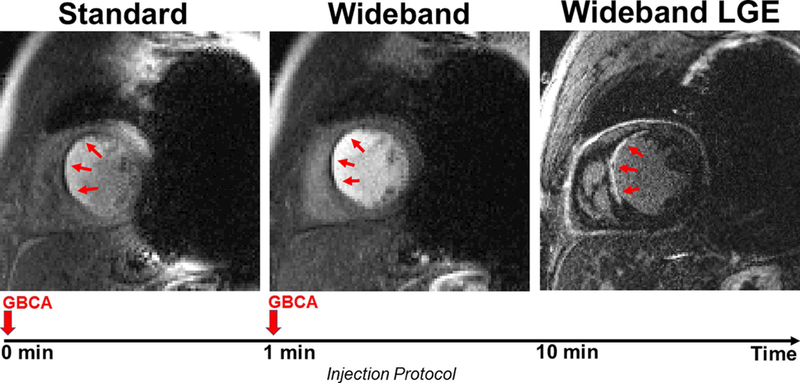
Example perfusion image sets in a short-axis view in which a perfusion defect is clearly visible. Standard perfusion scan was performed first (left) and shows considerable image artifacts. Wideband perfusion scan was performed second (middle) and shows minimal artifacts. The perfusion defect agrees with myocardial scar shown in wideband LGE (right). A timing diagram displays the injection protocol. GBCA: gadolinium-based contrast agent.
Figure 6.
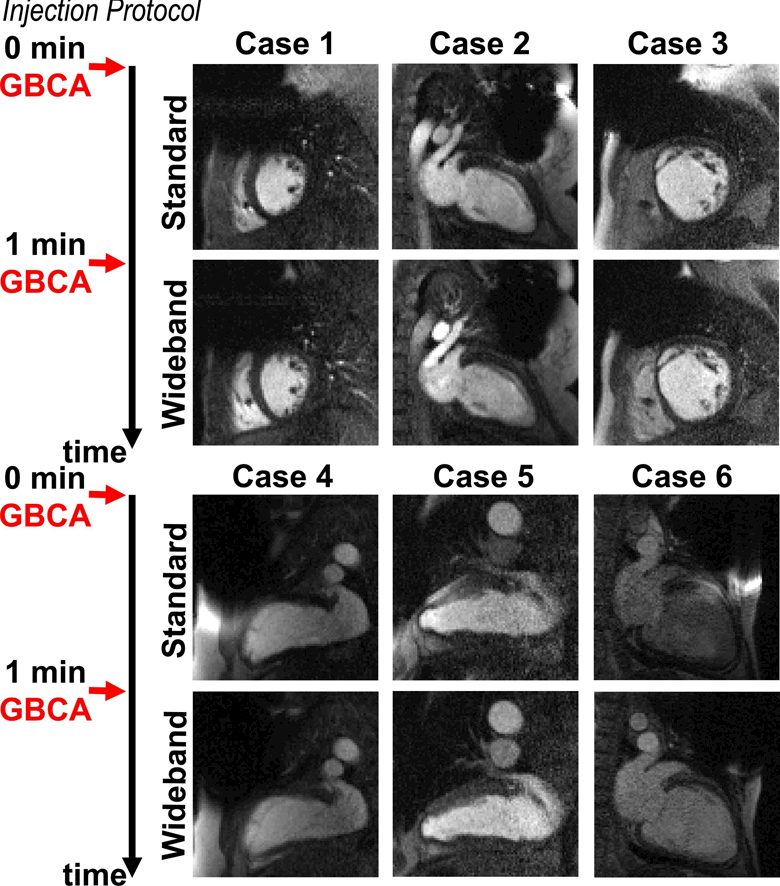
Perfusion image sets at peak blood enhancement, where standard was performed as the first injection scan in 6 patients not included in Figures 3–5. A timing diagram displays the injection protocol. GBCA: gadolinium-based contrast agent.
Figure 7.
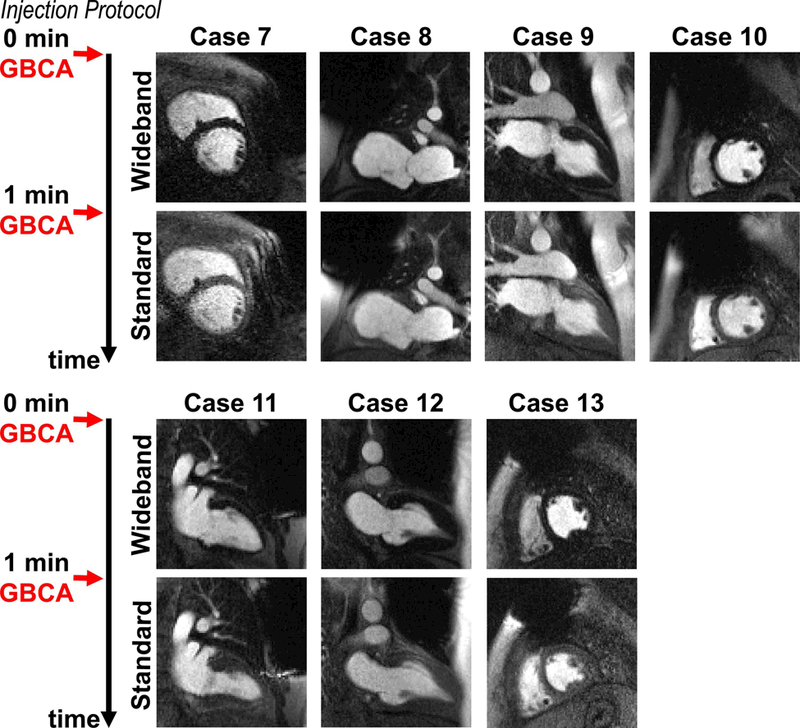
Perfusion image sets at peak blood enhancement, where wideband was performed as the first injection scan in 7 remaining patients not included in Figures 3–6. A timing diagram displays the injection protocol. GBCA: gadolinium-based contrast agent.
The median artifact intensity for wideband (1.1; range 1.0 – 1.8) was significantly (p < 0.01) lower than standard (1.8; range 1.0 – 2.9). The median artifact extent for wideband (1.2; range 1.0 – 1.9) was significantly (p < 0.01) lower than standard (1.6; range 1.0 – 2.3). Among 105 myocardial segments (9 long-axis and 7 short-axis planes), standard produced 19 segments (18%) that were deemed to have significant artifacts, whereas wideband produced only 3 segments (3%) that were deemed to have significant artifacts. The mean variance in myocardial signal intensity prior to tissue enhancement was significantly (p < 0.001) higher for standard (422.6 ± 306.6 a.u.) than wideband (107.0 ± 60.9 a.u.).
Experiment 2: Prospective Study in a Phantom and Volunteer
As shown in Figure 8, wideband and standard non-contrast images of a volunteer without a CIED show comparable image quality, confirming that wideband and standard saturation pulse modules perform similarly in the absence of a CIED. When a CRT-D was taped on the subject’s left shoulder, wideband was able to suppress image artifacts induced by a CRT-D, whereas standard saturation produced noticeable image artifacts inside the heart. Figure 9 shows the corresponding phantom images with and without a CRT-D taped to its side. Consistent with the volunteer results, wideband and standard perfusion scans produced comparable results without a CIED. But when a CRT-D was attached to its side, wideband suppressed image artifacts better than standard. Note, in both phantom and volunteer results, the presence of a CRT-D increased noise due to intravoxel dephasing caused by off-resonance.
Figure 8.
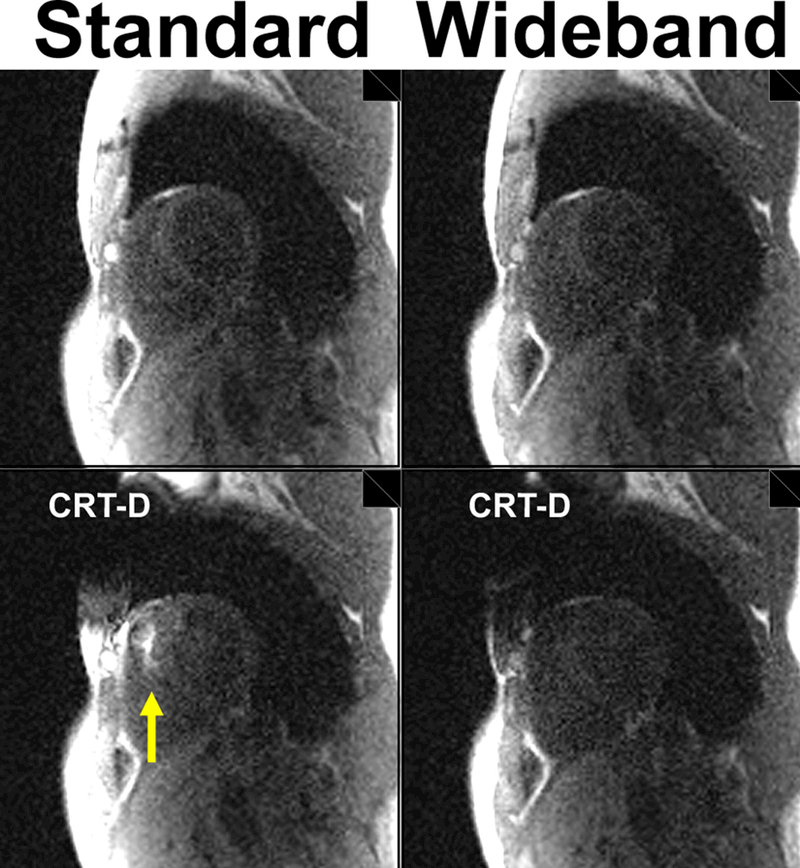
Non-contrast images of a volunteer in a basal short-axis plane acquired with standard (left column) and wideband (right column): without a device (top row) and with a CRT-D (bottom row). Yellow arrow points to image artifacts.
Figure 9.
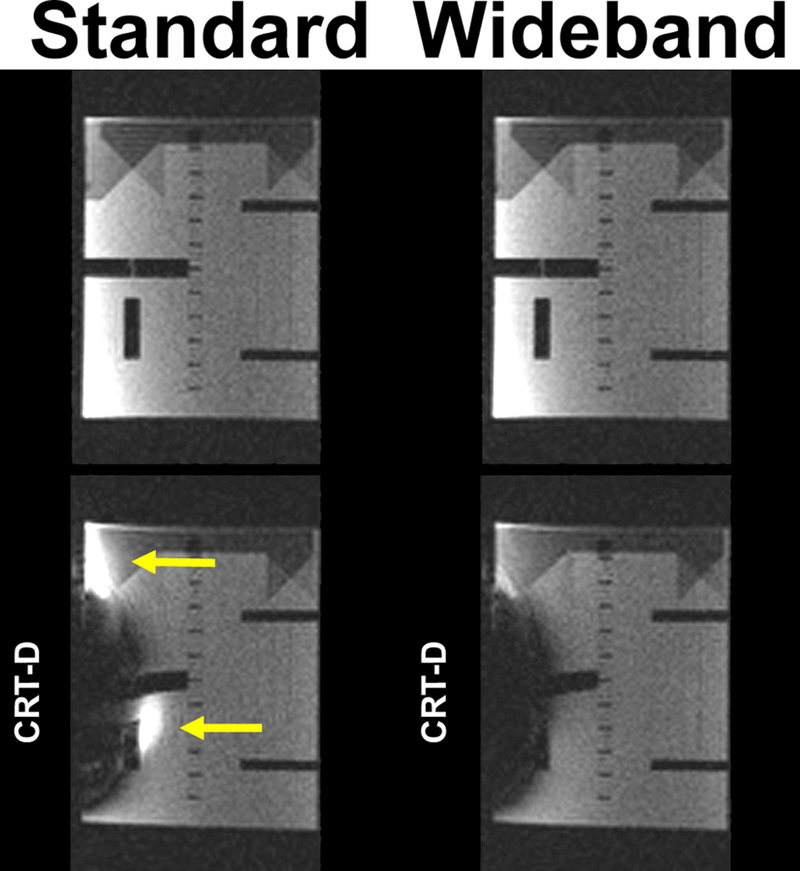
Images of an ACR phantom acquired with standard (left column) and wideband (right column): without a device (top row) and with a CRT-D (bottom row). Yellow arrows point to image artifacts.
Discussion
This study describes the development and evaluation of a wideband cardiac perfusion pulse sequence for imaging patients with a CIED. Compared with standard perfusion sequence, wideband perfusion sequence produced significantly less image artifacts in patients with a CIED, while not exceeding the safe SAR limit (2.0 W/kg). This study was conducted without any adverse event.
Compared with a standard saturation pulse module with 2.5 kHz bandwidth, a wideband pulse module (BISTRO) had 9.2 kHz bandwidth, but at the expense of increased SAR and pulse duration. A previous study reported that the center frequency offset in patients with a CIED ranges from 2–6 kHz (14). As such, a bandwidth of 9.2 kHz is more than sufficient to achieve effective saturation of magnetization in the presence of a CIED in patients. In the context of first-pass cardiac perfusion MRI, the additional 7 ms in pulse duration is negligible, considering that the saturation recovery + readout module is on the order of 150–200 ms, and the 6-fold increase in RF energy deposition does not preclude sampling 3–4 slices per heart beat (1.14 to 1.52 W/kg, respectively).
This study has several important implications worth discussing. The proposed wideband cardiac perfusion pulse sequence adds to existing cardiac wideband pulse sequences (e.g. LGE and T1 mapping) and may open new diagnostic opportunities for patients with a CIED. As a versatile modality, cardiac MRI has the capability to comprehensively assess function, perfusion, and scar in one session. Combining a wideband perfusion pulse sequence to existing wideband T1 mapping and LGE MRI pulse sequences and standard cine with gradient echo readout allows multiple metrics to be gathered by a single modality, as opposed to the conventional approach of ordering multiple cardiac imaging tests: 1) SPECT to rule out CAD, 2) echocardiography to assess cardiac function and valve disease, and 3) MRI to assess scar and treatable cardiomyopathy. This single modality approach is more patient friendly and potentially cost effective when considering the downstream clinical workflow, because it provides more accurate assessment of ventricular systolic function and regional wall motion, while enabling assessment of additional information including thoracic aortic disease, microvascular disease (6), and pericarditis (7) in patients presenting with chest pain. In addition, wideband perfusion MRI may be extended for calculation of myocardial blood flow (26), which will be useful for assessment of microvascular disease such as in women’s heart disease and diabetic heart disease. It is also worth considering that the size and location of image artifacts depend on the device type and implantation location relative to the heart. As shown in Figs 3–7, image artifacts intensity and location varied across patients (see Table 1). Another important consideration is the utility of wideband cardiac perfusion MRI at 3T as a means to achieve higher contrast-to-noise ratio than at 1.5T (27). This could be accomplished by modifying the BISTRO pulse module at the expense of increased B1, similar to how wideband LGE MRI was implemented at 3T (15). As of today, three vendors (Medtronic, Minneapolis, Minnesota; Biotronik, Berlin, Germany; Abbott, St. Paul, Minnesota) offers FDA-approved ICDs on the market. Because there are not enough data on MR safety in patients with a non-MR-conditional CIED at 3T, it remains unclear whether it is feasible to safely conduct wideband perfusion MRI at 3T in patients with a non-MR-conditional CIED. As safety issues get resolved, it may be worthwhile to explore the utility of wideband perfusion MRI at 3T in patients with a CIED.
This study has several limitations worth discussing. First, we elected to perform two resting perfusion scans back-to-back with zero time gap, since the primary motivation for conducting the quality control project was to determine the effectiveness of artifact suppression with wideband rather than identify a perfusion defect at rest. While a preferred gap between two perfusion scans during the same MRI session is at least 10 min, this would have considerably altered the clinical workflow, particularly the time from gadolinium administration to acquisition of clinical LGE MRI images. Consequently, the back-to-back acquisitions with zero time gap between them led to baseline enhancement in the second perfusion scan arising from the residual contrast agent. We minimized this effect on the head-to-head comparison by having our MR technologists randomize the pulse sequence order for each pair of wideband and standard pulse sequence acquisitions. Second, we elected to acquire only one slice per pulse sequence, in order to minimize risk to the patients, especially since the intent of this quality control investigation is to determine whether wideband perfusion MRI performs better than standard perfusion MRI in patients with a CIED. Third, we did not administer a vasodilator for this study. The wideband results from this study are likely to carry over to a stress perfusion study, since a vasodilator will not have any bearing on image artifacts induced by a CIED. Fourth, we did not perform visual analysis of perfusion defects, since most of the patients enrolled for this study were not known to have new onset of CAD. A future study is warranted to evaluate the clinical utility of wideband perfusion MRI in patients with a CIED and suspected CAD. Fifth, while a wideband saturation pulse is capable of saturating the magnetization, the presence of a CIED may induce signal loss due to intravoxel dephasing during gradient echo readout (see Figures 8 and 9). This could be compensated by shortening the TE, either by using a shorter excitation RF pulse, partial echo readout, and/or high receiver bandwidth. Additionally, the signal loss could be compensated by use of compressed sensing (28) or deep learning (29) as a denoising filter. Sixth, this study was conducted on a single 1.5T MRI scanner typically used to perform cardiac MRI on patients with CIEDs. The results from this study are likely to translate to other 1.5T MRI scanners provided that the BISTRO pulse module is implemented and calibrated as described. Additional work is warranted to evaluate the performance of wideband cardiac perfusion MRI across vendors and scanner types.
Conclusion
In summary, this study demonstrates that a wideband cardiac perfusion pulse sequence is capable of suppressing image artifacts in patients implanted with a CIED while not exceeding the safe SAR limit of 2.0 W/kg. Future work includes a study aimed at evaluating the clinical utility of wideband cardiac perfusion MRI for assessment of CAD in patients with a CIED.
Supplementary Material
Dynamic display of perfusion image sets shown in Figure 3.
Dynamic display of perfusion image sets shown in Figure 4.
Acknowledgement
The authors thank funding support from the National Institutes of Health (R01HL116895, R01HL138578, R21EB024315, R21AG055954).
Grant Support: This work was supported in part by funding from the National Institutes of Health (R01HL116895, R01HL138578, R21EB024315, R21AG055954)
References
- 1.Greenspon AJ, Patel JD, Lau E, Ochoa JA, Frisch DR, Ho RT, Pavri BB, Kurtz SM. Trends in permanent pacemaker implantation in the United States from 1993 to 2009: increasing complexity of patients and procedures. J Am Coll Cardiol 2012;60(16):1540–1545. [DOI] [PubMed] [Google Scholar]
- 2.Nazarian S, Hansford R, Roguin A, Goldsher D, Zviman MM, Lardo AC, Caffo BS, Frick KD, Kraut MA, Kamel IR, Calkins H, Berger RD, Bluemke DA, Halperin HR. A prospective evaluation of a protocol for magnetic resonance imaging of patients with implanted cardiac devices. Ann Intern Med 2011;155(7):415–424. [DOI] [PMC free article] [PubMed] [Google Scholar]
- 3.Wolk MJ, Bailey SR, Doherty JU, Douglas PS, Hendel RC, Kramer CM, Min JK, Patel MR, Rosenbaum L, Shaw LJ, Stainback RF, Allen JM. ACCF/AHA/ASE/ASNC/HFSA/HRS/SCAI/SCCT/SCMR/STS 2013 multimodality appropriate use criteria for the detection and risk assessment of stable ischemic heart disease: a report of the American College of Cardiology Foundation Appropriate Use Criteria Task Force, American Heart Association, American Society of Echocardiography, American Society of Nuclear Cardiology, Heart Failure Society of America, Heart Rhythm Society, Society for Cardiovascular Angiography and Interventions, Society of Cardiovascular Computed Tomography, Society for Cardiovascular Magnetic Resonance, and Society of Thoracic Surgeons. J Am Coll Cardiol 2014;63(4):380–406. [DOI] [PubMed] [Google Scholar]
- 4.Hamby RJ, Tabrah F, Gupta M. Intraventricular conduction disturbances and coronary artery disease. Clinical, hemodynamic and angiographic study. Am J Cardiol 1973;32(6):758–765. [DOI] [PubMed] [Google Scholar]
- 5.Greenwood JP, Maredia N, Radjenovic A, Brown JM, Nixon J, Farrin AJ, Dickinson C, Younger JF, Ridgway JP, Sculpher M, Ball SG, Plein S. Clinical evaluation of magnetic resonance imaging in coronary heart disease: the CE-MARC study. Trials 2009;10:62. [DOI] [PMC free article] [PubMed] [Google Scholar]
- 6.Heydari B, Juan YH, Liu H, Abbasi S, Shah R, Blankstein R, Steigner M, Jerosch-Herold M, Kwong RY. Stress Perfusion Cardiac Magnetic Resonance Imaging Effectively Risk Stratifies Diabetic Patients With Suspected Myocardial Ischemia. Circ Cardiovasc Imaging 2016;9(4):e004136. [DOI] [PMC free article] [PubMed] [Google Scholar]
- 7.Zurick AO, Bolen MA, Kwon DH, Tan CD, Popovic ZB, Rajeswaran J, Rodriguez ER, Flamm SD, Klein AL. Pericardial Delayed Hyperenhancement With CMR Imaging in Patients With Constrictive Pericarditis Undergoing Surgical Pericardiectomy: A Case Series With Histopathological Correlation. JACC: Cardiovascular Imaging 2011;4(11):1180–1191. [DOI] [PubMed] [Google Scholar]
- 8.Klein-Wiele O, Garmer M, Urbien R, Busch M, Kara K, Mateiescu S, Gronemeyer D, Schulte-Hermes M, Garbrecht M, Hailer B. Feasibility and safety of adenosine cardiovascular magnetic resonance in patients with MR conditional pacemaker systems at 1.5 Tesla. J Cardiovasc Magn Reson 2015;17:112. [DOI] [PMC free article] [PubMed] [Google Scholar]
- 9.Shellock FG. Cardiac pacemakers, implantable cardioverter defibrillators (ICDs), and cardiac monitors [http://www.mrisafety.com/SafetyInfov.asp?SafetyInfoID=167]. 2017.
- 10.Nazarian S, Hansford R, Rahsepar AA, Weltin V, McVeigh D, Gucuk Ipek E, Kwan A, Berger RD, Calkins H, Lardo AC, Kraut MA, Kamel IR, Zimmerman SL, Halperin HR. Safety of Magnetic Resonance Imaging in Patients with Cardiac Devices. N Engl J Med 2017;377(26):2555–2564. [DOI] [PMC free article] [PubMed] [Google Scholar]
- 11.Russo RJ, Costa HS, Silva PD, Anderson JL, Arshad A, Biederman RW, Boyle NG, Frabizzio JV, Birgersdotter-Green U, Higgins SL, Lampert R, Machado CE, Martin ET, Rivard AL, Rubenstein JC, Schaerf RH, Schwartz JD, Shah DJ, Tomassoni GF, Tominaga GT, Tonkin AE, Uretsky S, Wolff SD. Assessing the Risks Associated with MRI in Patients with a Pacemaker or Defibrillator. N Engl J Med 2017;376(8):755–764. [DOI] [PubMed] [Google Scholar]
- 12.Dandamudi S, Collins JD, Carr JC, Mongkolwat P, Rahsepar AA, Tomson TT, Verma N, Arora R, Chicos AB, Kim SS, Lin AC, Passman RS, Knight BP. The Safety of Cardiac and Thoracic Magnetic Resonance Imaging in Patients with Cardiac Implantable Electronic Devices. Acad Radiol 2016;23(12):1498–1505. [DOI] [PubMed] [Google Scholar]
- 13.Indik JH, Gimbel JR, Abe H, Alkmim-Teixeira R, Birgersdotter-Green U, Clarke GD, Dickfeld TL, Froelich JW, Grant J, Hayes DL, Heidbuchel H, Idriss SF, Kanal E, Lampert R, Machado CE, Mandrola JM, Nazarian S, Patton KK, Rozner MA, Russo RJ, Shen WK, Shinbane JS, Teo WS, Uribe W, Verma A, Wilkoff BL, Woodard PK. 2017 HRS expert consensus statement on magnetic resonance imaging and radiation exposure in patients with cardiovascular implantable electronic devices. Heart Rhythm 2017;14(7):e97–e153. [DOI] [PubMed] [Google Scholar]
- 14.Rashid S, Rapacchi S, Vaseghi M, Tung R, Shivkumar K, Finn JP, Hu P. Improved late gadolinium enhancement MR imaging for patients with implanted cardiac devices. Radiology 2014;270(1):269–274. [DOI] [PMC free article] [PubMed] [Google Scholar]
- 15.Ranjan R, McGann CJ, Jeong EK, Hong K, Kholmovski EG, Blauer J, Wilson BD, Marrouche NF, Kim D. Wideband late gadolinium enhanced magnetic resonance imaging for imaging myocardial scar without image artefacts induced by implantable cardioverter-defibrillator: a feasibility study at 3 T. Europace 2015;17(3):483–488. [DOI] [PMC free article] [PubMed] [Google Scholar]
- 16.Hong K, Jeong EK, Wall TS, Drakos SG, Kim D. Wideband arrhythmia-Insensitive-rapid (AIR) pulse sequence for cardiac T1 mapping without image artifacts induced by an implantable-cardioverter-defibrillator. Magn Reson Med 2015;74(2):336–345. [DOI] [PMC free article] [PubMed] [Google Scholar]
- 17.Shao J, Rashid S, Renella P, Nguyen KL, Hu P. Myocardial T1 mapping for patients with implanted cardiac devices using wideband inversion recovery spoiled gradient echo readout. Magn Reson Med 2017;77(4):1495–1504. [DOI] [PubMed] [Google Scholar]
- 18.Kim RJ, Wu E, Rafael A, Chen EL, Parker MA, Simonetti O, Klocke FJ, Bonow RO, Judd RM. The use of contrast-enhanced magnetic resonance imaging to identify reversible myocardial dysfunction. N Engl J Med 2000;343(20):1445–1453. [DOI] [PubMed] [Google Scholar]
- 19.Puntmann VO, Isted A, Hinojar R, Foote L, Carr-White G, Nagel E. T1 and T2 Mapping in Recognition of Early Cardiac Involvement in Systemic Sarcoidosis. Radiology 2017;285(1):63–72. [DOI] [PubMed] [Google Scholar]
- 20.Flett AS, Hayward MP, Ashworth MT, Hansen MS, Taylor AM, Elliott PM, McGregor C, Moon JC. Equilibrium contrast cardiovascular magnetic resonance for the measurement of diffuse myocardial fibrosis: preliminary validation in humans. Circulation 2010;122(2):138–144. [DOI] [PubMed] [Google Scholar]
- 21.Nazarian S, Roguin A, Zviman MM, Lardo AC, Dickfeld TL, Calkins H, Weiss RG, Berger RD, Bluemke DA, Halperin HR. Clinical utility and safety of a protocol for noncardiac and cardiac magnetic resonance imaging of patients with permanent pacemakers and implantable-cardioverter defibrillators at 1.5 tesla. Circulation 2006;114(12):1277–1284. [DOI] [PMC free article] [PubMed] [Google Scholar]
- 22.Luo Y, de Graaf RA, DelaBarre L, Tannus A, Garwood M. BISTRO: an outer-volume suppression method that tolerates RF field inhomogeneity. Magn Reson Med 2001;45(6):1095–1102. [DOI] [PubMed] [Google Scholar]
- 23.Kim D, Oesingmann N, McGorty K. Hybrid adiabatic-rectangular pulse train for effective saturation of magnetization within the whole heart at 3 T. Magn Reson Med 2009;62(6):1368–1378. [DOI] [PMC free article] [PubMed] [Google Scholar]
- 24.Breuer FA, Kellman P, Griswold MA, Jakob PM. Dynamic autocalibrated parallel imaging using temporal GRAPPA (TGRAPPA). Magn Reson Med 2005;53(4):981–985. [DOI] [PubMed] [Google Scholar]
- 25.Cerqueira MD. Standardized Myocardial Segmentation and Nomenclature for Tomographic Imaging of the Heart: A Statement for Healthcare Professionals From the Cardiac Imaging Committee of the Council on Clinical Cardiology of the American Heart Association. Circulation 2002;105(4):539–542. [DOI] [PubMed] [Google Scholar]
- 26.Hsu L-Y, Jacobs M, Benovoy M, Ta AD, Conn HM, Winkler S, Greve AM, Chen MY, Shanbhag SM, Bandettini WP, Arai AE. Diagnostic Performance of Fully Automated Pixel-Wise Quantitative Myocardial Perfusion Imaging by Cardiovascular Magnetic Resonance. JACC: Cardiovascular Imaging 2018;11(5):697–707. [DOI] [PMC free article] [PubMed] [Google Scholar]
- 27.Araoz PA, Glockner JF, McGee KP, Potter DD Jr., Valeti VU, Stanley DW, Christian TF. 3 Tesla MR imaging provides improved contrast in first-pass myocardial perfusion imaging over a range of gadolinium doses. J Cardiovasc Magn Reson 2005;7(3):559–564. [DOI] [PubMed] [Google Scholar]
- 28.Jin J, Yang B, Liang K, Wang X. General image denoising framework based on compressive sensing theory. Computers & Graphics 2014;38:382–391. [Google Scholar]
- 29.Benou A, Veksler R, Friedman A, Riklin Raviv T. Ensemble of expert deep neural networks for spatio-temporal denoising of contrast-enhanced MRI sequences. Med Image Anal 2017;42:145–159. [DOI] [PubMed] [Google Scholar]
Associated Data
This section collects any data citations, data availability statements, or supplementary materials included in this article.
Supplementary Materials
Dynamic display of perfusion image sets shown in Figure 3.
Dynamic display of perfusion image sets shown in Figure 4.


