Abstract
Recent research has shown that contrast enhanced diagnostic ultrasound (CEDUS) has a potential to induce localized injury in liver, with clearly observable effects for contrast agent doses higher than the recommended dose, and maximal Mechanical Index values. This study was undertaken to assess effects with intermittent exposure at lower contrast doses of infusion and at reduced output to determine thresholds. In addition, microbubble (MB) suspensions with enhanced content of larger MBs were tested. Exposure from a phased array probe (GE Vivid 7 Dimension, GE Vingmed Ultrasound, Horten, Norway) was applied at 1.6 MHz and 1 s intermittent frame trigger for 10 min with infusion of MB suspension with normal (1.8 μm), medium (3.1 μm) and large (5.3 μm) mean MB diameters. The bioeffect endpoint was the count of hepatocytes stained with Evans blue dye in frozen sections. For the normal MBs, the count increased for clinically relevant infusion dosages, but leveled off above 20 μL/kg/min. The evidence of injury declined with time from 30 min, to 4 hr and was lacking at 24 hr. The exposure thresholds in terms of peak rarefactional pressure amplitude, divided by the square root of frequency (in situ Mechanical Index) were 1.7, 1.3 and 1.2 for the normal, medium and large sized MB suspensions. The enhanced efficacy for larger MBs lends support to the two-criterion model for cavitational microvascular injury during CEDUS. Overall, CEDUS in liver appears to have markedly less potential for induction of tissue injury than has been reported in other tissues, which indicates a satisfactory safety profile for CEDUS using recommended parameters in normal liver.
Keywords: diagnostic ultrasound adverse effects, ultrasonic cavitation, liver ultrasound imaging, contrast enhanced diagnostic ultrasound
INTRODUCTION
Ultrasound contrast agents are suspensions of stabilized microbubbles (MBs), which are small enough to circulate with the blood and coincidentally of an optimal size to provide strong interaction and echoes with diagnostic ultrasound pulses (Piscaglia et al. 2012). For example, Definity® (perflutren lipid microsphere injectable suspension, Lantheus Medical Imaging, Inc., N. Billerica, MA USA) is a suspension of MBs with a lipid skin, containing up to 1.2×10¹⁰ MBs per mL and a mean diameter range of 1.1 – 3.3 μm. Contrast enhanced diagnostic ultrasound (CEDUS) has been used clinically for many years to enhance the images of the heart and the vasculature in other organs. The liver also can be a good subject for CEDUS and is valuable, for example, for the evaluation of incidental findings of focal liver masses (Claudon et al. 2013; D’Onofrio et al. 2015; Jang et al. 2015; Chiorean et al. 2015).
The MBs can also serve as cavitation nuclei for diagnostic ultrasound pulses, thus introducing the well-known cavitation mechanism for biological effects into the assessment of clinical safety (Miller et al. 2008). Clearly demonstrable bioeffects are produced in the microvasculature including local mechanical injury to endothelial cells, capillary leakage, petechial hemorrhage and injury to adjacent parenchymal cells at the highest pulse peak rarefactional pressure amplitudes (PRPAs). The resulting microlesions can then elicit fibrin formation and inflammatory responses. This safety issue should be addressed for examinations in different organs to assure the performance of CEDUS with minimal risk of cavitation-induced patient injury.
Microvascular injury and microlesions have been extensively studied in heart and kidney, which are common subjects of CEDUS (Miller et al. 2008). The potential for liver injury has received relatively little study. Shigeta et al. (2004, 2005) studied possible bioeffects in rat liver scanned using an Acuson Sequoia 512 diagnostic ultrasound machine at 8–12 MHz. Levovist (air filled MBs with palmitic acid stabilization, Schering AG) and DD-723 (later named Sonazoid, perfluorobutane filled with phosphatidyl serine stabilization, Daiichi Sankyo Co.) were investigated using histology in light and electron microscopy. Endothelial injury and platelet aggregates were found in exposed rat livers with vacuolization in hepatocytes; however, the effects were minimal at the relatively high ultrasonic frequencies which are not optimal for cavitational bioeffects. Yang et al (2012) utilized a GE Vivid 7 Dimension ultrasound machine with S4 transducer at 1.5 MHz to evaluate potential liver injury from CEDUS. The cavitation of the MBs causes MB destruction, and can be used to produce desired bioeffects, for example, gene delivery to liver cells. The contrast agent Zhifuxian, similar to Definity, was used at a high 500 μL/kg bolus dose (Liu et al. 2011). Evans blue dye was used as a tracer for capillary leakage, and the liver enzymes alanine aminotransferase (ALT) and aspartate aminotransferase (AST) were measured in serum samples as a measure of liver injury. The CEDUS groups had Evans blue extravasation into the parenchyma, and AST and ALT were elevated at 0.5 hr post exposure, returning to normal after 24 hr. Overall, the results indicated that CEDUS increased capillary and cell membrane permeability with some hepatic injury.
We initiated research to evaluate potential liver injury for comparison to our work with CEDUS in heart and kidney. The report by Yang et al. (2012) was used to guide parts of our research study of CEDUS in liver. Contact and standoff (to place the focal zone at the liver) scanning was performed for 10 min with a GE Vivid 7 ultrasound machine and the 3S phased array at 1.6 MHz and maximal output. Bolus injection or infusion of contrast agent was delivered at relatively high doses of 500 μL/kg and 50 μL/kg/min, respectively. Serum liver enzyme measurements after 30 min detected liver injury and formamide extraction of Evans blue dye was used to detect microvascular leakage. These results, which will be published separately, qualitatively confirmed the report by Yang et al. (2012), and additionally demonstrated hepatocyte vital staining by Evans blue. This present study was undertaken to explore the contrast agent doseresponse for clinically-relevant infusion doses and to determine the exposure-response and the threshold for hepatocyte staining.
MATERIALS AND METHODS
Animal preparation
This in vivo research was conducted with the approval of the Institutional Animal Care and Use Committee at the University of Michigan. Male rats (Sprague Dawley, Charles River Laboratories, Wilmington MA) with a mean weight of 312 ± 34 g were used in this study, as detailed below. The rats were anesthetized via intraperitoneal injection of 40 mg/kg pentobarbital. The abdomen was shaved and depilated to maximize ultrasound transmission into the liver. For intravenous injections, including contrast MB suspensions, a 24 gauge cannula was inserted into a tail vein. Each rat received a 50 mg/kg dose of Evans blue in saline. Rats were placed in the dorsal decubitus position on a warming pad and ultrasound transmission gel was applied to the abdomen over the liver. A pulse-oximeter was not used to monitor the rats because the IV Evans blue dye confounded the device.
Diagnostic Ultrasound
A 3S phased array probe (GE Vivid 7 Dimension, GE Vingmed Ultrasound, Horten, Norway) was used in Octave mode at 1.6 MHz to scan/expose the right medial lobe of the liver in a transverse plane. The ultrasound probe was aimed downward through a small waterbath (rather than contacting the abdominal wall) with a thin transmission window, which allowed a standoff position to place the focal zone within the liver lobe (as would occur for human scanning). The center of the lobe was at 3.8 cm depth (on screen) with an 8 cm image depth and a 5 cm single focus setting. The scan pulse repetition frequency was 4.1 kHz and the frame rate was 56.3 fps, although the scans were individually triggered. The ECG dual trigger function was used with a 10 s intermittent trigger, and 100 ms dual scan interval. Exposures were at output power settings of 0 dB (the maximum setting), −2 dB and −4 dB and were 10 min in duration. The intermittent triggering allowed refill of the tissue with contrast agent, and the dual images displayed a reduction of contrast enhancement in the second relative to the first image due to contrast MB destruction.
The pulse-pressure waveforms were measured in a water bath using a calibrated hydrophone with 0.2 mm sensitive spot (HGL0200, Onda, Sunnyvale, CA, USA). The waveforms were measured at the 3.8 cm depth in the image, and peak rarefactional pressure amplitudes (PRPAs) were −2.7, −2.2, and −1.7 MPa for output settings of 0, −2 and −4 dB. The equivalent in situ Mechanical Index values, calculated as the PRPA divided by the square root of 1.6 MHz were 2.1, 1.7 and 1.4 for output settings of 0, −2 and −4 dB. In vivo, the path included attenuation by the abdominal wall, but this was negligible at less than 0.5 dB for the 2.3 ± 0.1 mm thickness on the abdominal wall measured in DUS images. Some attenuation due to the presence of MBs likely was also present for the higher MB doses, in addition to the tissue attenuation, but this was not determinable by the normal calibration methods.
Ultrasound Contrast Agent
Definity® (perflutren lipid microsphere injectable suspension, Lantheus Medical Imaging, Inc., N. Billerica, MA USA) is no longer sold for research purposes. A replacement contrast agent (RCA) for Definity was created, as described previously (Miller et al. 2015). Briefly, the lipid mixture was sterilized and aliquoted into empty sterile vials, similar to Definity vials, with the headspace filled with octafluoropropane (HC-218, PurityPlus, Metro Welding Supply, Detroit MI USA). The vials were shaken for 45 s in a VialMix (DuPont Pharmaceuticals Co., Billerica MA USA) before use to produce the suspensions of stabilized MBs. The RCA MBs were assessed using a Coulter counter (Multisizer 4, Beckman Coulter, Inc., Indianapolis IN USA) (Miller et al. 2015). The normal RCA product had a mean diameter of 1.8 ± 0.11 μm. The large sinusoid capillaries of the liver may be affected more by larger than by smaller sizes of MBs, as found for CEDUS effects in kidney (Church and Miller 2016; Miller et al. 2018). Two different MB suspensions were created to test the relative efficacy of medium and large MBs. The normal product was modified to provide suspensions of larger MBs by the centrifugation method, described previously (Feshitan et al 2009, Miller et al. 2018). Twelve to fifteen vials were shaken to provide 18 ml of the normal RCA suspension. The suspension was centrifuged at a relative centrifugal force (RCF) of 40 for 30s and the upper MB “cake” with larger bubbles was discarded to remove very large bubbles. The infranatant was then centrifuged at 60 RCF for 1 min, the cake collected, and resuspended. This was repeated 5 times to remove smaller MBs in the infranatants: the final suspension was the large MB suspension with a mean diameter of 5.3 ± 0.4 μm. The collected infranatants were then processed similarly with one centrifugation at 100 RCF to remove the largest MBs, followed by 3 centrifuge plus resuspension steps at 140 RCF for 1 min to produce the medium MB suspension with a mean diameter of 3.1 ± 0.3 μm. This process provided three well defined suspensions with sizes of normal, medium and large MBs.
Measured Endpoints
The primary endpoint was counts of Evans blue stained cells in frozen sections. After euthanasia, heparin saline was perfused through the left ventricle at 20 ml/min for 15 min. The medial lobe was then isolated and photographed to reveal the band of blue stained cells across the lobe corresponding to the ultrasound scan plane, as shown in Figure 1. The lobe was then cut in half to cross section the scan plane at the point of maximal visible effect and frozen on dry ice for frozen microscope sections. For some samples, one half was frozen and the other half was fixed in neutral buffered formalin for paraffin imbedding and histological slides. Frozen sections were made at three different places, 1.5 mm apart, across the scan plane. The sections were scored blind for redfluorescent stained cells clearly differentiated from the background fluorescence, as shown in Figure 1. For each frozen section, fluorescence microscopy with 10x objective was used to count the Evans blue stained cells by red fluorescence in 5 fields of view, which where 1.5 mm squares, positioned progressively across the lobe (anterior to posterior) to assess the variation of the counts with depth into the tissue. One set of results was excluded from the data due to an apparent scoring error which did not show a decrease in score with depth. For each slide, the fluorescent cells were also observed at a position about 1 cm away from the scan plane to gauge the background fluorescence and the level of fluorescence of stained cells (the overall fluorescence was variable sample-to-sample due to variations perfusion clearance) and to confirm that few or no stained cells were present in the un-scanned region.
Figure 1.
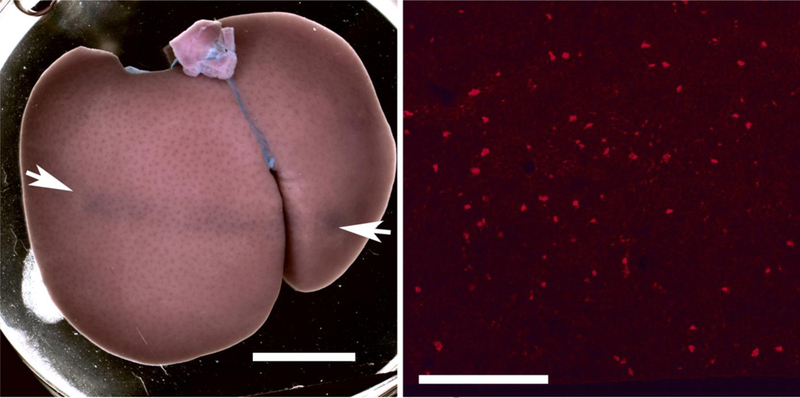
A macroscopic image of a liver lobe scanned at the 0 dB setting with 10 μl/kg/min normal microbubble infusion (left, scale 1 cm) and a fluorescence micrograph of a frozen section from the same liver (right, scale 0.5 mm). The arrows indicate the position of the scan plane and band of Evans blue stained cells on the liver lobe. The fluorescence image shows the stained cells as scattered bright red spots.
Experimental Plan
The study consisted of 3 experiments. First a MB dose-response experiment was conducted at 0 dB with the normal RCA at a range of doses from 50 μl/kg/min, 20 μl/kg/min, 10 μl/kg/min and 5 μl/kg/min, which approximated the clinical dose for CEDUS. A sham group was included with 10 min of scanning followed by 10 min of 50 μl/kg/min RCA infusion. All other tests utilized 10 μl/kg/min, for which the RCA suspensions all were adjusted to a concentration of 6×10⁷ MBs/mL for infusion. Second, a euthanasia delay experiment, was performed at 0 dB with euthanasia at 30 min (as reported in Yang et al. (2012)), 4 hr and 24 hr. Sham groups also were included for 4 hr and 24 hr. Paraffin histology was prepared for the different delay times to assess possible inflammatory responses or ongoing necrosis leading to microlesions. Third, an exposure-response experiment was performed for each MB size to estimate the exposure thresholds for the observed effects. Scans were performed at 0 dB, −2 dB and −4B, and sham. The shams utilized DUS exposure followed by MB infusion.
Six rats used were used for all test groups, except groups of 7 were used for the 5, 10 and 50 μl/kg/min dose tests, and for the 24 hr tests. Results were evaluated by comparisons of two means of measurements in different groups of rats. Statistical analysis was performed using SigmaPlot for Windows V. 11.0 (Systat Software Inc., San Jose CA, USA). The Mann-Whitney Rank Sum test and the Student t-test were used for the comparisons of unrelated samples, while paired tests were used for comparing before-and-after tests. Statistical significance was assumed at p<0.05.
RESULTS
For the contrast dose experiment, the total stained cell score, which was statistically significant for all points (p<0.05), increased with dose for low doses, but then changed little for higher doses, as shown in Fig. 2. Estimating from histological slides, a total score of 200 represents roughly 0.1% of cells in the field of view; and 400 represents roughly 0.2%. This saturation phenomenon likely reflects the shadowing and attenuation for the higher doses noted above. The counts for the separate fields of view at the five depth positions are plotted in Fig. 3. The counts declined with tissue depth for all doses. The slope of the decrease was about the same for the higher doses (−14.9 to −17.8 ct/mm, but less for the low 5 μl/kg/min dose (−10.4 ct/mm).
Figure 2.
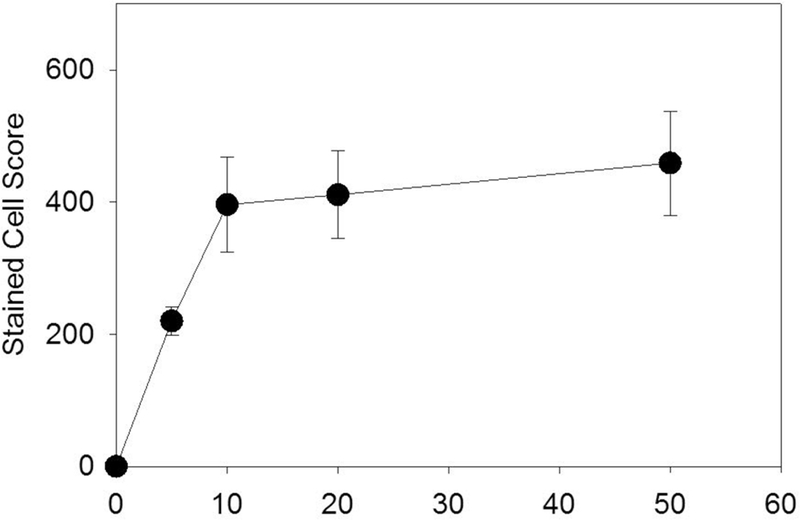
The dependence of the stained hepatocyte score on the infusion dosage of the normal suspension. Following an increase for the diagnostically useful range, the magnitude of the effect levels off for higher doses.
Figure 3.
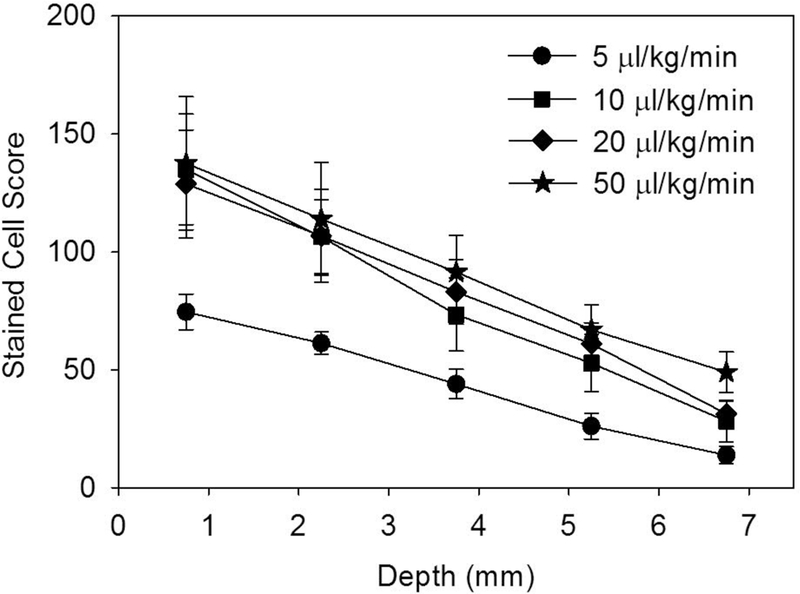
The stained cell score in 1.5 mm square regions decreases with depth into the tissue for all of the infusion dosages tested.
The experiment with delayed euthanasia was designed to follow the resolution of the stained-cell effect. The results for the stained cell counts are shown in Fig. 4. The counts within the exposure scan plane were compared to the counts outside the exposed region. The exposure counts were significantly greater than the very low counts outside the scan plane for the 30 min delay (p<0.001) and 4 hr delay (p<0.002) but not for the 24 hr delay. This shows that the Evans blue stained-cell effect resolves within one day. The exposure response results are shown in Fig. 5. The score increased strongly above a threshold for each MB size. The scores at −4 dB were statistically significantly different from shams for the medium and large MB, but not for the normal suspension.Results for the zero crossing thresholds are listed in Table 1. The excellent r2 values in Table 1 are for regressions on the means; however, the results for the medium and large MBs were more variable than for the normal MBs. Regression on all the data points gave r2 values of 0.60, 0.48 and 0.36 for the normal, medium and large MBs, respectively. None of the means for the medium and large MBs at each exposure were significantly different from each other. The thresholds for the medium and large MBs were relatively low, while the normal MBs had the highest threshold. There was no clear difference in the decline of cell counts with depth, see Fig. 6.
Figure 4.
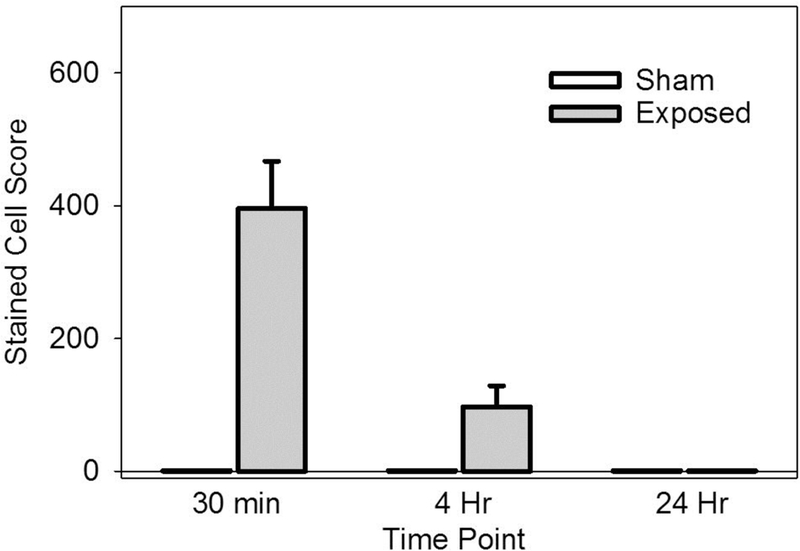
The stained cell score decreased with time and was not statistically significant at 24 hr.
Figure 5.
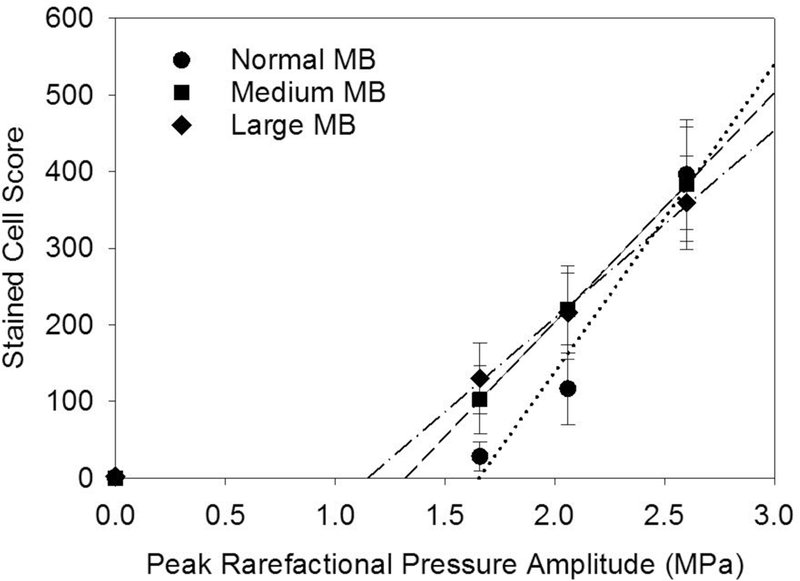
Plots of the stained cell scores for different peak rarefactional pressure amplitudes for normal, medium and large MB size suspensions. The thresholds (zero crossing) are lower for the larger sizes of MBs than for the normal suspensions (see Table 1).
Table 1.
Results for the determination of thresholds for hepatocyte injury by linear regression on the means. The quantity MPa/f½ is the estimated equivalent in situ Mechanical Index.
| MB Diameter | Intercept | Slope | Threshold | Threshold | ||
|---|---|---|---|---|---|---|
| Suspension | μm | count | count/MPa | r2 | MPa | MPa/f½ |
| Normal | 1.8 ± 0.11 | −666 | 402 | 0.96 | 1.7 | 1.3 |
| Medium | 3.1 ± 0.3 | −395 | 299 | 0.99 | 1.3 | 1.0 |
| Large | 5.3 ± 0.4 | −281 | 245 | 0.99 | 1.2 | 0.9 |
Figure 6.
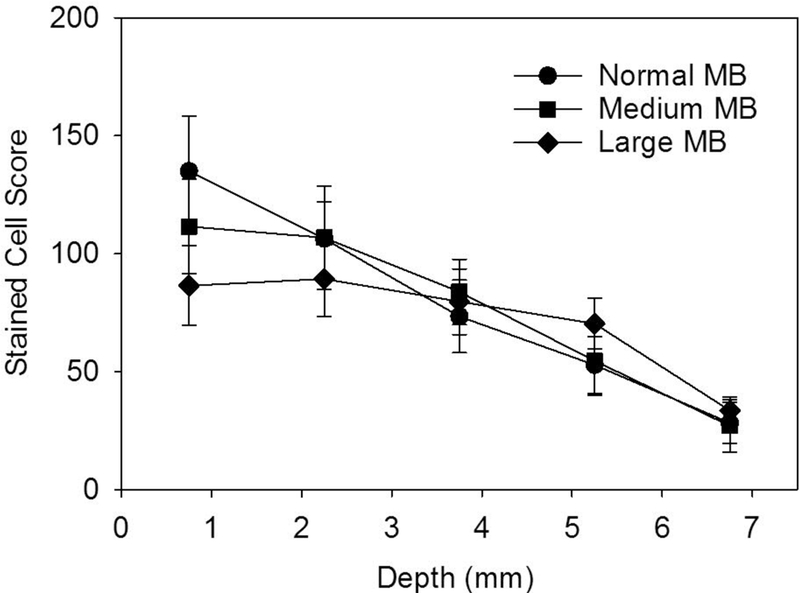
The variation of the stained cell score with depth for the different MB-size suspensions, which are all very nearly the same.
DISCUSSION
CEDUS has a potential for induction of localized biological effects, by the cavitation mechanism of action. Reported effects in heart and kidney include microvascular leakage, petechial hemorrhage and lethal injury of parenchymal cells at the highest pulse pressure amplitudes, which lead to necrotic microlesions. Liver is a common subject of CEDUS examination, providing diagnostically useful information. Very little research on CEDUS bioeffects has been reported for liver. In this study, the previously established bioeffects in liver (Yang et al. 2012) were expanded to determine the influence of contrast dose, to follow the resolution of hepatocyte injury, and to determine exposure response trends for normal sized and two larger sizes of MB suspensions.
The results show three clear findings. First, increasing microbubble dose increased the bioeffect for low, clinically relevant doses, but the increase leveled off for higher doses, see Fig. 2. That is, the very high doses for the Yang et al. (2012) study and our initial study (50 μl/kg/min) are not needed for significant effects, which occur at clinically relevant (5 μl/kg/min) doses. Second, the occurrence of stained cells was detectable at 30 min and 4 hr, but not for 24 hr post exposure, see Fig. 4. This is a markedly different impact than found in heart (Miller et al. 2005a; 2005b, 2007), and kidney (Miller et al. 2009), for which killing of cardiomyocytes or glomerular hemorrhage and tubular obstruction led to significant necrosis and inflammation after 24 hr. In histology, scattered indications of injury were seen, but there were no apparent “microlesions” as seen in the other tissues. Third, thresholds for hepatocyte injury were within the diagnostic ultrasound range, see Table 1. In terms of the in situ Mechanical Index, the threshold was 1.3 for the normal MBs (compared to the regulated upper limit for diagnostic ultrasound of 1.9). However, the package insert for Definity recommends that the Mechanical Index be set to 0.8 or below, which would mitigate the potential for these observed bioeffects. The threshold in situ MIs were 1.04 and 0.91 for the medium and small MBs, respectively. These were less than the threshold for the small, normal MBs which further supports the two-criterion model for contrast agent microvascular effects (Church and Miller, 2016; Miller et al. 2018).
The threshold for induction of hepatocyte injury was within the diagnostic range,indicating that there is a potential for induction of such injury by clinical CEDUS. The quantity of injured hepatocytes was small: given the exceptional cell turnover and replacement ability of the liver (a loss of 75 % of cells can be replaced in 1 week), the amount of injury would be inconsequential (Duncan et al. 2009). However, even this potential would be eliminated by following the recommendations in the package insert for Definity. The effect was not evident after 24 hr and there was no apparent microlesion production with inflammation. Overall, the results indicate a satisfactory safety profile for CEDUS in normal liver when the recommendations in the package insert are followed.
ACKNOWLEDGMENT
This work was supported by PHS grant HL110990 awarded by the United States National Heart Lung and Blood Institute, DHHS. The information contained herein does not necessarily reflect the position or policy of the US government, and no official endorsement should be inferred.
Footnotes
Publisher's Disclaimer: This is a PDF file of an unedited manuscript that has been accepted for publication. As a service to our customers we are providing this early version of the manuscript. The manuscript will undergo copyediting, typesetting, and review of the resulting proof before it is published in its final citable form. Please note that during the production process errors may be discovered which could affect the content, and all legal disclaimers that apply to the journal pertain.
REFERENCES
- Chiorean L, Cantisani V, Jenssen C, Sidhu PS, Baum U, Dietrich CF. Focal masses in a non-cirrhotic liver: The additional benefit of CEUS over baseline imaging. Eur J Radiol. 2015;84:1636–43. [DOI] [PubMed] [Google Scholar]
- Church CC, Miller DL. A Two-Criterion Model for Microvascular Bio-Effects Induced In Vivo by Contrast Microbubbles Exposed to Medical Ultrasound. Ultrasound Med Biol. 2016;42:1385–98. [DOI] [PMC free article] [PubMed] [Google Scholar]
- Claudon M, Dietrich CF, Choi BI, Cosgrove DO, Kudo M, Nolsøe CP, Piscaglia F, Wilson SR, Barr RG, Chammas MC, Chaubal NG, Chen MH, Clevert DA, Correas JM, Ding H, Forsberg F, Fowlkes JB, Gibson RN, Goldberg BB, Lassau N, Leen EL, Mattrey RF, Moriyasu F, Solbiati L, Weskott HP, Xu HX; World Federation for Ultrasound in Medicine; European Federation of Societies for Ultrasound. Guidelines and good clinical practice recommendations for Contrast Enhanced Ultrasound (CEUS) in the liver - update 2012: A WFUMB-EFSUMB initiative in cooperation with representatives of AFSUMB, AIUM, ASUM, FLAUS and ICUS. Ultrasound Med Biol. 2013;39:187–210. [DOI] [PubMed] [Google Scholar]
- D’Onofrio M, Crosara S, De Robertis R, Canestrini S, Mucelli RP. Contrast-Enhanced Ultrasound of Focal Liver Lesions. AJR Am J Roentgenol. 2015;205:W56–66. [DOI] [PubMed] [Google Scholar]
- Duncan AW, Dorrell C, Grompe M. Stem cells and liver regeneration. Gastroenterology. 2009;137:466–81. [DOI] [PMC free article] [PubMed] [Google Scholar]
- Feshitan JA, Chen CC, Kwan JJ, Borden MA. Microbubble size isolation by differential centrifugation. J Colloid Interface Sci. 2009; 329:316–24. [DOI] [PubMed] [Google Scholar]
- Jang HJ, Kim TK, Burns PN, Wilson SR. CEUS: An essential component in a multimodality approach to small nodules in patients at high-risk for hepatocellular carcinoma. Eur J Radiol. 2015;84:1623–35. [DOI] [PubMed] [Google Scholar]
- Liu P, Wang X, Zhou S, Hua X, Liu Z, Gao Y. Effects of a novel ultrasound contrast agent with long persistence on right ventricular pressure: Comparison with SonoVue. Ultrasonics. 2011;51:210–214. [DOI] [PubMed] [Google Scholar]
- Miller DL, Li P, Dou C, Gordon D, Edwards CA, Armstrong WF. Influence of contrast agent dose and ultrasound exposure on cardiomyocyte injury induced by myocardial contrast echocardiography in rats. Radiology. 2005a;237:137–43. [DOI] [PubMed] [Google Scholar]
- Miller DL, Li P, Gordon D, Armstrong WF Histological characterization of microlesions induced by myocardial contrast echocardiography. Echocardiography 2005b; 22:25–34. [DOI] [PubMed] [Google Scholar]
- Miller DL, Li P, Dou C, Armstrong WF, Gordon D. Evans blue staining of cardiomyocytes induced by myocardial contrast echocardiography in rats: evidence for necrosis instead of apoptosis. Ultrasound Med Biol. 2007;33:1988–1996. [DOI] [PMC free article] [PubMed] [Google Scholar]
- Miller DL, Averkiou MA, Brayman AA, Everbach EC, Holland CK, Wible JH Jr, Wu J. Bioeffects considerations for diagnostic ultrasound contrast agents. J Ultrasound Med. 2008;27:611–632. [DOI] [PubMed] [Google Scholar]
- Miller DL, Dou C, Wiggins RC. Glomerular capillary hemorrhage induced in rats by diagnostic ultrasound with gas-body contrast agent produces intratubular obstruction. Ultrasound Med Biol. 2009;35:869–77. [DOI] [PMC free article] [PubMed] [Google Scholar]
- Miller DL, Dou C, Lu X, Zhu YI, Fabiilli ML, Owens GE, Kripfgans OD. The use of theranostic strategies in myocardial cavitation-enabled therapy. Ultrasound Med Biol. 2015;41:1865–75. [DOI] [PMC free article] [PubMed] [Google Scholar]
- Miller DL, Lu X, Dou C, Fabiilli ML, Church CC. The Dependence of Glomerular Capillary Hemorrhage Induced by Contrast Enhanced Diagnostic Ultrasound on Microbubble Diameter. Ultrasound Med Biol. 2018;44:613–621. [DOI] [PMC free article] [PubMed] [Google Scholar]
- Piscaglia F, Nolsøe C, Dietrich CF, Cosgrove DO, Gilja OH, Bachmann Nielsen M, Albrecht T, Barozzi L, Bertolotto M, Catalano O, Claudon M, Clevert DA, Correas JM, D’Onofrio M, Drudi FM, Eyding J, Giovannini M, Hocke M, Ignee A, Jung EM, Klauser AS, Lassau N, Leen E, Mathis G, Saftoiu A, Seidel G, Sidhu PS, ter Haar G, Timmerman D, Weskott HP. The EFSUMB Guidelines and Recommendations on the Clinical Practice of Contrast Enhanced Ultrasound (CEUS): update 2011 on nonhepatic applications. Ultraschall Med. 2012;33:33–59. [DOI] [PubMed] [Google Scholar]
- Shigeta K, Itoh K, Ookawara S, Taniguchi N, Omoto K. Endothelial cell injury and platelet aggregation induced by contrast ultrasonography in the rat hepatic sinusoid. Ultrasound Med. 2004;23:29–36. [DOI] [PubMed] [Google Scholar]
- Shigeta K, Itoh K, Ookawara S, Taniguchi N, Omoto K. The effects of Levovist and DD-723 in activating platelets and damaging hepatic cells of rats. J Ultrasound Med. 2005;24:967–74. [DOI] [PubMed] [Google Scholar]
- Yang D, Tan KB, Gao YH, Liu H, Yang WX. Effects of diagnostic ultrasound-targeted microbubble destruction on permeability of normal liver in rats. Ultrasonics. 2012;52:1065–1071. [DOI] [PubMed] [Google Scholar]


