Abstract
Background
Coronary PET shows promise in the detection of high-risk atherosclerosis, but there remains a need to optimize imaging and reconstruction techniques. We investigated the impact of reconstruction parameters and cardiac motion-correction in 18F Sodium Fluoride (18F-NaF) PET.
Methods
Twenty-two patients underwent 18F-NaF PET within 22 days of an acute coronary syndrome. Optimal reconstruction parameters were determined in a subgroup of 6 patients. Motion-correction was performed on ECG-gated data of all patients with optimal reconstruction. Tracer uptake was quantified in culprit and reference lesions by computing signal-to-noise ratio (SNR) in diastolic, summed and motion-corrected images.
Results
Reconstruction using 24 subsets, 4 iterations, point-spread-function modelling, time of flight and 5-mm post-filtering provided the highest median SNR (31.5) compared to 4 iterations 0-mm (22.5), 8 iterations 0-mm (21.1) and 8 iterations 5-mm (25.6; all p<0.05). Motion-correction improved SNR of culprit lesions (n=33) (24.5[19.9–31.5]) compared to diastolic (15.7[12.4–18.1]; p<0.001) and summed data (22.1[18.9–29.2]; p<0.001). Motion-correction increased the SNR difference between culprit and reference lesions (10.9[6.3–12.6]) compared to diastolic (6.2[3.6–10.3]; p=0.001) and summed data (7.1 [4.8–11.6]; p=0.001).
Conclusions
The number of iterations and extent of post-filtering has marked effects on coronary 18F-NaF PET quantification. Cardiac motion-correction improves discrimination between culprit and reference lesions.
Keywords: atherosclerosis, positron emission tomography, cardiac motion, computed tomography
Introduction
Positron emission tomography (PET) using 18F Sodium Fluoride (18F-NaF) has emerged as a promising non-invasive imaging modality to potentially identify high-risk and ruptured coronary atherosclerotic plaques. 1–4 However, imaging of the coronary arteries faces many challenges. First, the small caliber of coronary vessels combined with their tortuous course means that optimizing spatial resolution is of great importance. Second, the impact of motion from cardiac contraction, respiration and patient movement can degrade visual quality and PET quantification, highlighting the need for sophisticated methods to overcome these limitations.
To compensate for the effects of motion, prior coronary PET-CT studies have analyzed data from the end-diastolic phase of the cardiac cycle (with 4-bin gating), utilizing only one quarter of PET counts and effectively discarding the remainder. While a useful initial strategy, this method leads to markedly increased noise and potentially additional difficulty in distinguishing active plaques from noise-related artifact. Indeed, in an initial study, the difference in target-to-background ratio between positive and negative plaques was small (approx. 33%), which may be a result of both noise and signal blurring due to motion. 1
Recently, we have demonstrated that a novel cardiac motion-correction method, using a diffeomorphic mass-preserving anatomy-guided registration technique, improves PET quantification when applied to original image data from a single imaging site. 5 However, there is a need to optimize and standardize imaging and quantification methods between centers to minimize variation and enable comparison in multicenter studies.
In this analysis, we evaluated a series of 18F-fluoride coronary measurements with respect to the optimal reconstruction and motion-correction techniques. We aimed to investigate the influence of reconstruction protocols on image quality (judged both visually and quantitatively) in a subgroup of patients who presented with acute coronary syndrome. Secondly, we utilized the optimal reconstruction in a larger group of patients with acute coronary syndrome and evaluated the subsequent improvement in signal quantification gained by the application of our novel motion-correction method, now integrated within image analysis software to help streamline this process.
Methods
Patients
Patients with a diagnosis of acute coronary syndrome (ACS) and who underwent invasive coronary angiography were recruited from Cedars-Sinai Medical Center between December 2015 and June 2016 (n=22). All patients underwent a comprehensive baseline clinical assessment, including evaluation of their cardiovascular risk factor profile. The study was approved by the Investigational Review Board and all patients provided written informed consent.
Imaging Protocols and PET reconstruction
All patients were administered a target dose of 250 MBq of 18F-NaF and rested in a quiet environment. After 60 minutes, image acquisition began on a hybrid PET-CT scanner (GE Discovery 710). Following the acquisition of a non-contrast CT attenuation correction scan, PET acquisition was performed in list mode for 30 minutes. Finally, coronary computed tomography angiography (CTA) was performed at end-expiration immediately following PET acquisition.
ECG-gated PET images were reconstructed using 4 and 10 cardiac bins. A standard ordered subset expectation maximization (OSEM) algorithm was used with time of flight and resolution recovery. Four different reconstruction protocols were applied in a subgroup of 6 patients; 4 iterations with 0-mm post-filtering, 4 iterations with 5-mm post-filtering, 8 iterations with 0-mm post-filtering and 8 iterations with 5-mm post-filtering. For each subject, 24 subsets and a 256×256 matrix size with a 20×20 cm field of view were used in each reconstruction protocol.
Following determination of the reconstruction parameters that provided the highest image quality and signal-to-noise ratio (SNR), the impact of time of flight and resolution recovery was then evaluated. PET images were then reconstructed for the remaining patients using the optimal parameters of those evaluated.
Motion correction
We applied a novel motion-correction method (MC) that aimed to compensate for coronary artery motion by aligning all gates to the end-diastolic position. First, anatomical data was extracted from coronary CTA by applying a vessel tracking method implemented in dedicated software (Autoplaque 2.0, Cedars-Sinai Medical Center). Second, a diffeomorphic mass-preserving image registration algorithm (demons) was used to align 10 gates of PET data with the position of the end-diastolic gate. 5, 6 This algorithm allowed non-linear transformations with a regularization function, facilitating smoother transitions between regions and gates than the originally proposed level-set method [7]. The algorithm was fully automated and implemented in dedicated image analysis software developed at Cedars-Sinai (FusionQuant 1.0) using ITK image processing library. 8 After motion-correction, the 10 gates were summed back together to build a motion-free image containing counts from the entire duration of PET acquisition.
Image Analysis
Image analysis was performed using dedicated software (FusionQuant 1.0 Cedars-Sinai Medical Center, Los Angeles). Images from the four different reconstructions for each patient were presented to an experienced observer (MKD) in a blinded fashion and a visual quality score was assigned to each reconstruction (score 1–4, 1 representing the highest image quality and 4 the most difficult to interpret). For each scan, fused PET-CTA images were co-registered and the same registration was applied to diastolic, summed and motion-corrected images.
For quantitative PET analysis, activity was measured by delimiting 3-dimensional spherical volumes of interest on coronary artery plaques. Lesions were considered PET-positive if there was visual focal tracer uptake in a plaque which followed the course of the vessel over more than one slice and was visible on more than one of four gates including the end-diastolic gate. Reference lesions without visual PET-uptake (i.e. PET-negative) were measured in coronary vessels at the same segment or proximal to the PET-positive lesions. Plaque volume was measured for all PET-positive and reference PET-negative lesions, which were present in epicardial vessels with a caliber >2mm and had not been stented prior to imaging, excluding those with poor image quality. This was performed Autoplaque software version 2.0 (Cedars Sinai Medical Center).
Background blood-pool activity was measured by delimiting 3cm2 regions of interest in the right atrium on three consecutive slices from the level of the lowest pulmonary vein insertion. Image noise was defined as the mean standard deviation of blood-pool activity. SNR was defined as the plaque maximal SUV inside the spherical region centered around the plaque (SUVmax) divided by noise. Target-to-Background Ratio (TBR) was defined as the SUVmax divided by the mean background blood-pool activity. For each image, PET registration and regions of interest were saved using the original image, and the same regions of interest were measured in the diastolic, summed and motion corrected images. Autoplaque software version 2.0 (Cedars-Sinai Medical Center) was used to quantify total plaque volume of coronary arterial plaques for PET-positive and PET-negative reference lesions after excluding those with stents and poor image quality (n=28).
Statistical Analysis
Continuous data is expressed as mean (standard deviation) or median [interquartile range] as appropriate. Data was tested for normality using Shapiro-Wilk test. Parametric data were compared using student’s T-test and non-parametric data compared using Wilcoxon Rank-Sum test as appropriate. A two-sided p value <0.05 was considered statistically significant. Statistical analyses were performed using GraphPad Prism (version 7, GraphPad software Inc) and SPSS (version 22, IBM, USA) software.
Results
Patient Characteristics
Twenty-two patients were recruited 22 days within diagnosis of acute coronary syndrome (Table 1). All patients underwent PET-CT following invasive angiography with a mean duration of 8.7±4.8 days between angiography and PET-CT. Culprit lesions were identified on invasive angiography in 17 of the 22 patients. In one patient, the culprit vessel was a prior bypass graft and this patient was excluded from further motion-correction analysis. Of the remaining 21 patients, 10 (48%) had multi-vessel disease on invasive angiography with at least one additional major epicardial vessel demonstrating >50% stenosis. Nineteen patients underwent percutaneous revascularization and two underwent coronary artery bypass grafting. Seven patients (33%) underwent revascularization of more than one vessel. Seventeen (81%) patients had at least one PET-positive lesion. Of these patients, 16 demonstrated focal tracer uptake in a culprit vessel which was treated at the time of invasive angiography. The remaining patient had a PET-positive lesion in the mid right coronary artery, in which chronic total occlusion was demonstrated on invasive angiography. There was no significant difference in total CTA-defined plaque volume between PET-positive and PET-negative lesions (304.5[232.9, 368.9] versus 235[231, 387] mm3; p=0.70).
Table 1.
Baseline Characteristics
| Variable | Value | SD/Percent |
|---|---|---|
| Age in years, SD | 62.4 | 11.2 |
|
| ||
| Men, n (%) | 20 | 91% |
|
| ||
| BMI, SD (kg/m2) | 27.6 | 5.7 |
|
| ||
| HR, SD (beats per minute) | 64.0 | 10.9 |
|
| ||
| Systolic, SD (mmHg) | 128.4 | 17.1 |
|
| ||
| Diastolic, SD (mmHg) | 72.1 | 11.2 |
|
| ||
| Cardiovascular History, n (%) | ||
|
| ||
| Previous MI | 5 | 25% |
| CVA/TIA | 0 | 0% |
| PCI | 5 | 25% |
| CABG | 4 | 20% |
|
| ||
| Risk Factors, n (%) | ||
|
| ||
| Smoking | 10 | 45% |
| Diabetes | 5 | 23% |
| Hypertension | 16 | 73% |
| Hypercholesterolemia | 14 | 64% |
|
| ||
| Serum Biochemistry (SD) (mg/dl) | ||
|
| ||
| Cholesterol | 152.4 | 34.0 |
| HDL | 42.4 | 13.8 |
| LDL | 87.3 | 27.2 |
| Triglyceride | 136.3 | 82.6 |
| Creatinine | 1.1 | 1.0 |
|
| ||
| Medications, n (%) | ||
|
| ||
| Aspirin | 19 | 86 |
| Clopidogrel | 12 | 55 |
| Statin | 18 | 82 |
| Beta Blocker | 15 | 68 |
| ACEI/ARB | 9 | 41 |
| Calcium Channel Blockers | 4 | 18 |
| Oral Nitrates | 4 | 18 |
ACEI=angiotensin-converting-enzyme inhibitors. † ARB=angiotensin receptor blocker. ‡ BMI=body mass index. § CABG=coronary artery bypass grafting. ll CVA=cerebrovascular accident. HDL=high-density lipoprotein. # LDL=low-density lipoprotein. ** PCI=percutaneous coronary intervention. †† TIA=transient ischemic attack
Reconstruction Subgroup
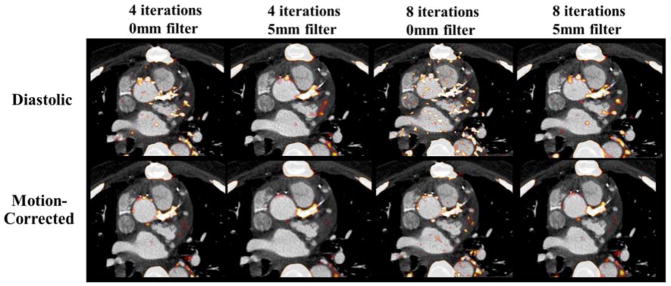
A subgroup of six patients was selected to assess the optimal reconstruction parameters needed to improve the balance between PET quantification and noise. When evaluating visual quality, use of 8 iterations and 0-mm post-filtering led to consistently poorer image quality (score of 4 in 6/6 patients) with difficulty in image interpretation due to noise, whereas the highest visual image quality was consistently observed in the reconstruction using 4 iterations and 5-mm post-filtering with time of flight and resolution recovery (score of 1 in 6/6 patients) (Figure 1). The reconstruction using 4 iterations and 0-mm post-filtering scored 2 in two cases and 3 in four of six cases and, similarly, the reconstruction using 8 iterations and 5-mm post-filtering scored 2 in four cases and 3 in two of the six cases.
Fig. 1.
The impact of different PET reconstructions on visual image quality in diastolic and motion-corrected images in a patient with a positive culprit lesion in the left main coronary artery. The PET reconstruction using 4 iterations and 5-mm post-filtering was considered to provide superior image quality (TBR=1.92 for motion-corrected image).
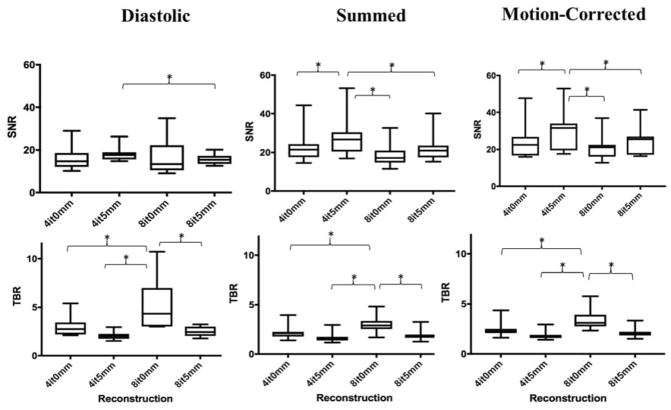
After motion-correction, the median signal-to-noise ratio was higher in the reconstruction using 4 iterations 5-mm (31.5 [19.5–33.9]) versus 4 iterations 0-mm (22.5 [16.7–26.8]), 8 iterations 0-mm (21.1 [16.1–22.5]), and 8 iterations 5-mm (25.6 [17.2–27.0]) (p<0.05 for all). Conversely, TBR was consistently higher in the reconstruction method using 8 iterations and 0-mm post-filtering in the diastolic (4.3 [3.0–7.0]), summed (2.9 [2.5–3.4] and motion-corrected (3.1 [2.8–3.9]) data. In the motion-corrected images, this reconstruction method generated higher TBR values (3.1 [2.8–3.9]) compared to 4 iterations 5-mm (1.8 [1.6–1.9]), 4 iterations 0-mm (2.2 [2.1–2.5]) and 8 iterations 5-mm (2.0 [1.9–2.2]) (p=0.005 for all; Figure 2).
Fig. 2.
Signal-to-Noise Ratio (SNR) and Target-to-Background Ratio (TBR) in diastolic, summed and motion-corrected images for each reconstruction. In the diastolic, summed and motion-corrected images, median SNR was highest when PET data was reconstructed using 4 iterations and 5mm post-filtering. Conversely, TBR was highest when more iterations were used without applying post-filtering (*p<0.01).
Time of Flight and Resolution Recovery
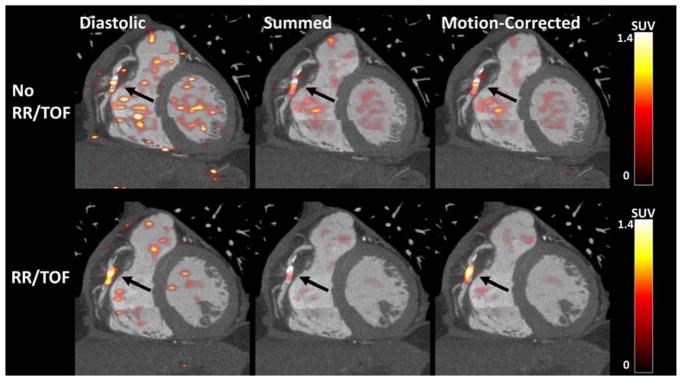
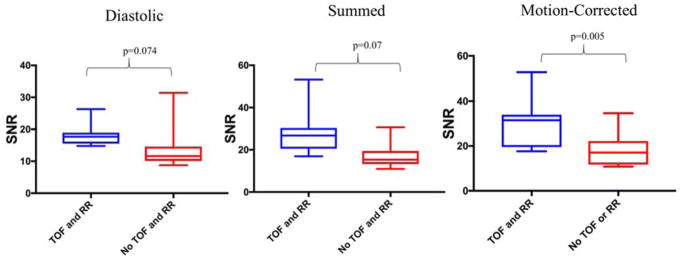
Following selection of the reconstruction which provided superior SNR, the influence of time of flight and resolution recovery was assessed in the same subgroup (Figure 3). In the diastolic data, there was a trend but no significant difference in SNR with and without time of flight and resolution recovery (17.7 [15.6–19.0] versus 11.6 [10.1–14.5]; p=0.074). In the summed data, SNR improved with the use of time of flight and resolution recovery (26.8 [20.5–30.3] versus 15.4 [13.3–19.3]; p=0.007). Similarly, following motion-correction, SNR was greater when time of flight and resolution recovery were implemented (31.5 [19.5–33.9] versus 17.0 [11.7–22.2]; p=0.005). (Figure 4)
Fig. 3.
The impact of Time of Flight (TOF) and Resolution Recovery (RR) on SNR in diastolic, summed and motion-corrected images in a patient with a PET-positive plaque in the mid right coronary artery. In the summed and motion-corrected images, median SNR was higher with TOF and RR (p<0.01).
Fig. 4.
The effect of Time of Flight (TOF) and Resolution Recovery (RR) on SNR. SNR improved following TOF and RR, summed (27 vs 15; p=0.007) and motion-corrected (32 vs 17; p=0.005) data.
When assessing TBR in reconstructions with and without the use of time of flight and resolution recovery, there was no difference in the diastolic data with compared to without these features (2.02 [1.75–2.27] versus 2.04 [1.81–2.72]; p=0.878). However, following the application of motion-correction, TBR was higher in the motion-corrected data with time of flight and resolution recovery (1.79 [1.60–1.75] versus 1.59 [1.46–1.73]; p=0.005).
Motion Correction
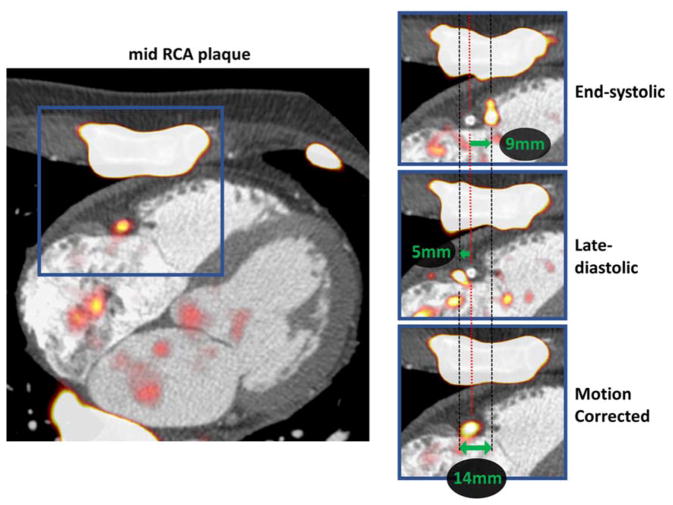
A representative example of the extent of coronary artery motion in the right coronary artery is shown in Figure 5. The effects of motion-correction on visual image quality is shown in Figure 6.
Fig. 5.
Motion correction of physiological motion of the right coronary artery. Systolic excursion of the tricuspid annular plane leads to displacement of the PET signal during the cardiac cycle (zoomed area of interest in blue squares). The difference in the shift of PET from reference is shown on the end-systolic (top-right) and late-diastolic (mid right) images. Green arrows represent the vectors of mid RCA motion. By co-registration of all PET data to the reference end-diastolic gate, the final motion corrected image is corrected for the 14mm mid RCA motion (bottom-right).
Fig. 6.
Fused PET-CTA images before and after motion-correction. An example of a PET-positive lesion in the right coronary artery (arrows) using the diastolic (A), summed (B) and motion-corrected (C) PET data.
Signal to Noise Ratio
Motion-correction was performed in all cases using 10 cardiac gates and the optimized reconstruction parameters: time of flight and resolution recovery, 4 iterations, 24 subsets, 5-mm post-filtering and 256×256 matrix size. Compared to the original diastolic gate (15.7 [12.4–18.1]), motion-correction led to a significant improvement in SNR for PET-positive lesions (n=33; 24.5 [19.9–31.5]; p<0.001). Further, motion-correction also increased SNR when compared with the summed data (22.1 [18.9–29.2] versus 24.5 [19.9–31.5], p<0.001).
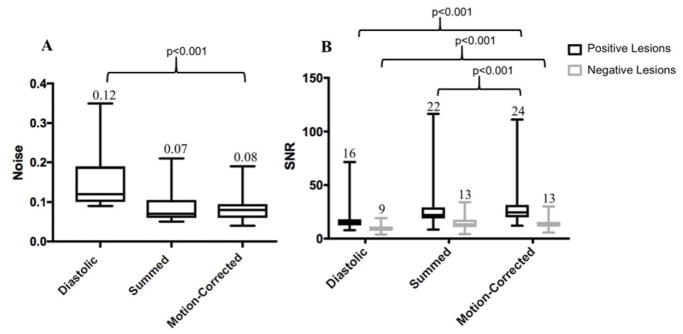
When analysing PET-negative reference lesions, there was an increase in SNR following motion-correction when compared to the diastolic gate (n=23; negative 13.0 [11.2–15.7] versus 8.8 [7.2–11.3] p<0.001), but no significant difference between the summed and MC data (summed 13.3 [10.6–16.7] versus 13.0 [11.2–15.7] p=0.648). Background noise was higher in the diastolic (0.12 [0.10–0.19]) compared to motion-corrected (0.08 [0.06–0.09]; p<0.001) data. There was no significant difference in background noise between the summed (0.07 [0.06–0.10]) and motion-corrected data (0.08 [0.06–0.09]; p=0.59; Figure 7). Motion-correction led to an improvement in the absolute difference between PET-positive culprit and PET-negative reference lesions compared to the diastolic gate (10.9 [6.3–12.6] versus 6.2 [3.6–10.3], p<0.001) and summed data (10.9 [6.3–12.6] versus 7.1 [4.8–11.6] p<0.001).
Fig. 7.
(A) Image noise in diastolic, summed and motion-corrected data. The median noise improves from 0.12 in the diastolic data to 0.08 following motion correction (median; p<0.001) and (B) Signal-to-Noise Ratio (SNR) before and after motion-correction. Median SNR for the motion-corrected data was highest in the positive lesions (n=33), and similar to SNR of the summed data for negative lesions (n=23)
Target to Background Ratio
Target-to-background ratios for PET-positive lesions were higher in the original diastolic (2.1 [1.8–2.4]) versus motion-corrected image (1.8 [1.6–2.1]); p<0.001) and higher in the motion-corrected than summed image (1.8 [1.6–2.1] versus 1.6 [1.4–1.9]; p<0.0001). For PET-negative lesions, TBR was also higher in the original diastolic (1.4 [1.1–1.7]) versus motion-corrected image (1.2 [0.9–1.4]; p=0.002) and lower in the summed (1.1 [0.9–1.2]) versus motion-corrected image (1.2 [0.9–1.4]; p=0.014]).
Standardized Uptake Value
For PET-positive lesions, SUVmax was higher in the diastolic image (1.9 [1.7–2.5]) versus motion-corrected (1.8 [1.4–2.1]; p<0.001). When compared to the summed, non-gated data, SUVmax was higher following motion-correction (1.8 [1.4–2.1] versus 1.6 [1.3–1.92]; p<0.001). For PET-negative lesions, SUVmax was higher in the diastolic image (1.40 [1.07–1.79]) versus the motion-corrected image (1.10 [0.89–1.56]; p<0.001). There was no significant difference in SUVmax of negative lesions between the summed and motion-corrected data (1.06 [0.91–1.38] versus 1.10 [0.89–1.56]; p=0.078).
Discussion
While potentially a promising technique to identify adverse plaque features, coronary PET faces many challenges which must be overcome for this imaging method to reach its full research and clinical potential. An accurate and reproducible method for quantification is necessary to distinguish positive and negative lesions, as well as to allow use in monitoring disease progression and response to therapies. In this study, we have evaluated the effect of a variety of reconstruction methods on quantitative coronary PET and have subsequently demonstrated improved discrimination between positive and negative lesions following the application of cardiac motion-correction.
We have demonstrated that, while more iterations and no post-filtering results in higher SUVmax and TBR values, these images are excessively noisy and difficult to interpret. Similarly, although end-diastolic images may demonstrate higher SUVmax and TBR as compared to summed or motion-corrected images, these images are of poorer visual quality with lower SNR values. Moreover, plaque lesions without visible radiotracer uptake often demonstrate higher SUVmax and TBR values in the end-diastolic images, which likely represents the noisier character of these data rather than a true increase in PET signal. 9,10 Thus, while TBR is used to provide useful information with regards to biological activity of atherosclerosis within the peripheral, carotid and coronary arteries, 11–15 TBR and SUVmax may not be the most suitable parameters for assessing the optimal method of coronary PET reconstruction. Instead, SNR assessments capture both the signal intensity and the surrounding noise, improving the ability to discriminate between active and inactive disease, thereby potentially improving the overall specificity and reliability of the test. Indeed, while we also observed a small increase in SNR for negative lesions following motion-correction, the difference between positive and negative lesions in each patient also increased, suggesting improved discrimination between active and inactive plaques. Similar to previous reports, the majority (81%) of patients had evidence of increased 18F-NaF activity following an acute event, and sites of 18F-NaF uptake corresponded to regions of severe disease on invasive angiography. 1
Our study highlights the marked influence of different reconstruction parameters on PET quantification of coronary uptake. A recent report highlighted that details of the reconstruction settings used were not documented in one third of published PET studies [16]. As this imaging modality continues to evolve and become more widely adopted, standardization of imaging protocols is of extreme importance in drawing meaningful conclusions from quantitative PET results. Even small changes in imaging protocols may markedly influence results. The choice of the reconstruction protocol, particularly the number of iterations used as well as post-filtering have the most marked effect on quantification when compared to image analysis methods. Indeed, acquisition protocols have been shown to lead to variations in SUV up to a factor of three. 16 In a recent report, it was highlighted that increasing the number of iterations reduced bias in SUV measurements and OSEM with at least 120 maximization equivalent iterations and no post-filtering was recommended. 16 However, the majority of studies have considered large-caliber stationary vessels such as the aorta and carotid arteries, which are less subject to motion than the coronary arteries. 17 In order to optimize the research and clinical potential of 18F-NaF PET, there must be a balance between recovering ‘true’ lesion activity while maintaining image quality for the clinician or researcher interpreting the study. Thus, reducing noise by applying smoothing is necessary to improve visual image quality when interpreting coronary PET. In our results, image noise was lowest and visual quality highest in the reconstruction using 4 iterations (4×24 subsets=96 image updates) and 5-mm post-filtering.
We have recently demonstrated that the application of level-set-based nonlinear PET registration improves PET image quality and quantification in a small cohort of patients with acute coronary syndrome. 5 This study adds to these initial findings by focusing on further optimization of image reconstruction and applying a new and improved motion correction approach which produces smoother deformation fields and better noise characteristics compared to our initial study. 7 The refined motion correction method is now integrated within image analysis software, facilitating automation of results within the research and clinical setting.
We recognize that there are limitations to our study. Firstly, we did not apply corrections for partial volume effects in our patient population. The impact of partial volume effects on PET quantification in this study is uncertain without precise quantification of lesion size. It is likely that partial volume effects would decrease with higher resolution provided by increasing number of iterations, however, further increases beyond a maximum resolution would increase noise without improving spatial resolution. 18 Future studies should consider investigating the effects of partial volume correction on PET quantification. Secondly, we did not apply dual cardio-respiratory motion to our patient population. Although the effects of cardiac contraction exceed that of respiration with regards to displacement of the coronaries (cardiac contraction displaces the coronary arteries 8–26mm during the cardiac cycle, while normal respiration leads to movement of the heart of approximately 6–13mm, 17 the development and integration of novel methods to allow dual cardio-respiratory motion correction will likely lead to further improvements in signal-to-noise ratio in future studies. This will require innovative dual cardio-respiratory gating and dual correction approaches which do not rely upon segmentation of the myocardium (due to low myocardial uptake of 18 F-fluoride) and therefore overcome difficulties relating to the lack of anatomical landmarks to reference motion within the vicinity of the heart.
In this study, we investigated the influence of time of flight and resolution recovery in combination and did not measure the incremental effects of each feature in isolation. Prior studies have, however, demonstrated that both parameters in combination provide optimal results when compared to each feature individually. 19,20
Moreover, we evaluated performance on only one scanner platform under a fixed acquisition protocol and the optimal reconstruction settings will likely be different for other vendors, injected activities, and scan durations. Further, our study involved only rigid alignment between PET and CTA using a whole heart approach, which may lead to modest inaccuracies in precise PET-CTA fusion. The research software developed at our institution provides the ability to save rigid registration and regions of interest and load the same registration and measurements on multiple studies. This therefore provides an accurate method for quantification and direct comparison between multiple reconstructions, minimizing variation in plaque measurements. Fully automated registration between CTA and PET would further improve this process, and may enable patients to undergo initial clinical coronary CTA before proceeding to PET-CTA, thereby improving clinical workflow.
While the number of patients in our study population is small, we have demonstrated significant differences between different reconstruction parameters and following the application of motion-correction. Although this suggests an improvement in diagnostic capability, results from prospective clinical trials are required to explore the relationship between coronary 18F-NaF PET activity and future risk of cardiac events, and define thresholds associated with increased risk. While this was not a focus of our study, a large multicenter trial is currently seeking to answer this question (NCT02278211). Finally, although our study focused on 18F-NaF, this motion-correction method would be applicable to other PET tracers exploring alternative pathophysiological processes within the coronary arterial system.
Conclusion
In conclusion, the number of iterations and extent of post-filtering in 18F-NaF PET reconstruction has marked effects on quantitation and should be considered when using coronary PET. Motion-correction, using a diffeomorphic mass-preserving registration algorithm driven by anatomical framework from coronary CTA improved signal to noise ratio in active culprit plaques, and improves discrimination between active and reference coronary lesions.
Knowledge Gained
Currently there is no standardized reconstruction protocol for 18F-NaF coronary imaging. In view of the small size of target lesions (coronary plaques) and the detrimental impact of combined: respiratory, cardiac and gross patient motion every effort should be made to improve image quality. This study is the first to comprehensively evaluate reconstruction parameters and evaluate the benefits of applying cardiac motion correction for 18F-NaF coronary imaging. A PET reconstruction using 24 subsets, 4 iterations, point spread function modelling, time of flight and 5-mm post-filtering provides highest signal to noise ratios and image quality. Motion-correction, using a diffeomorphic mass preserving registration further improves signal to noise ratio in active culprit plaques, and facilitates discrimination between active and reference coronary lesions.
Acknowledgments
Financial Support:
This research was supported in part by grant 1R01HL135557 from the National Heart, Lung, and Blood Institute/National Institute of Health (NHLBI/NIH). The content is solely the responsibility of the authors and does not necessarily represent the official views of the National Institutes of Health. The study was also supported by a grant (“Cardiac Imaging Research Initiative”) from the Adelson Medical Research Foundation.
David Newby (CH/09/002) and Marc Dweck (FS/14/78) are supported by the British Heart Foundation. David Newby is also the recipient of a Wellcome Trust Senior Investigator Award (WT103782AIA). No other potential conflict of interest relevant to this article was reported.
Abbreviations
- PET
Positron Emission Tomography
- CT
Computed Tomography
- ACS
Acute Coronary Syndrome
- CTA
Computed Tomography Angiography
- ECG
Electrocardiograph
- SNR
Signal-to-Noise Ratio
- TBR
Tissue-to-Background Ratio
- SUV
Standardized Uptake Value
Footnotes
Conflict of Interest Disclosure
This research was supported in part by grant 1R01HL135557 from the National Heart, Lung, and Blood Institute/National Institute of Health (NHLBI/NIH). The content is solely the responsibility of the authors and does not necessarily represent the official views of the National Institutes of Health. The study was also supported by a grant (“Cardiac Imaging Research Initiative”) from the Adelson Medical Research Foundation.
David Newby (CH/09/002) and Marc Dweck (FS/14/78) are supported by the British Heart Foundation. David Newby is also the recipient of a Wellcome Trust Senior Investigator Award (WT103782AIA). No other potential conflict of interest relevant to this article was reported.
References
- 1.Joshi NJ, Vesey AT, Williams MC, et al. 18F-fluoride positron emission tomography for identification of ruptured and high-risk coronary atherosclerotic plaques: a prospective clinical trial. The Lancet. 2014;383(9918):705–713. doi: 10.1016/S0140-6736(13)61754-7. [DOI] [PubMed] [Google Scholar]
- 2.Lee JM, Bang J-I, Koo BK, et al. Clinical Relevance of 18F-Sodium Fluoride Positron-Emission Tomography in Noninvasive Identification of High-Risk Plaque in Patients With Coronary Artery Disease. Circ Cardiovasc Imaging. 2017;10(11):e006704. doi: 10.1161/CIRCIMAGING.117.006704. [DOI] [PubMed] [Google Scholar]
- 3.Kitagawa T, Yamamoto H, Toshimitsu S, et al. Data on analysis of coronary atherosclerosis on computed tomography and 18F-sodium fluoride positron emission tomography. Data Brief. 2017;13:341–345. doi: 10.1016/j.dib.2017.06.011. [DOI] [PMC free article] [PubMed] [Google Scholar]
- 4.Kitagawa T, Yamamoto H, Toshimitsu S, et al. 18F-sodium fluoride positron emission tomography for molecular imaging of coronary atherosclerosis based on computed tomography analysis. Atherosclerosis. 2017;263:385–392. doi: 10.1016/j.atherosclerosis.2017.04.024. [DOI] [PubMed] [Google Scholar]
- 5.Rubeaux M, Joshi N, Dweck MR, et al. Motion correction of 18F-sodium fluoride PET for imaging coronary atherosclerotic plaques. J Nucl Med. 2016;57(1):54–59. doi: 10.2967/jnumed.115.162990. [DOI] [PubMed] [Google Scholar]
- 6.Vercauteren T, Pennec X, Perchant A, Ayache N. Symmetric log-domain diffeomorphic Registration: a demons-based approach. Med Image Comput Comput Assist Interv. 2008;11(Pt 1):754–761. doi: 10.1007/978-3-540-85988-8_90. [DOI] [PubMed] [Google Scholar]
- 7.Rubeaux M, Joshi N, Dweck MR, et al. Demons versus Level-Set motion registration for coronary (18)F-sodium fluoride PET. In: Styner MA, Angelini ED, editors. Proc SPIE Int Soc Opt Eng. Vol. 9784. 2016. p. 97843Y-97843Y-7. [DOI] [PMC free article] [PubMed] [Google Scholar]
- 8.An ITK Implementation of the Symmetric Log-Domain Diffeomorphic Demons Algorithm. 2017 Jan;:1–11. [Google Scholar]
- 9.Thie JA. Understanding the standardized uptake value, its methods, and implications for usage. J Nucl Med. 2004;45(9):1431–1434. [PubMed] [Google Scholar]
- 10.Boellaard R, Krak NC, Hoekstra OS, Lammertsma AA. Effects of noise, image resolution, and ROI definition on the accuracy of standard uptake values: a simulation study. J Nucl Med. 2004;45(9):1519–1527. [PubMed] [Google Scholar]
- 11.Tawakol A, Migrino RQ, Bashian GG, et al. In vivo 18F-fluorodeoxyglucose positron emission tomography imaging provides a noninvasive measure of carotid plaque inflammation in patients. J Am Coll Cardiol. 2006;48(9):1818–24. doi: 10.1016/j.jacc.2006.05.076. [DOI] [PubMed] [Google Scholar]
- 12.Rudd JHF, Myers KS, Bansilal S, et al. (18)Fluorodeoxyglucose positron emission tomography imaging of atherosclerotic plaque inflammation is highly reproducible: implications for atherosclerosis therapy trials. J Am Coll Cardiol. 2007;50(9):892–896. doi: 10.1016/j.jacc.2007.05.024. [DOI] [PubMed] [Google Scholar]
- 13.Asabella AN, Ciccone MM, Cortese F, et al. Higher reliability of 18F-FDG target background ratio compared to standardized uptake value in vulnerable carotid plaque detection: a pilot study. Ann Nucl Med. 2014;28(6):571–579. doi: 10.1007/s12149-014-0850-9. [DOI] [PubMed] [Google Scholar]
- 14.Rudd JHF, Myers KS, Bansilal S, et al. Atherosclerosis inflammation imaging with 18F-FDG PET: carotid, iliac, and femoral uptake reproducibility, quantification methods, and recommendations. J Nucl Med. 2008;49(6):871–878. doi: 10.2967/jnumed.107.050294. [DOI] [PubMed] [Google Scholar]
- 15.Vesey AT, Jenkins WSA, Irkle A, et al. 18F-Fluoride and 18F-Fluorodeoxyglucose Positron Emission Tomography After Transient Ischemic Attack or Minor Ischemic Stroke: Case-Control Study. Circ Cardiovasc Imaging. 2017;10(3):e004976. doi: 10.1161/CIRCIMAGING.116.004976. [DOI] [PMC free article] [PubMed] [Google Scholar]
- 16.Huet P, Burg S, Le Guludec D, Hyafil F, Buvat I. Variability and uncertainty of 18F-FDG PET imaging protocols for assessing inflammation in atherosclerosis: suggestions for improvement. J Nucl Med. 2015;56(4):552–559. doi: 10.2967/jnumed.114.142596. [DOI] [PubMed] [Google Scholar]
- 17.Shechter G, Resar JR, McVeigh ER. Displacement and velocity of the coronary arteries: cardiac and respiratory motion. IEEE Trans Med Imaging. 2006;25(3):369–375. doi: 10.1109/TMI.2005.862752. [DOI] [PMC free article] [PubMed] [Google Scholar]
- 18.Soret M, Bacharach SL, Buvat I. Partial-volume effect in PET tumor imaging. J Nucl Med. 2007;48(6):932–945. doi: 10.2967/jnumed.106.035774. [DOI] [PubMed] [Google Scholar]
- 19.Akamatsu G, Ishikawa K, Mitsumoto K, et al. Improvement in PET/CT image quality with a combination of point-spread function and time-of-flight in relation to reconstruction parameters. J Nucl Med. 2012;53(11):1716–1722. doi: 10.2967/jnumed.112.103861. [DOI] [PubMed] [Google Scholar]
- 20.Schaefferkoetter J, Casey M, Townsend D, Fakhri El G. Clinical impact of time-of-flight and point response modeling in PET reconstructions: a lesion detection study. Phys Med Biol. 2013;58(5):1465–1478. doi: 10.1088/0031-9155/58/5/1465. [DOI] [PMC free article] [PubMed] [Google Scholar]


