Abstract
Objective
The objective was to determine self-adjusted output response and Speech Intelligibility Index in individuals with mild to moderate hearing loss and to measure the effects of prior hearing-aid experience.
Design
Thirteen hearing-aid users and 13 non-users, with similar group-mean pure-tone thresholds, listened to pre-recorded and pre-processed sentences spoken by a man. Starting with a generic level and spectrum, participants adjusted i) overall level, ii) high-frequency boost iii) low-frequency cut. Participants took a speech-perception test after an initial adjustment before making a final adjustment. The three self-selected parameters, along with individual thresholds and Real-Ear-to-Coupler Differences, were used to compute output levels and Speech Intelligibility Indices for the starting and two self-adjusted conditions. The values were compared with a threshold-based prescription (NAL-NL2) and, for the aid-users, performance of their existing aids.
Results
All participants were able to complete the self-adjustment process. The generic starting condition provided outputs (between 2 and 8 kHz) and SIIs that were significantly below those prescribed by NAL-NL2. Both groups increased SII to values that were not significantly different from prescription. The aid users, but not the non-users, increased high-frequency output and SII significantly after taking the speech-perception test. Seventeen of the 26 participants (65%) met an SII criterion of 60% under the generic starting condition. The proportion increased to 23 out of 26 (88%) after the final self-adjustment. Of the 13 hearing-aid users, eight (62%) met the 60% criterion with their existing aids. With the final self-adjustment 12/13 (92%) met this criterion.
Conclusions
The findings support the conclusion that user self-adjustment of basic amplification characteristics can be both feasible and effective with or without prior hearing-aid experience.
Introduction and Purpose
User self-fitting of amplification has been suggested as a way to improve hearing healthcare for persons with hearing loss who are unable to access services or who are unable to afford them (Convery et al., 2011). A self-fitting hearing aid has been described as an aid “that can be fitted and managed entirely by the user” (Convery et al., 2011, pg 1). That is, the user completes the entire process without help, including assembly and operation of the device, assessment of hearing thresholds, and adjustment of amplification parameters. The current study examines only one part of the self-fitting process: user self-adjustment of basic amplification parameters – which will be referred to as “self-adjustment” for the remainder of this report. In other words, “self” refers, here, to the user and not to the aid.
One approach to self-adjustment is a paired-comparison procedure in which users select from two alternative hearing-aid settings. The efficacy of this type of user-driven procedure for comparison and selection of hearing-aid characteristics is well documented (e.gs. Keidser, 1995; Keidser et al., 2005; Kuk & Lau, 1995; Levitt et al., 1986; Levitt et al., 1987; Neuman et al., 1987). Manufacturers have incorporated basic paired comparisons in hearing-aid fitting software for more than a decade as a tool for fine tuning after initial fitting by a hearing professional. The time requirements of the procedure, however, may limit its practical application for self-adjustment (Kuk & Pape, 1993).
A second approach involves self-adjustment of amplification characteristics such as overall level, frequency response, and compression parameters. Recent studies have documented the viability of self-adjustment using prescription-based starting responses determined from audiometric thresholds (Dreschler et al., 2008; Keidser & Alamudi, 2013; Keidser, Dillon, et al., 2008a; Mueller et al., 2008; Zakis et al., 2007). In general, listeners have been found to select somewhat less gain than is prescribed, with smaller deviations observed for the newer NAL-NL2 prescription (Keidser & Alamudi, 2013; Zakis et al., 2007). In studies that included variations in the starting level/response, users tended to select less amplification when the starting response was below prescribed target than when the starting response was at or above prescribed targets (Dreschler et al., 2008; Keidser, Dillon, et al., 2008a; Mueller et al., 2008). For example, Mueller et al. (2008) reported that users selected 8-9 dB less gain when starting levels were 6 dB below NAL-NL1 targets than when they were 6 dB above targets. In addition, users tended to select less high-frequency gain when its starting level was above targets than when it was below (Keidser, Dillon, et al., 2008b).
The observation that lower starting responses or steeper frequency-response slopes relative to the prescribed response may result in lower user-selected output (and audibility) supports the use of an individualized threshold-driven response as a starting point for self-adjustment. Automated threshold determination is generally feasible (See Mahomed et al., 2013 for review). Convery et al. (2015), however, reported that only 58% of their participants (aged 66-90 years) could obtain a complete bilateral hearing assessment when the testing was entirely self-directed. These findings suggest that a direct-to-consumer hearing-aid delivery model which requires independent threshold determination by the user may not be viable for some older people.
The primary goal of the study reported here was to determine the feasibility and outcome of an alternative self-adjustment approach that includes a generic starting response designed for a mild-to-moderate hearing loss and similar to that of current personal sound amplification devices. Self-adjustment from a generic starting response based on a common pattern of hearing loss may provide adequate audibility for a substantial proportion of users without requiring self-determination of thresholds. Given the recent emergence of self-adjustment features in direct-to-consumer amplification products and smart-phone hearing-amplification applications, including some that do not include threshold determination, further work in this area is warranted (See Keidser & Convery, 2016 for review).
A secondary goal of the study was to determine the effects, if any, of hearing-aid experience on self-adjusted output and audibility. To date, the amount of hearing-aid experience has not been cited as a significant factor in users’ selection of gain (e.g. Dreschler et al., 2008) or overall success with a self-fitting process (Convery et al., 2017). Most studies examining direct user adjustment, however, have not included a substantial number of non-users. Given the evidence that new hearing-aid users tend to prefer less gain than experienced users (Keidser, O’Brien, et al., 2008), further examination of this factor within the context of self-fitting is warranted.
The current paper is the second in a series of two papers arising from this work. In the previous paper, we described users’ interactions with the “Goldilocks” self-fitting software which is designed to allow systematic self-adjustment of volume, and response curve while listening to speech, and which incorporates a speech-perception test (Boothroyd & Mackersie, 2017). All of the participants successfully completed the adjustment procedure, although six (23%) needed a little help getting started. As noted in the earlier paper, this help simply consisted of pointing to the “start button” or encouraging exploration of the adjustments. Participants who had never worn hearing aids were slower than experienced users to complete an initial self-adjustment but were as fast as experienced users during a second self-adjustment. That paper reported only on the numerical software selections made by participants. The present paper converts those data into real-ear estimates of output response and Speech Intelligibility Index (SII) to address several research questions:
When adults with mild to moderately severe hearing loss are given the opportunity to explore and select output level and spectrum while listening to pre-recorded speech in quiet:
How do the self-adjusted level, spectrum, and SII compare with those provided by a generic starting response?
How do the self-adjusted level, spectrum, and SII compare with those provided by the National Acoustic Laboratories second Non-Linear threshold-based prescription (NAL-NL2)?
Does hearing-aid experience affect the outcome?
Does the inclusion of a speech perception test affect outcome?
How do self-adjustments made by hearing-aid users compare to their existing hearing aids?
METHODS
Participants
Institutional Review Board approval was obtained by San Diego State University before beginning data collection. Twenty-six adults participated (11 men and 16 women). Thirteen participants were experienced hearing-aid users (5 men and 8 women). The other thirteen had no hearing-aid experience (6 men and 7 women). Sample sizes were based on group standard deviations from a pilot study. It was estimated that thirteen participants in a group would enable us to demonstrate, with 95% confidence, medium-sized group differences: in overall output level of 5.3 dB; in Speech Intelligibility Index of 5.4 %pts; and in word recognition (at around 90%) of 1.1 %pts.
The age range of the aid-users was 60 to 88 years with a mean of 74 years. The age range of the non-users was 52 to 89 years with a mean of 72 years. All participants had scores on the Montreal Cognitive Assessment (MoCA) of 21/30 or higher (Nasreddine et al., 2005). For the aid-users, MoCA scores ranged from 21 to 30 with a mean of 27. For the non-users, MoCA scores ranged from 22 to 30 with a mean of 26. Individual participant information (e.g. thresholds, ages, MoCA scores, sex) is provided in a Table (Supplemental Digital Content 1).
Three-frequency average hearing loss (at 0.5, 1, and 2 kHz) for the aid-users ranged from 27 to 68 dB with a mean of 41 dB HL. For non-users, the range was from 28 to 58 dB with a mean of 40 dB HL. Means and ranges of pure-tone thresholds for the two groups are shown in Figure 1. The mean thresholds of the two groups differed by 3 dB or less from 250 thru 4000 Hz. Only at 8 kHz did the group-mean difference increase to 15 dB. Even this difference, however, failed to reach the 5% level of significance because of the high-within-group variance (t[24] = 1.84, p = 0.08).
Figure 1.
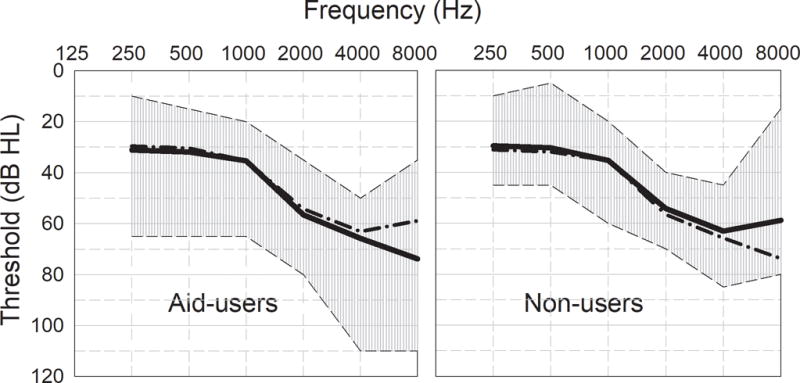
Mean and range of pure-tone thresholds for two participant groups. For ease of comparison, the means of the alternate group are shown by dash-dot lines.
There was no evidence that the two groups differed significantly in terms of sex, mean age, mean threshold at any frequency, or mean MoCA score. It should be noted from Figure 1, however, that the range of thresholds was greater for the hearing-aid users.
Self-adjustment software
Custom self-fitting software was developed to provide the user with touch-screen control of three properties of the output while listening to speech. The properties were labelled “Loudness”, “Crispness”, and “Fullness”.
“Loudness” changed the overall coupler output from 60 to 100 dB SPL in eleven steps with intervals of 3.6 dB.
“Crispness” increased spectral-slope between 1 and 4 kHz from 0 to 8 dB per octave in four steps with intervals of 2 dB per octave.
“Fullness” attenuated frequencies below 500 Hz from 0 to 20 dB in four steps with intervals of 5 dB.
The procedure and the program were named “Goldilocks”. The three adjustments followed a well-established pattern of volume, treble, and bass (e.g. Dreschler et al., 2008). There were, however, two novel aspects of the Goldilocks protocol:
To facilitate learning of the associations between parameter change and the resulting sensation, users were initially presented with only one adjustment at a time;
To increase the influence of intelligibility on acceptance criteria, participants took a speech perception test under their first self-adjusted condition and were then allowed to repeat the self-adjustment.
More details on the software and the protocol, including on-screen instructions, can be found in Boothroyd and Mackersie (2017).
Signal Processing
Stimuli were preprocessed to provide the desired spectra. Control of the output spectrum was accomplished in five frequency bands, with cross-over frequencies at octave audiometric frequencies. The bands were created with Finite Impulse Response filters using DADiSP software (2015). To avoid sharp steps in the output spectra, the slopes of the filter skirts were deliberately made low and, except for the low-frequency side of the first filter, were fairly constant in dB per octave across frequency, as shown in the upper panel of Figure 2.
Figure 2.
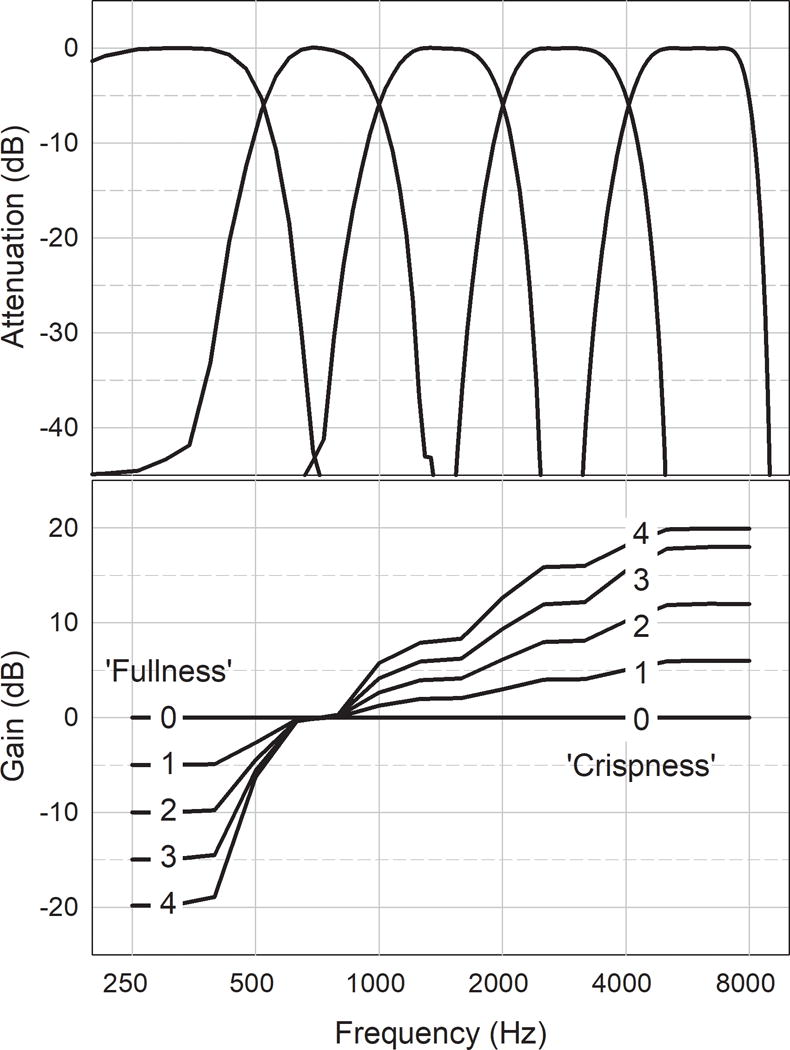
The upper panel shows the characteristics of the five filters used to generate output spectra. The lower panel shows 25 frequency responses created by combining five levels of low-frequency cut (in steps of 5 dB) with five levels of high-frequency boost (in steps of 2 dB/octave).
The lower panel of Figure 2 shows the full range of effective gain curves provided by the software. Note that low-frequency cut (Fullness) affected only the first band while high-frequency boost (Crispness) affected only bands 3, 4 and 5. Overall amplitude (Loudness) affected all bands equally. The five levels of low-frequency cut and five levels of high-frequency boost were used to create a matrix of 25 spectra1. These spectra were imposed on 100 recorded sentences to be used during user-adjustment and speech-perception testing. Signal processing was accomplished using DADiSP and the pre-processed files were incorporated into the Goldilocks program. The user’s adjustment of “Crispness” and “Fullness” determined the spectral shape of the speech being heard during self-fitting. The user’s adjustment of “Loudness“ controlled the gain of the computer’s sound card.
Speech materials
The speech heard during self-adjustment, and for speech-perception testing, consisted of 100 short, meaningful sentences developed, spoken, and recorded by Charles Ruby for an earlier project (Ruby, 2015). Each sentence contains four monosyllabic words (e.g. “Kings wear gold crowns”). Ten sentences constitute a single set and there are 10 sets. No word is replicated in the 400-word corpus. The sentences were recorded at a sampling rate of 44,100 Hz and 24-bit resolution but were down-sampled to 22,050 Hz and 16 bits for processing and inclusion in the Goldilocks software.
Instrumentation
Goldilocks was installed on a Microsoft Surface Pro 3 computer. Audio output was taken from the computer’s docking station. An Etymotic HF5 earphone served as output transducer and was coupled to the test ear by closed 3-flange soft plastic ear tips. Pure-tone thresholds were determined using a Grason-Stadler GSI-61 audiometer and Etymotic ER-5 insert earphones. The Audioscan Verifit 1 was used to complete real-ear and coupler measurements.
Procedure
The ear that best met an inclusion criterion of mild to moderately-severe hearing loss was selected for the study. If both were suitable, one was selected with a view to maintaining a balance of right and left ears. The thresholds for the test ear were entered into the Verifit for computation of NAL-NL2 target outputs using a conversational speech input level of 65 dB SPL. Individual real-ear output of the HF5 earphone was compared with the coupler output to provide a Real-Ear-to-Coupler-Difference (RECD). Real-ear aided responses were measured for the experienced hearing-aid users with their existing aids adjusted to their preferred settings.
All participants began the self-adjustment process from a generic starting condition providing a coupler output level of 67 dB SPL, 10 dB of attenuation below 500 Hz, and 4 dB/octave boost above 1 kHz. This condition was selected to approximate an NAL-NL2 prescription for a typical mild-to-moderate hearing loss increasing from 30 to 50 dB between 500 and 2000 Hz.
During self-adjustment, a single sentence set of 10 sentences (not used for testing) was played continuously and repeatedly. No effort was made to focus the listener’s attention on quality, comfort, or intelligibility. The on-screen instructions simply asked listeners to adjust each parameter “to your liking” and “push ‘ok’ when you are satisfied”. To facilitate learning, the loudness, crispness and fullness controllers were initially presented to participants one at a time. Participants were encouraged to use the up and down arrows to explore the effects of each control. When they were satisfied, they selected the “ok” button and then the next controller appeared. After the participants made changes and pressed ‘ok’ for all three controllers in isolation, they were then shown all controllers together and were given a final opportunity to make final adjustments to any or all parameters (see Boothroyd & Mackersie, 2017). After an initial self-adjustment, 30 sentences (3 sets, not heard during self-adjustment) were presented under the initial self-selected conditions and participants were asked to repeat as much as they could of each one. No feedback was given but listeners were clearly aware of any recognition difficulties. Performance was scored as the percentage of words correctly repeated. Beginning again with the generic starting condition, the self-adjustment was repeated followed by a second administration of the speech-perception test with 30 new sentences.
Analysis
Each user-adjustment generated three parameters which were logged for each step of the self-fitting process:
Volume V (in steps from 2 to 13, controlling overall level)
Fullness L (in steps from 0 to 4, controlling low-frequency attenuation below 500 Hz)
Crispness H (in steps from 0 to 4, controlling high-frequency gain slope above 1000 Hz)
These parameters were used to compute gains, in each of the five frequency bands, for three conditions: Start, Adjust1, and Adjust 2. Gains at intermediate frequencies were estimated by interpolation. Adding the gains to the half-octave spectrum of the unprocessed speech provided estimates of the long-term average of the output speech spectrum. These data were combined with the coupler response of the output transducer and individual real-ear to coupler differences (RECD) to provide estimates of real-ear output responses that could be compared with each other and with those prescribed by NAL-NL2.
For estimates of audibility, the differences between outputs at half-octave intervals and pure tone SPL thresholds (measured or interpolated) were then weighted with a frequency-importance function and summed to generate estimates of Speech Intelligibility Index (SII). These indices were based on the ANSI formula which assumes that contributions to SII are uniformly distributed across a 30 dB amplitude range centered at the average speech level in each frequency band (ANSI/ASA, R2012).
Data were analyzed using repeated-measures analyses-of-variance (ANOVA). Geisser-Greenhouse corrections to degrees of freedom were applied as needed to adjust for violations in sphericity. Newman-Keuls post-hoc tests were used to analyze significant main effects and interactions.
Results
Output responses
Figure 3 shows group-mean real-ear output levels, in half-octave bands, for the Start, Adjust 1, and Adjust 2 conditions. Data for the 13 aid-users and 13 non-users are shown in the upper and lower panels, respectively. Shaded areas show group means (±2 standard errors) for the NAL-NL2 half-octave prescriptions for a conversational speech input level of 65 dB SPL. For the aid-users, performance with existing hearing aids is shown in the upper panel by the heavy solid line.
Figure 3.
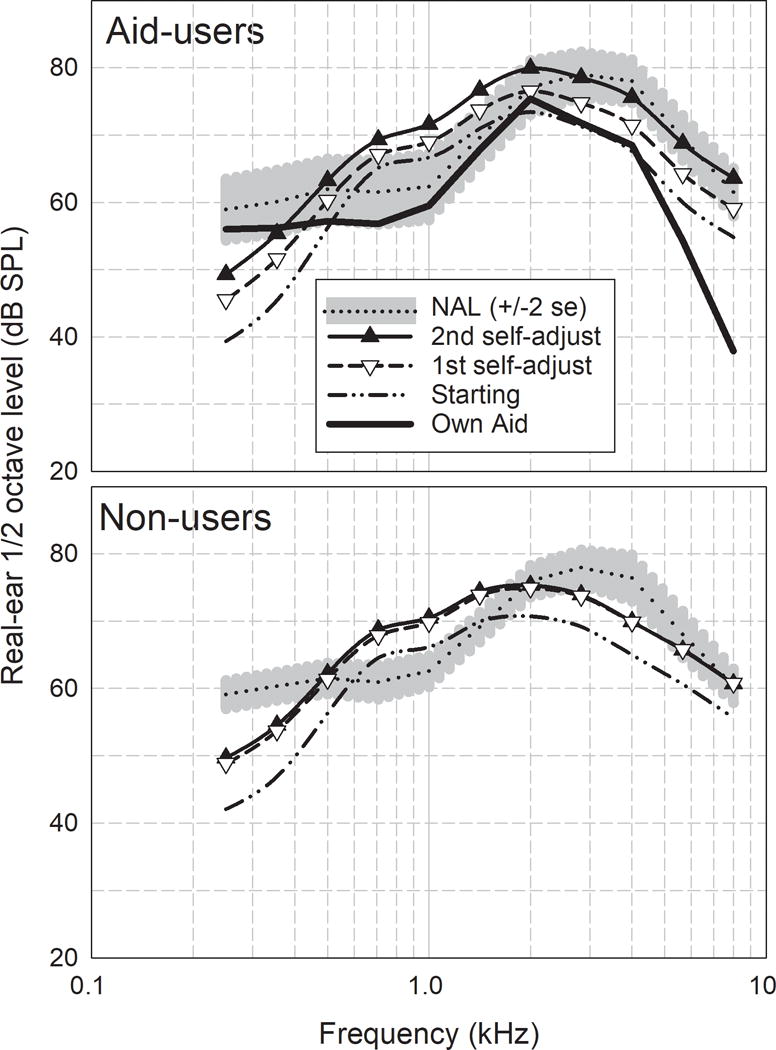
Group-mean half-octave levels for the generic starting condition, two self-adjustments and the NAL-NL2 prescribed output for the experienced aids users (top) and non-users (bottom). Real-ear aided responses of the users’ own aid are shown as a thick solid line (top panel).
Inspection of Figure 3 suggests that the mean selected outputs for both groups were higher after the first adjustment than the starting values. After taking the speech-perception test, the hearing-aid users appeared to make further increases of output, but the non-users did not. For the aid-users, the output of their own aids was below the second self-adjustment at frequencies above 500 Hz. It was also below the NAL prescription at frequencies above 1500 Hz.
To address interdependencies among frequencies, analysis of variance was restricted to outputs at only three frequencies: 345, 707, and 2828 Hz. These were representative of low, mid, and high frequencies and reflected the three user adjustments of Fullness, Volume, and Crispness. Because there were no aided data for the non-users, separate planned analyses were carried out for the two groups.
Aid users
Table 1 shows, for aid-users, repeated-measures analysis of variance in the output data using listening condition (Aid, Start, Adjust1, Adjust 2, and NAL) and frequency as within-subject factors. In addition to significant main effects of condition and frequency, there was a significant interaction between the two. Post-hoc analysis of the interaction indicated that for all three frequencies, there was a significant increase from the Start to Adjust 1. On average, the experienced aid users made further significant increases at Adjust 2 to both the low and high frequencies (354Hz, 2828 Hz, p =0.003), but not to the mid frequency (707 Hz).
Table 1.
Analysis of variance in outputs at three frequencies, under five conditions, for 13 aid-users.
| Source of Variance | Sum of Squares | Degrees Of Freedom | Estimated Mean Square | F ratio | p level | Partial eta Squared |
|---|---|---|---|---|---|---|
| Condition | 1575.9 2627.7 |
3.0 36.5 |
394.0 54.7 |
7.197 | 0.006 | 0.37 |
| Frequency | 14568.5 934.0 |
1.4 16.1 |
7284.3 38.9 |
187.176 | <.0005 | 0.94 |
| C*F | 1943.6 959.9 |
3.0 36.5 |
242.9 10.0 |
24.297 | <.0005 | 0.67 |
The mean outputs of users’ own hearing aids were significantly lower than Adjust 1 at 707 and 2828 Hz and significantly above at 707 Hz. At Adjust 2, aid-users increased output further so that the output at 354 was similar to that of their own aids (p = 0.50). In other words, the second adjustment appeared to bring the low-frequency output to a level with which the aid-users were familiar.
Relative to the NAL-NL2 prescription, Adjust 1 was significantly lower at 354 and 2828 Hz and significantly higher at 707 Hz. The high-frequency output at Adjust 2, however, was within 0.1 dB of the NAL prescription (p = 0.95).
These data support the conclusion that, after taking the speech-perception test (though not necessarily because of it), the aid users increased high-frequency boost as well as overall level, perhaps to improve intelligibility. They also support the conclusion that their initial self-adjustment could have been influenced by the familiar characteristics of their existing hearing aids.
Non-users
Table 2 shows, for non-users, repeated-measures analysis of variance in the output data using listening condition (Start, Adjust1, Adjust 2, and NAL) at four levels and frequency as within-subject factors at the same three levels. As with the aid-users, there was a significant interaction between condition and frequency.
Table 2.
Analysis of variance in outputs at three frequencies, under 4 conditions, for 13 non-users of hearing aids.
| Source of Variance | Sum of Squares | Degrees of Freedom | Estimated Mean Square | F ratio | p level | Partial eta Squared |
|---|---|---|---|---|---|---|
| Condition | 927.5 1700.5 |
2.3 27.5 |
405.0 61.9 |
6.54 | 0.003 | 0.353 |
| Frequency | 10304.8 1833.9 |
2.3 27.5 |
4499.9 66.8 |
67.41 | <.0005 | 0.849 |
| C*F | 1236.8 1002.5 |
2.3 27.5 |
540.1 36.5 |
14.80 | <.0005 | 0.552 |
Post-hoc analysis indicated a significant increase from Start to Adjust 1 at all three frequencies (p < 0.03). Non-users did not make further significant increases at any frequency at Adjust 2. The mean of the three outputs at Adjust 2 was significantly higher than the NAL-NL2 prescription at 707 Hz and significantly below the prescription at 354 and 2828 Hz. Unlike the aid-users, the non-users gave no evidence of a change of output at any frequency after taking the speech-perception test. Moreover, the final value of output at 2828 Hz remained significantly below the NAL prescription.
Overall output level
The ½ octave levels were summed logarithmically to provide individual estimates of overall root-mean-square (rms) level under the various conditions. Group means are shown in Table 3 and illustrated in Figure 4.
Table 3.
Overall rms real-ear output levels for aid-users and non-users under the various listening conditions.
| Condition | Aid-users Rms Output | Std.err. | Non-users Rms Output | Std.err. |
|---|---|---|---|---|
| Own Aid | 79.2 | 1.49 | – | – |
| Start | 78.7 | 0.50 | 77.0 | 0.39 |
| Adjust 1 | 81.8 | 2.10 | 82.0 | 1.90 |
| Adjust 2 | 85.2 | 2.18 | 82.1 | 1.63 |
| NAL-NL2 | 83.5 | 1.78 | 82.6 | 1.23 |
Figure 4.
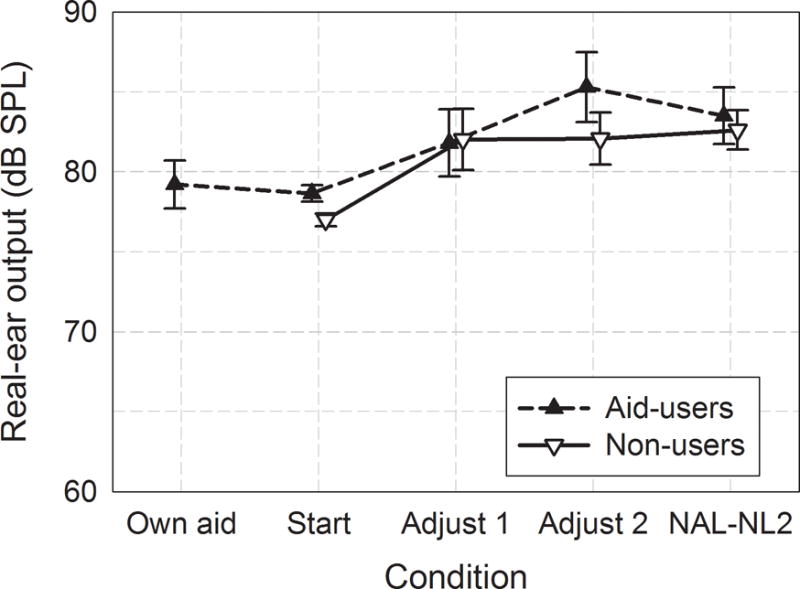
Overall rms output levels as functions of the listening condition. Error bars show ± 1 standard error.
For the aid users, a repeated-measures ANOVA, with Greenhouse-Geiser corrections for nonsphericity, indicated a significant main effect of condition (F[3.0, 35.4] = 5.8, p = .003). Newman Keuls post-hoc testing indicated that the mean starting level was not significantly different from Adjust 1. Adjust 2, however, was significantly higher than both the starting level the level of the users’ own aid.
In repeated-measures analysis of variance in the data for the non-users, the main effect of condition was also significant (F[2.1,24.8] = 6.1, p = .007). In post-hoc testing (Newman Keuls), the starting condition was significantly below the others (p < .005) but the differences between Adjust 1, Adjust 2, and NAL failed to reach the .05 level of significance. In other words, the initial self-adjustment of the non-users brought overall level to a value that was not-significantly different from the NAL prescription and there was no evidence that they changed level after taking the speech perception test.
Audibility
The overall rms output data give equal power weighting across frequency. Speech-intelligibility, however, is heavily dependent on frequencies from 1 to 4 kHz. Figure 5 shows group mean Speech Intelligibility Index contributions, as a function of frequency, for the two groups and the four conditions of interest. Aided data for the aid-users are also shown in the upper panel. To obtain these values, 15 dB was added to the sensation level in each band and the sum was divided by 30, with lower and upper limits of 0 and 1. The results were then multiplied by the frequency-importance function and expressed as a percentage contribution. For aid-users, the mean contribution to self-adjusted SII was not significantly different from the NAL prescription at frequencies above 500 Hz. For non-users, however, the mean contribution to self-adjusted SII fell below the NAL prescription at 2828 and 4000 Hz.
Figure 5.
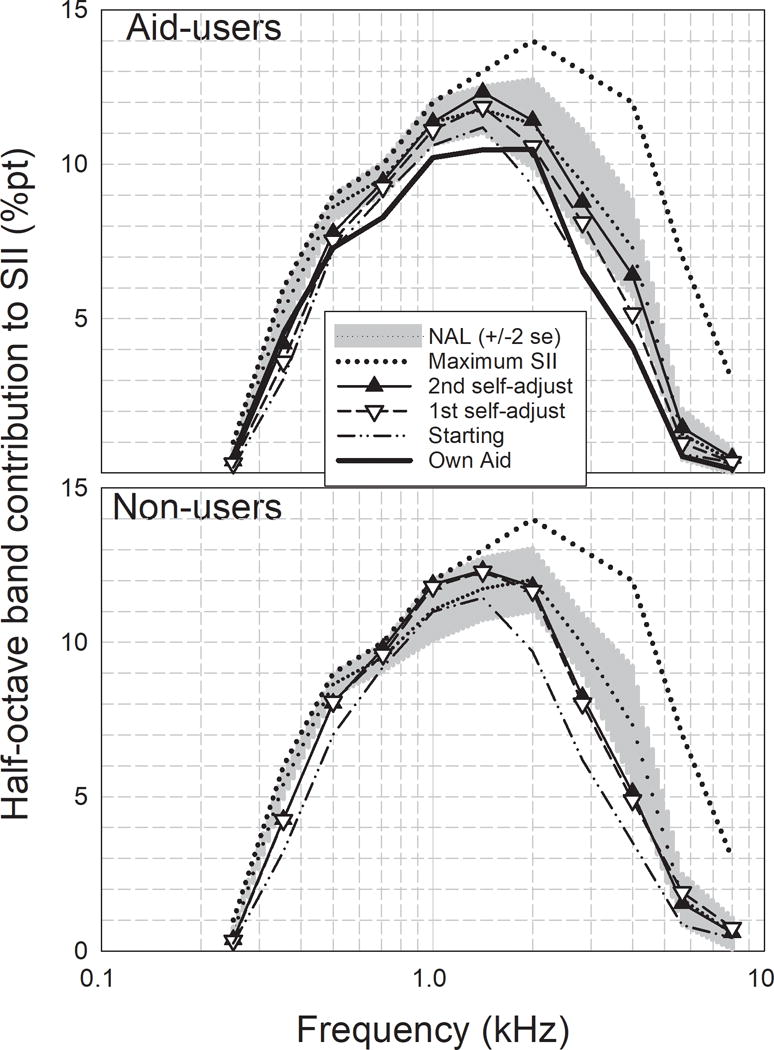
Half-octave band contributions to SII for the starting and self-adjusted conditions. The shaded area shows the NAL-NL2 prescription (± 2 std.err.), The dotted line shows the frequency-importance function which represents the maximum possible contribution in each band.
Estimates of frequency-specific contributions to SII were summed to provide a single value for each participant under each listening condition. Means and standard errors are shown for the two groups in Figure 6. As with the output data, separate analyses of variance were carried out for the two groups. Both showed significant effects of condition (p = .007 and .002 for the aid-users and non-users, respectively).
Figure 6.
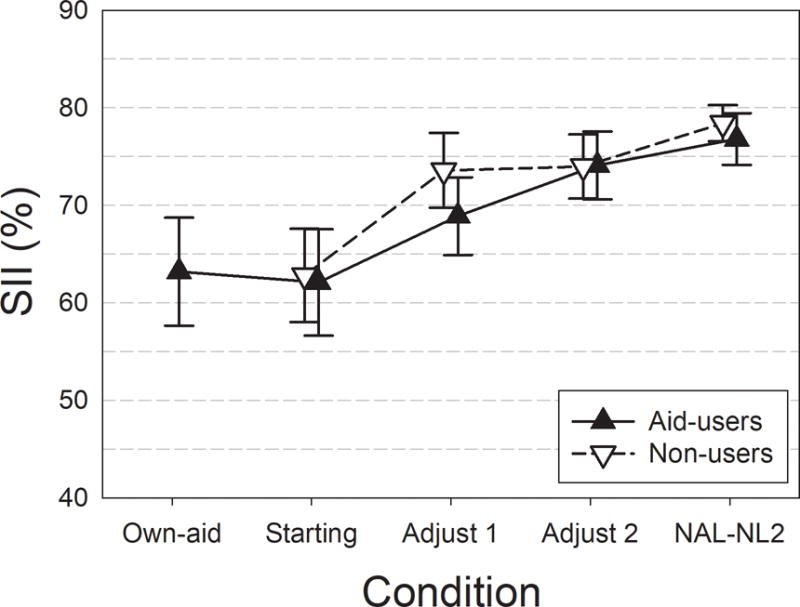
Group-mean SII for aid-users and non-users as functions of the listening conditions. Error bars show ± 1 std.err.
In post-hoc analysis of the aid-users’ data, differences among own-aid, Start, and Adjust 1 failed to reach the 5% level of significance. Adjust 2, however, was significantly higher than Start and not significantly different from the NAL prescription. In post-hoc analysis of the non-users’ data, there was a significant difference from start to adjust 1 (p = .007) but no evidence of differences among Adjust 1, Adjust 2, or NAL.
In summary, the final self-adjustments brought both groups to mean SII values that were not significantly different from the threshold-based prescription. Mean SII for the non-users was already well above the starting value after the first adjustment and did not change after taking the speech-perception test. Mean SII for the aid users, however, was not significantly higher than the starting value until after taking the speech-perception test. These conclusions are in keeping with those based on overall rms level.
Word recognition
The sentence-level speech-perception test chosen for this study was not sensitive to differences between groups and conditions. Many participants scored at or close to 100 % and, even with arcsine transformation, there was no evidence of a significant improvement between the first and second self-adjustments. As expected, however, there was a significant relationship between word recognition and speech intelligibility index. This relationship is illustrated in Figure 7, using data obtained after the second and final self-adjustment. Different symbols are used for aid-users and non-users. The curve shows a least-squares fit of all the data to an exponential growth function with an asymptote at 100%. It will be seen that an SII of 60% predicts a group-mean word recognition score in excess of 95% for these materials and the population represented by this participant sample. This criterion was used to examine individual differences.
Figure 7.
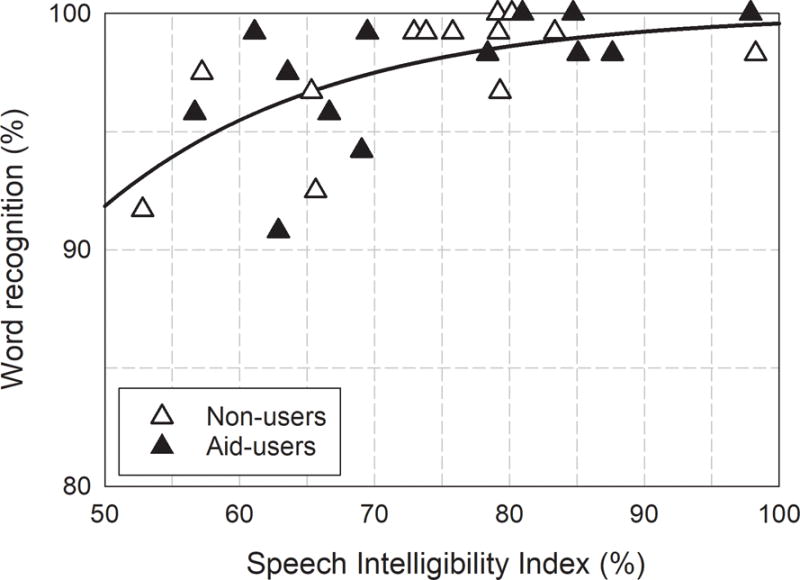
Word recognition as a function of Speech Intelligibility Index after the second self-adjustment. The line shows a least-squares fit of the 26 data points to an exponential growth function. An SII of 60% predicts an average word-recognition score in excess of 95%.
Individual differences
In the foregoing analyses, individual differences are either relegated to error variance in the group comparisons or are minimized in repeated measures. Figure 8, however, shows individual values of starting and self-adjusted SIIs in relation to the NAL-NL2 prescriptions. Also shown are the number of participants whose SII fell at or above the criterion of 60% referred to above. Data for the aid-users and non-users are shown on the left and right, respectively.
Figure 8.
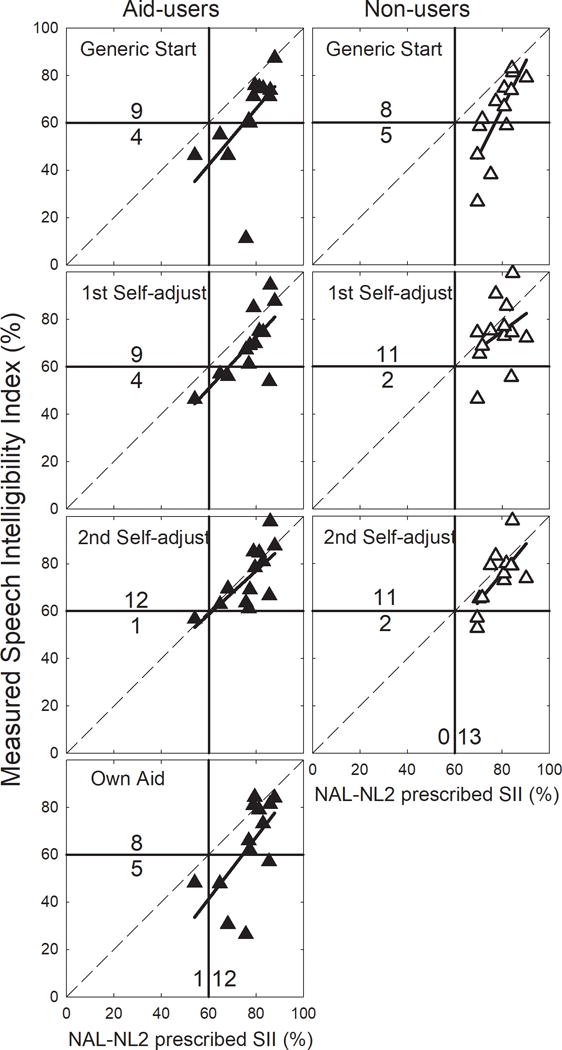
Individual starting and self-adjusted SIIs as functions of NAL-NL2 prescribed SII. The number of participants falling above and below an SII criterion of 60% are shown. Solid lines show regression functions for measured versus prescribed SII.
Seventeen of the 26 participants (65%) attained an SII of 60% or higher under the starting condition. This proportion increased to 23/26 (88%) after the second self-adjustment. The change reached the .05 level of significance (χ2[1] = 3.9; p = .046) but there was no evidence that the proportions were different for the aid-users and the non-users.
For the aid-users, the proportion meeting the 60% criterion with their existing hearing aids was 8/13 (62%). This proportion barely changed after the first self-adjustment but rose to 12/13 (92%) after the second. The difference between existing aids and second adjustment approached the .05 level of significance (χ2[1] = 3.5; p = .063).
Using the criteria of ± 5 dB RMS from target as suggested by McCreery et al. (2013), 77% (10/13) of the hearing-aid users’ aids were within the target value. The three participants whose hearing-aid response did not meet the ± 5 dB RMS criterion had more severe hearing losses. There was a strong correlation between the hearing aid SII and the average high-frequency hearing loss (1, 2, 4 kHz) (r= −.80, p = 0.001).
Details regarding listeners’ hearing aids, were available for 11 of the 13 participants. This information can be found in a Table (Supplemental Digital Content 2). All participants were fit at a clinic that uses best-practices, including verification and adjustment to targets using real-ear measures. As part of the fitting protocol, post-fitting adjustments are often made to accommodate patient comfort, which could include a reduction in gain and/or maximum output. Detailed clinical information regarding post-fitting adjustments, however, was not available.
It will be noted that the NAL-NL2 prescribed SII exceeded the 60% criterion for all but one of the 26 participants. The exception was an aid user with a precipitous high-frequency hearing loss reaching 80 dB at 2k Hz and no measurable hearing at 4 and 8 kHz. The number of participants who exceeded the 60% criterion for the NAL-NL2 prescription (25/26) was not significantly different from the number of participants who exceeded the 60% criterion for the second adjustment (23/26) (p = .61, Fisher’s exact Test).
Of particular note are the regression functions relating attained SII to prescribed SII. After the second self-adjustment, the function is close to the diagonal for both participant groups. For the aid-users using their existing hearing aids, however, the function is as much as 20 percentage points below the diagonal. These data support the conclusion that the aid-users were used to listening with less than optimal audibility but, when given the opportunity, were willing and able to increase it.
Discussion
The first research question addressed self-adjusted change from a generic starting condition. With the generic starting condition used here, 65% of participants attained an SII of 60% of more. This finding suggests that suitably designed direct-to consumer hearing aids and other amplification products could provide adequate, though not necessarily ideal, benefit for a substantial proportion of the population of potential users, even without self-adjustment. With self-adjustment, however, group mean outputs and SII increased significantly and 23 participants (88%) arrived at SII levels of 60% or more, a level consistent with at least 95% recognition of the words in the sentences used here. These findings coupled with the previous findings that a single self-adjustment can be completed in less than two minutes (Boothroyd & Mackersie, 2017) augur well for the success of user self-adjustment of direct-to-consumer hearing aids. Application of self-adjustment procedures such as that used here need not, however, be restricted to direct purchase. Enabling user exploration and control of amplification parameters under varied input conditions, both in a controlled clinical environment and in the real world, could help improve both evaluation and fitting outcome within audiological practice.
Demonstration of the viability of self-adjustment of amplification is not new. Included in previous studies was the basic process used here – that is, providing listeners with control of volume, treble, and bass (e.g. Dreschler et al., 2008). But instantiation of this approach in the Goldilocks software added two features that were designed to increase effectiveness. The first was the initial presentation of the three adjustment parameters in isolation – intended to speed learning. The second was the inclusion of a speech-perception test – intended to increase attention to intelligibility. Further work will seek to determine whether either of these features actually influence the outcome of user self-adjustment. Exploration of self-adjustment will also be extended to other hearing-aid parameters such as amplitude compression and noise management.
The second research question addressed the relationship between self-adjusted output and an NAL-NL2 prescription. The spectral shapes for the starting and self-adjusted conditions were different from prescription (see Figure 3). Participant adjustments, however, were constrained by the need to map three self-adjustment parameters onto outputs in five frequency-bands. In the mapping chosen for this study, the high-frequency changes controlled only the spectral slope above 1000 Hz. Changes in this mapping could match prescriptions more closely. In spite of the differences of spectral shape, however, the mean self-adjusted SIIs were not significantly different from prescription. Note also that there was no significant difference between the number of participants who met the 60% SII criterion with the second adjustment and that prescribed by NAL-NL2. These findings suggest that self-adjusted outputs starting from a generic response could be similar to self-adjusted output starting from a prescription-based response. Further work is needed, however, to directly test the outcomes of self-adjustments using different starting responses.
The third research question dealt with the influence of hearing-aid experience. In terms of the final self-adjustment the resulting mean SIIs for the two groups were virtually identical. As a group, however, the hearing-aid users made small but significant increases of output and high-frequency slope after taking the speech-perception test. The non-users did not. It is possible that, at the first adjustment, the aid-users tended to match output to that provided by their own hearing aids which was, in fact, below prescription (see Figures 3–6). It is also possible that the experience of the aid users with the speech perception test encouraged them to explore higher outputs. An alternative explanation is that repetition of the self adjustment procedure led to the selection of a more appropriate output. We are currently examining these factors more closely using a group design to examine the effects of practice (control) versus exposure to the speech perception test on self-adjusted output.
The fifth research question dealt with results of self-adjustment in relationship to existing hearing aids. As already indicated, the mean real-ear output of existing hearing aids was significantly below the final self-adjustment. It was also significantly below the NAL prescription even though all participants were fit using best practices, including real-ear verification and fine tuning. The strong negative correlation between the SII for users’ own aids and the high-frequency thresholds supports the suggestion that the severity of the high-frequency loss was a limiting factor in reaching targets with their own aids.
The fine-tuning involved in the typical hearing-aid fitting process is based on the user’s experience in real world environments, often with sub-optimal listening conditions. A preference for hearing-aid settings that provide less than optimal intelligibility under ideal listening conditions might well be influenced by comfort, sound quality, and noise tolerance. In contrast, the present study involved a single male talker producing clear speech at a constant level in quiet. The willingness of the aid-users to accept higher outputs under these more ideal, and more predictable, conditions is understandable. Future studies of self-adjustment will include noise and a variety of speech inputs encompassing the range from self-generated speech to quiet conversation.
The similarity of group-mean hearing thresholds for listeners with and without hearing-aid experience was surprising. One can only assume that the non-users had adopted coping strategies they had so far found acceptable. The fact that twelve of the thirteen volunteered for this study in response to newspaper advertisements, however, indicates awareness of hearing difficulties and suggests readiness to consider action or, at least, obtain more information. In fact, several of the non-users acquired aids after participating in this study. In informal discussion, the reasons against acquiring hearing aids earlier included lack of knowledge about the mechanisms and resources available and concern about being pressured into purchasing expensive devices whose potential benefits were uncertain. How representative this sample is of the population of individuals who might acquire direct-to-consumer hearing aids is uncertain.
Conclusions
Although there are many questions unanswered, the results of this study provide evidence in support of the following conclusions:
User self-adjustment of hearing-aid characteristics is feasible for a significant proportion of the population of persons with hearing loss who could benefit from amplification.
The results of self-adjustment, in terms of output level and spectrum, can approach those of a widely used threshold-based prescription.
Previous experience with hearing aids is not necessary for successful self-adjustment.
Supplementary Material
Acknowledgments
Conflicts of Interest and Funding Sources: Funded by NIDCD grant number R21DC015046 and R33DC015046 to San Diego State University (Dr. Carol Mackersie, PI, and Harinath Garudadri, University of California San
Footnotes
The last step of high-frequency boost in bands 4 and 5 was lowered in an attempt to minimize peak clipping in the higher frequencies.
References
- ANSI/ASA. S3.5-1997 American National Standard Methods for Calculation of the Speech Intelligibility Index R2012 [Google Scholar]
- Boothroyd A, Mackersie CL. A “Goldilocks” approach to hearing-aid self-fitting: user interactions. Am J Audiology. 2017;26:430–435. doi: 10.1044/2017_AJA-16-0125. [DOI] [PMC free article] [PubMed] [Google Scholar]
- Convery E, Keidser G, Dillon H, Hartley L. A self-fitting hearing aid: need and concept. Trends Amplif. 2011;15:157–166. doi: 10.1177/1084713811427707. [DOI] [PMC free article] [PubMed] [Google Scholar]
- Convery E, Keidser G, Seeto M, McLelland M. Evaluation of the Self-Fitting Process with a Commercially Available Hearing Aid. J Am Acad Audiol. 2017;28:109–118. doi: 10.3766/jaaa.15076. [DOI] [PubMed] [Google Scholar]
- Convery E, Keidser G, Seeto M, Yeend I, Freeston K. Factors affecting reliability and validity of self-directed automatic in situ audiometry: implications for self-fitting hearing AIDS. J Am Acad Audiol. 2015;26:5–18. doi: 10.3766/jaaa.26.1.2. [DOI] [PubMed] [Google Scholar]
- DADiSP. Version 6.7 [Computer software] Newton, MA, USA: DSP Corporation; 2015. [Google Scholar]
- Dreschler WA, Keidser G, Convery E, Dillon H. Client-based adjustments of hearing aid gain: the effect of different control configurations. Ear Hear. 2008;29:214–227. doi: 10.1097/AUD.0b013e31816453a6. [DOI] [PubMed] [Google Scholar]
- Keidser G. The relationship between listening conditions and alternative amplification schemes for multiple memory hearing aids. Ear Hear. 1995;16:575–586. doi: 10.1097/00003446-199512000-00004. [DOI] [PubMed] [Google Scholar]
- Keidser G, Alamudi K. Real-life efficacy and reliability of training a hearing aid. Ear Hear. 2013;34:619–629. doi: 10.1097/AUD.0b013e31828d269a. [DOI] [PubMed] [Google Scholar]
- Keidser G, Brew C, Brewer S, Dillon H, Grant F, Storey L. The preferred response slopes and two-channel compression ratios in twenty listening conditions by hearing-impaired and normal-hearing listeners and their relationship to the acoustic input. Int J Audiol. 2005;44:656–670. doi: 10.1080/14992020500266803. [DOI] [PubMed] [Google Scholar]
- Keidser G, Convery E. Self-Fitting Hearing Aids: Status Quo and Future Predictions. Trends Amplif. 2016;20 doi: 10.1177/2331216516643284. [DOI] [PMC free article] [PubMed] [Google Scholar]
- Keidser G, Dillon H, Convery E. The effect of the base line response on self-adjustments of hearing aid gain. J Acoust Soc Am. 2008a;124:1668–1681. doi: 10.1121/1.2951500. [DOI] [PubMed] [Google Scholar]
- Keidser G, Dillon H, Convery E. The effect of the base line response on self-adjustments of hearing aid gain. J Acoust Soc Am. 2008b;124:1668–1681. doi: 10.1121/1.2951500. [DOI] [PubMed] [Google Scholar]
- Keidser G, O’Brien A, Carter L, McLelland M, Yeend I. Variation in preferred gain with experience for hearing-aid users. Int J Audiol. 2008;47:621–635. doi: 10.1080/14992020802178722. [DOI] [PubMed] [Google Scholar]
- Kuk FK, Lau C. Effect of initial setting on convergence to optimal hearing aid setting using a simplex method. Br J Audiol. 1995;29:263–269. doi: 10.3109/03005369509076741. [DOI] [PubMed] [Google Scholar]
- Kuk FK, Pape NM. Relative satisfaction for frequency responses selected with a simplex procedure in different listening conditions. J Speech Hear Res. 1993;36:168–177. doi: 10.1044/jshr.3601.168. [DOI] [PubMed] [Google Scholar]
- Levitt H, Neuman A, Mills R, Schwander T. A digital master hearing aid. J Rehab Res Dev. 1986;23:79–87. [PubMed] [Google Scholar]
- Levitt H, Sullivan JA, Neuman AC, Rubin-Spitz JA. Experiments with a programmable master hearing aid. J Rehab Res Dev. 1987;24:29–54. [PubMed] [Google Scholar]
- Mahomed F, Swanepoel DW, Eikelboom RH, Soer M. Validity of automated threshold audiometry: a systematic review and meta-analysis. Ear Hear. 2013;34:745–752. doi: 10.1097/01.aud.0000436255.53747.a4. [DOI] [PubMed] [Google Scholar]
- McCreery R, Bentler R, Roush P. Characteristics of hearing aid fittings in infants and young children. Ear Hear. 2013;34:701–710. doi: 10.1097/aud.0b013e31828f1033. [DOI] [PMC free article] [PubMed] [Google Scholar]
- Mueller HG, Hornsby BWY, Weber JE. Using trainable hearing aids to examine real-world preferred gain. J Am Acad Audiol. 2008;19:758–773. doi: 10.3766/jaaa.19.10.4. [DOI] [PubMed] [Google Scholar]
- Nasreddine ZS, Phillips NA, Bédirian V, Charbonneau S, Whitehead V, Collin I, Chertkow H. The Montreal Cognitive Assessment, MoCA: a brief screening tool for mild cognitive impairment. J Am Geriatr Soc. 2005;53:695–699. doi: 10.1111/j.1532-5415.2005.53221.x. [DOI] [PubMed] [Google Scholar]
- Neuman AC, Levitt H, Mills R, Schwander T. An evaluation of three adaptive hearing aid selection strategies. J Acoust Soc Am. 1987;82:1967–1976. doi: 10.1121/1.395641. [DOI] [PubMed] [Google Scholar]
- Zakis JA, Dillon H, McDermott HJ. The design and evaluation of a hearing aid with trainable amplification parameters. Ear Hear. 2007;28:812–830. doi: 10.1097/AUD.0b013e3181576738. [DOI] [PubMed] [Google Scholar]
Associated Data
This section collects any data citations, data availability statements, or supplementary materials included in this article.


