Capsule Summary:
In a cohort of African American adolescents with persistent asthma on guidelines-based daily controller therapies, short–term elevation of low ozone levels below the National Ambient Air Quality Standard of 70 ppb were associated with lung function decrements and elevated lipid levels.
Keywords: Ozone, adolescent, asthma, controller therapies, African-American, spirometry, lipids, pollution
To the Editor:
Short-term exposure to ambient air ozone has long been recognized to have adverse respiratory effects, leading the Environmental Protection Agency (EPA) to lower the 8-hour National Ambient Air Quality Standard (NAAQS) to 70 parts per billion (ppb) in 2015 (1). Although short-term ozone exposure has been shown to affect respiratory outcomes, recent murine and human studies in adults have also suggested that ozone has systemic effects, including altered low-density lipoproteins (LDL)(2).
Minorities often live in low-income, urban housing in areas with increased exposure to both indoor and outdoor pollution, increasing their risk for pollutant-induced disease. In this report, we examined the respiratory and systemic response of African-American adolescents with persistent asthma, a high-risk group for pollutant-related asthma morbidity (3), to changes in ambient air ozone at levels below the NAAQS.
Twenty-three African-American teens, ages 12–17, with persistent asthma were recruited from the Allergy/Immunology and Pediatric Pulmonary clinics located in Raleigh, NC. Asthma medication use was reviewed and optimized for all patients at the baseline visit, including inhaler with spacer technique. The work described was carried out in accordance with The Code of Ethics of the World Medical Association (Declaration of Helsinki), approved by the UNC Institutional Review Board and the EPA Human Protocols Office, and posted on Clinicaltrials.gov (NCT01891630). Written informed consent was obtained from parents and assent obtained from all participants prior to enrollment.
Each participant completed six study visits between August 2013 and October 2014, for a total of 138 person-observation times (Table EI). Visits were spaced a week apart on the same day of the week and time of day (~3 pm) to minimize day-of-week or time-of-day confounding. At each visit spirometry was performed using American Thoracic Society guidelines (4). Blood, drawn at each visit, was sent to a clinical laboratory (LabCorp., Burlington, NC, USA) to obtain non-fasting blood lipids.
Table EI.
Study Participants Characteristics
| All Subjects | ||
|---|---|---|
| Total visits | 138 | |
| Sex | ||
| Females | 8 | |
| Males | 15 | |
| Age | ||
| Mean (± SD) years | 14.0 (1.9) | |
| range | 12–17 | |
| BMI | ||
| greater than 85%tile for age | 48% | |
| greater than 95%tile for age | 26% | |
| Asthma Control | ||
| Physician diagnosed control at baseline | 61% | |
| Exposure to Tobacco Smoke | ||
| Yes | 13% | |
| Family Income | ||
| Less than 30,000 | 57% | |
| 31,000 or more | 30% | |
| Undetermined | 13% | |
| Highest education of either parent/guardian | ||
| more than High School diploma | 26% | |
| high school diploma or less | 74% | |
| Allergies † | ||
| Foods (e.g., tree, nuts, peanuts, fruit, shellfish, soy) | 35% | |
| Seasonal or dust | 65% | |
| Drug | 35% | |
| None | 17% | |
| IgE (UI/mL) | ||
| Mean ± SD | 501.4 (616.1) | |
| Range | (7, 1964) | |
| # missing | 7 | |
| Asthma Therapy (N) ˚ | ||
| Step 2 therapy | 3 | |
| Step 3 therapy | 9 | |
| Step 4 therapy | 5 | |
| Step 5 therapy | 5 | |
| Step 6 therapy | 1 | |
Because individual patients may have more than one allergy, the sum of percentages does not equal 100%.
The step of therapy was classified according to the NHLBI guidelines.
Analyses used average daily exposure concentrations for exam day (lag 0) and the 4 preceding days (lags 1–4). Mean 24-hr ozone and particulate matter with a diameter of less than 2.5 micrometers (PM2.5) levels were calculated from hourly central monitor data, obtained from a monitoring station located in Raleigh (Wake County, NC). The maximum 8-hr ozone concentration (8-hr max) represents the highest 8-hr average in the relevant 24-hr period. Because the EPA-estimated 8-hr maximum (midnight to midnight) often includes the 3pm hour at which the exam occurred, we used the average daily exposure for analyses and calculated the 8-hr max for the relevant 24-hr (3pm-3pm) period.
We used a linear mixed effects model with a random participant intercept to evaluate the relationship of exposure to each continuous outcome in single pollutant (ozone), and co-pollutant models (ozone+PM2.5). Using repeated measures on each subject allowed each person to act as his/her own control in modeling procedures. All models were adjusted for temperature and relative humidity (selected a priori) corresponding to the lag of the exposure. As a sensitivity analysis, we further adjusted for season using natural spline with knots at the change of seasons; season was retained in the model if it substantially modified the effect estimate. Effect estimates are presented as changes in the outcome variable together for an interquartile range (IQR) increase in ambient ozone concentration. We visually assessed normality of model residuals, and used Cook’s distance to evaluate potential influential values or subjects. Data were analyzed using R 3.4.0 (5).
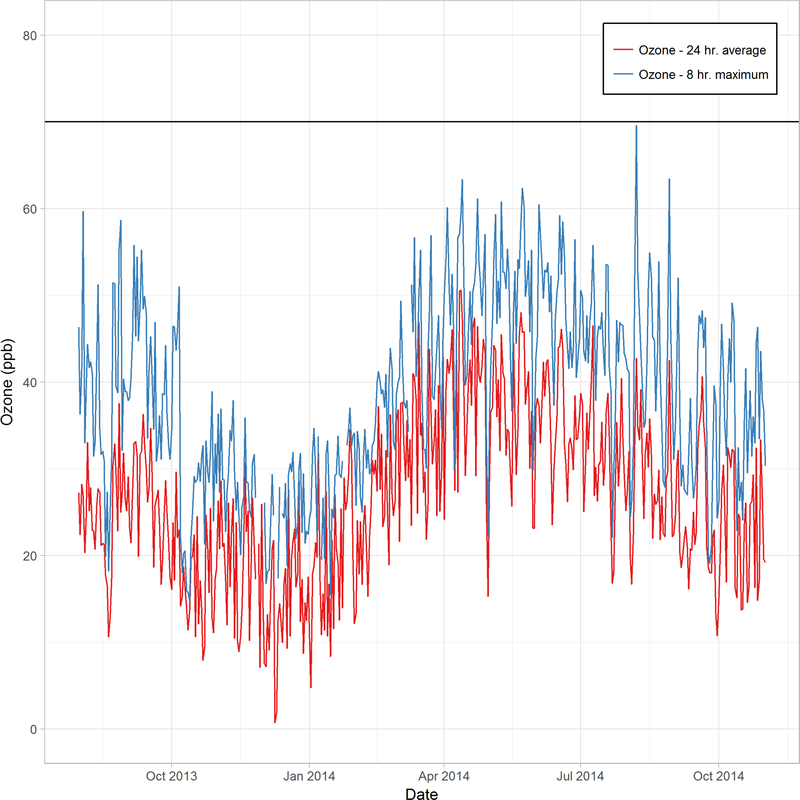
All subjects were on daily controller therapy, and most were atopic (Table EI). The average 24-hr ozone concentrations during the study period ranged from 2.0 to 50.6 ppb, with a mean value of 26.8 ppb (Figure E1, Table EII). The 8-hr maximum concentrations ranged from 14.8 to 69.6 ppb, all below the 8-hr NAAQS. PM2.5 mass concentrations during this period ranged from 0.8 to 29.6 μg/m3 (all below the NAAQS of 35 ug/m3), with a mean value of 10.9 μg/m3. Ozone and PM2.5 levels were weakly but significantly correlated (ρ=0.097, p = 0.04, Spearman correlation) during the study period.
Figure E1: Ambient ozone levels throughout the study period.
Daily ozone (ppb) concentrations 24-hr average (red line) and 8-hr maximum (blue line) from August 2013 to November 2014. Values were calculated from a central monitor. The horizontal line represents the current NAAQS for ground level ozone of 70 ppb.
Table EII.
Average daily pollutant concentrations during study periods (August 2013 -October 2014)
| Mean (SD) | Min | 25th percentile | Median | 75th percentile | Max | IQR* | |
|---|---|---|---|---|---|---|---|
| Ozone – 24-hr average (ppb) | 26.8 (9.5) | 2.0 | 19.9 | 26.3 | 33.1 | 50.6. | 16.5 |
| Ozone – 8-hr maximum (ppb) | 38.6 (10.8) | 14.8 | 30.3 | 38.6 | 46.7 | 69.6 | 18.1 |
| PM2.5 (μg/m3) | 10.9 (4.7) | 0.8 | 7.6 | 10.1 | 10.9 | 29.6 | 6.6 |
| Avg. Daily Temperature (°F) | 61.4 (15.4) | 16.4 | 48.9 | 65.3 | 61.4 | 85.8 | 20.3 |
| Relative humidity (%) | 67.9 (13.3) | 34.0 | 59.0 | 69.0 | 67.9 | 95 | 17.0 |
| Barometric pressure (hPa) | 1002.2 (5.4) | 982.7 | 998.8 | 1002 | 1002.2 | 1017.9 | 6.1 |
IQR was determined from the lag 0 values on visit days
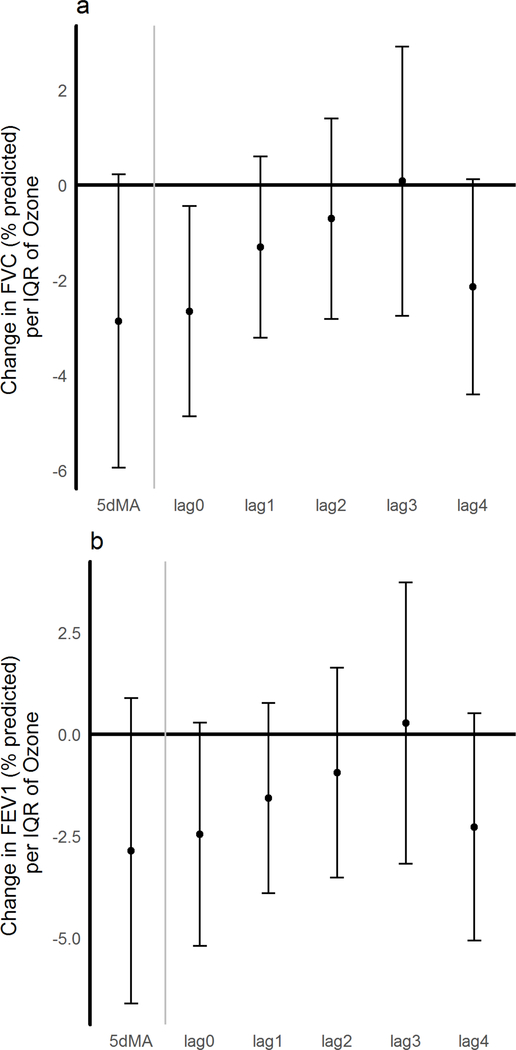
Elevations in ambient ozone concentrations were associated with reduced lung function measurements. The strongest effect was observed for ozone concentrations in the 24-hour period preceding clinic visits (lag 0), where there the % predicted FVC was 2.7 points lower (p =0.02) (Figure 1a). This decrement diminished for the preceding 24 to 48-hr period (lag 1) to 1.3 points. For the previous 5-day moving average, a decrease of 2.9 points was seen (p=0.07). For % predicted FEV1 (Figure 1b), there was a drop of 2.5 points at lag 0 (p=0.07) and a 1.6 point drop at lag 1. The effect estimates were minimally altered in the two-pollutant model, with a drop of 2.5 points in %FVC and 1.4 points in %FEV1 seen at lag 0 and lag 1, respectively.
Figure 1: Changes in lung function with ambient ozone concentrations.
A) Change in % predicted FVC; B) Change in % predicted FEV1 under a single pollutant model for ozone. Effect estimates and 95% CI are shown and correspond to changes per IQR of ozone for the day of exam (lag 0) for each of the 4 preceding days (lags 1–4), and for the 5-day moving average (5dMA). All models were adjusted for temperature, and humidity.
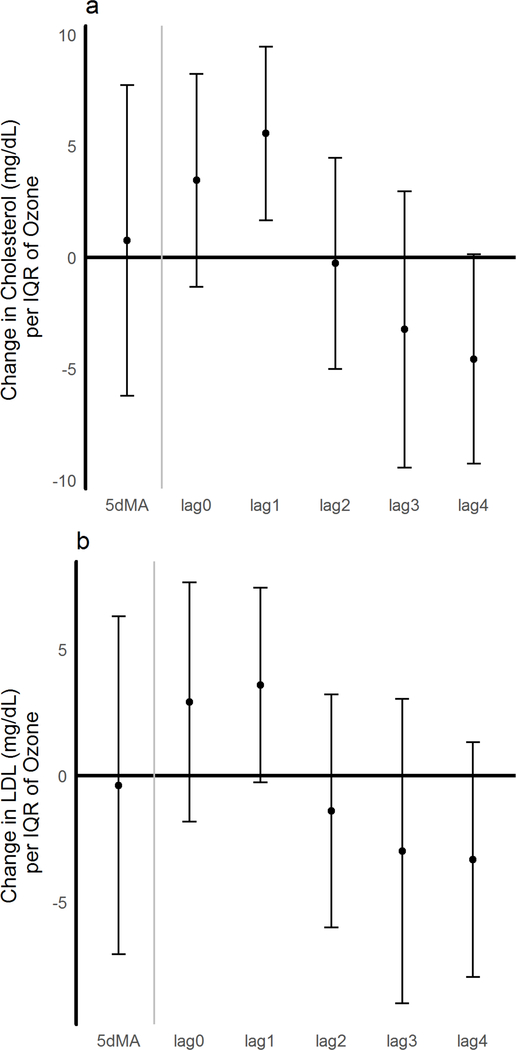
Ozone was associated with an increase in total cholesterol levels of 5.56 mg/dL at lag 1, per IQR of ozone (p<0.006) (Figure 2a); further controlling for season, the effect estimate decreased slightly to 5.21 mg/dL (p = 0.014). At the same lag 1, an association with a 3.6 mg/dL increase in LDL (p=0.06) was observed (Figure 2b). No changes in triglycerides or VLDL were observed. In all cases where significant outcomes were found in the single pollutant model, no more than 10% variation was observed in any outcome using the two-pollutant model.
Figure 2. Ozone effects on blood lipids.
A). Changes in total Cholesterol and B). LDL (mg/dL). Effect estimates and 95% CI are shown and correspond to changes per IQR of ozone for the day of exam (lag 0) for each of the 4 preceding days (lags 1–4), and for the 5-day moving average (5dMA). A single pollutant model for ozone was used and adjusted for temperature, and humidity.
Low-level increases of ambient air ozone concentrations were associated with both adverse respiratory and systemic changes in African American adolescents with persistent asthma despite guidelines-based therapy, the first report of its kind in children. Previous studies in asthmatic children have shown associations between acute exposure to high levels of ozone and decrements in lung function (6, 7). It is hypothesized that use of asthma therapies such as inhaled corticosteroids may modify the adverse effects of air pollution; here, we show that decrements in lung function are observed even at ozone levels within the current NAAQS standard of 70 ppb and with the use of daily asthma controller therapy. Given that 61% of participants were using combined inhaled corticosteroid/long-acting beta agonist therapy, we may be underestimating the association between low-level ozone exposure and diminished lung function due to the long-acting beta agonist effect.
Additionally, we demonstrate that ambient ozone exposure is associated with systemic changes in blood lipids. Though the clinical consequences of these increases in blood lipid levels are unclear, it has been proposed development of atherosclerotic cardiovascular disease is linked to increased blood lipids in adolescence (8).
The study has several potential limitations. We used central site monitoring to establish ozone concentrations rather than home or school monitoring. Since ozone has a largely homogeneous spatial distribution and participants lived within 30 miles of the monitoring station, it is unlikely to influence the results. We cannot distinguish the isolated effect of environmental allergens on lung function in our primarily atopic cohort as ozone can increase sensitivity to allergens and enhance airway eosinophilia (9). Due to this exploratory study’s small size, all findings are susceptible to influential observations, though removing no one observation or individual abolished the findings reported. Although we scheduled participants to return for study visits at the same time of day, ozone effects on blood lipid levels may be affected by dietary intake.
In summary, we show that increases in ambient air ozone at sub-NAAQS levels are associated with pulmonary and systemic changes in African-American adolescents with persistent asthma. Additionally, use of asthma controller therapies did not protect against respiratory effects. This is the first report of systemic changes associated with short-term ozone exposure in adolescents, and will need to be confirmed in larger scale studies involving more diverse groups at high risk of exposure to ambient air pollution.
Acknowledgments
We would like to thank Kristen Rappazzo for her advice with statistical analyses and James Brown for consultation on air pollution metrics.
Funding Sources: This project was supported by 5T32GM086330, CR 83578501 and internal funding from the US Environmental Protection Agency, and by the AAAAI Foundation.
Abbreviations:
- CI
Confidence Intervals
- EPA
Environmental Protection Agency
- FVC
Forced Vital Capacity
- FEV1
Forced Expiratory Volume in 1 second
- IQR
Interquartile range
- LDL
Low-density lipoproteins
- NAAQS
National Ambient Air Quality Standards
- PM2.5
Particulate Matter less than 2.5 microns
- PPB
Parts per billion
- UNC
University of North Carolina
Footnotes
Declaration of interests: The authors have declared no conflicts of interest.
Disclaimer: The views expressed in this manuscript are those of the authors and do not necessarily reflect the views or policies of the U.S. Environmental Protection Agency.
Publisher's Disclaimer: This is a PDF file of an unedited manuscript that has been accepted for publication. As a service to our customers we are providing this early version of the manuscript. The manuscript will undergo copyediting, typesetting, and review of the resulting proof before it is published in its final citable form. Please note that during the production process errors may be discovered which could affect the content, and all legal disclaimers that apply to the journal pertain.
References
- 1.EPA. US. Integrated Science Assessment of Ozone and Related Photochemical Oxidants (Final Report). Washington, DC: U.S. Environmental Protection Agency; 2013. Contract No.: EPA/600/R10/076F. [Google Scholar]
- 2.Miller DB, Ghio AJ, Karoly ED, Bell LN, Snow SJ, Madden MC, et al. Ozone Exposure Increases Circulating Stress Hormones and Lipid Metabolites in Humans. American journal of respiratory and critical care medicine. 2016;193(12):1382–91. [DOI] [PMC free article] [PubMed] [Google Scholar]
- 3.Strickland MJ, Darrow LA, Klein M, Flanders WD, Sarnat JA, Waller LA, et al. Short-term associations between ambient air pollutants and pediatric asthma emergency department visits. American journal of respiratory and critical care medicine. 2010;182(3):307–16. [DOI] [PMC free article] [PubMed] [Google Scholar]
- 4.Miller JH MR, Brusasco V, Burgos F, Casaburi R, Coates A,, Crapo PE R, et al. Standardisation of spirometry. Eur Respir J. 2005;26:319–38. [DOI] [PubMed] [Google Scholar]
- 5.Team RC. R: A language and environment for statistical computing Vienna, Austria: R Foundation for Statistical Computing; 2017 [Google Scholar]
- 6.Ostro B, Lipsett M, Mann J, Braxton-Owens H, White M. Air pollution and exacerbation of asthma in African-American children in Los Angeles. Epidemiology (Cambridge, Mass). 2001;12(2):200–8. [DOI] [PubMed] [Google Scholar]
- 7.Schildcrout JS, Sheppard L, Lumley T, Slaughter JC, Koenig JQ, Shapiro GG. Ambient air pollution and asthma exacerbations in children: an eight-city analysis. American journal of epidemiology. 2006;164(6):505–17. [DOI] [PubMed] [Google Scholar]
- 8.Daniels SR, Pratt CA, Hayman LL. Reduction of risk for cardiovascular disease in children and adolescents. Circulation. 2011;124(15):1673–86. [DOI] [PMC free article] [PubMed] [Google Scholar]
- 9.Hernandez ML and Peden DB. Air Pollution: Indoor and Outdoor, Chapter 30, in Adkinson NF, Bochner BS, Burks W, Busse WW, Holgate ST. Middleton’s Allergy: Principles and Practice: Elsevier/Saunders; 2013. [Google Scholar]


