Correction to: Scientific Reports 10.1038/s41598-017-09307-w, published online 18 August 2017
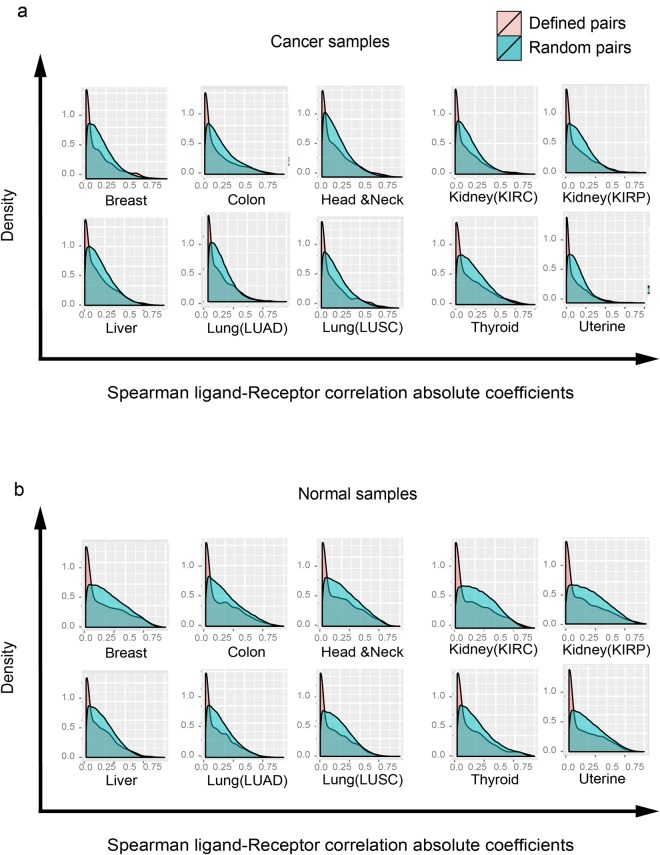
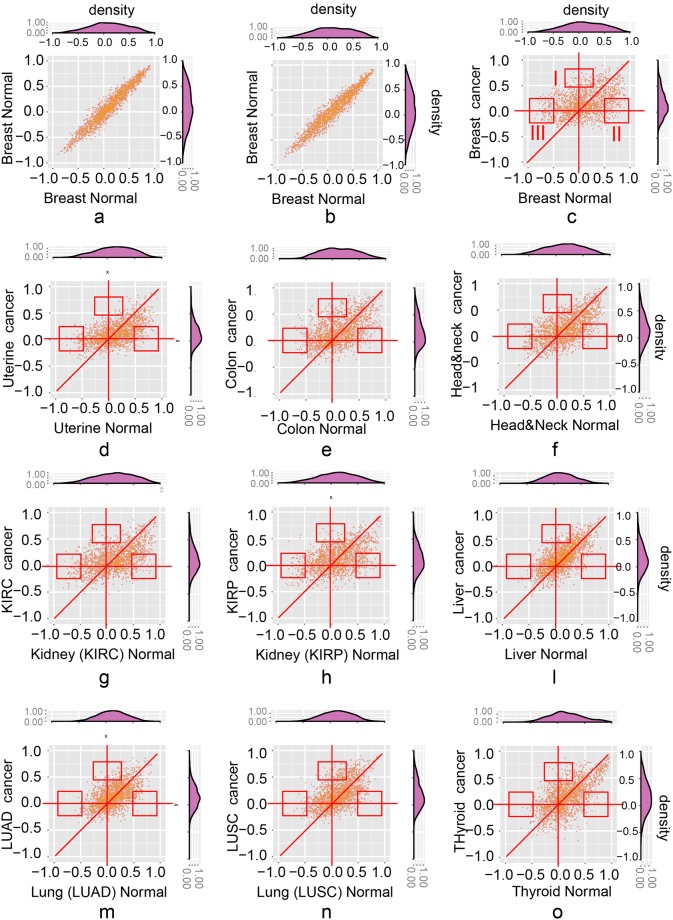
This Article contains an error in the order of the Figures. Figures 5 and 6 were published as Figures 6 and 5 respectively. The correct Figures 5 and 6 appear below as Figures 1 and 2. The Figure legends are correct.
Figure 1.
Spearman correlations in cancer and normal tissues are significantly different from randomly chosen pairs. (a) The Spearman correlation coefficients distribution (random (in red color) vs. defined (in blue) ligand-receptor gene pair) in cancer tissues. (b) The Spearman correlation coefficients distribution (random vs. defined ligand-receptor gene pair) in normal tissues.
Figure 2.
The scatter plots show the altered ligand-receptor correlations between normal and cancer tissues of 10 cancer types. (a,b) The background noise of correlations in the normal breast tissue. The scatter plots of 2,558 ligand-receptor pairs from 65 samples which are randomly chosen 1,000 times from breast tissue (performed twice); (c–o) The scatter plots of ligand-receptor correlations (normal vs. cancer) of ten cancer types. Three types of altered correlations: (i) area I: changing from uncorrelated (Spearman correlation coefficients between −0.25 and 0.25) to correlated (higher than 0.5); (ii) area II: changing from positively correlated (lower than −0.5) to uncorrelated (between −0.25 and 0.25); (iii) area III: changing from negatively correlated (higher than 0.5) to uncorrelated (between −0.25 and 0.25).


