

ABSTRACT
Background
Anemia is a term that describes low hemoglobin concentrations and can result from micronutrient deficiencies, infection, or low birth weight. Early-life anemia, particularly iron-deficiency anemia (IDA) is associated with several negative metabolic, developmental, and cognitive outcomes, some of which persist into adulthood.
Objective
The aim of this study was to investigate alterations in systemic metabolism and fecal microbial diversity and functionality associated with anemia and IDA in male and female infants from Iquitos, Peru.
Design
Cross-sectional stool and serum samples were collected from 95 infants (53 boys and 42 girls) at 12 mo of age. The fecal microbiome was assessed by using 16S ribosomal RNA gene sequencing, and the fecal and serum metabolomes were quantified using 1H-nuclear magnetic resonance.
Results
The prevalence of anemia was 64%, with a greater proportion of anemia in male infants attributed to iron deficiency. Metabolically, anemia was associated with decreased concentrations of tricarboxylic acid cycle metabolites in both sexes (males: succinate, P = 0.031; females: fumarate, P = 0.028). In addition, anemic male infants exhibited significantly lower serum concentrations of several amino acids compared with nonanemic male infants. Although no specific structural or functional differences in the microbiota were observed with anemia in general, likely due the heterogeneity of its etiology, IDA affected the microbiome both structurally and functionally. Specifically, the abundance of butyrate-producing bacteria was lower in IDA subjects of both sexes than in nonanemic, non–iron-deficient subjects of the same sex (females: Butyricicoccus, P = 0.041; males: Coprococcus, P = 0.010; Roseburia, P = 0.027). IDA male infants had higher concentrations of 4-hydroxyphenyllactate (P < 0.001) and putrescine (P = 0.042) than those without IDA, whereas IDA female infants exhibited higher concentrations of leucine (P = 0.011) and valine (P = 0.003).
Conclusions
Sexually dimorphic differences associated with anemia and IDA are suggestive of greater mitochondrial dysfunction and oxidative stress in male infants compared with female infants, and alterations in microbial structure and function may further contribute. Differences in metabolic pathways associated with anemia and IDA in each sex point to potential mechanisms for the associated lasting cognitive deficits. This trial is registered at clinicaltrials.gov as NCT03377777.
Keywords: iron deficiency, anemia, infant, development, mitochondrial dysfunction, sex difference, fecal microbiome, metabolome
INTRODUCTION
Anemia during infancy can have lasting negative impacts including impaired growth and increased risk of disease and mortality (1, 2). Although anemia can result from low birth weight, repeated infection, genetic mutations, protein-energy malnutrition, or deficiencies in vitamin A, vitamin B-12, or folate (1, 3), iron deficiency (ID) is considered the most common cause (1).
ID is considered the most prevalent micronutrient deficiency worldwide, affecting approximately one-quarter of the world's population in both developing and industrialized nations (4). Infancy and early childhood are of particular interest because children are more vulnerable to the lasting effects of ID and iron-deficiency anemia (IDA) (4). Several studies have observed a greater prevalence of IDA in males than in females despite no observable differences in birth weight, postnatal weight gain, energy intake from complementary foods, or risk of infection (5).
IDA during early life has several negative impacts on the developing infant, including decreased mother-child interaction, decreased growth, increased morbidity and mortality, and impaired cognitive abilities (6–9). Of particular interest are cognitive deficits associated with IDA, because they can persist beyond repletion even if repletion is relatively prompt (10). Significant brain growth and development occur during the first 2 y of life, at which time a large influx of iron is required for proper dopamine metabolism, neuronal and glial energy metabolism, oligodendrocyte maturation, and myelination (10). The timing, extent, and duration of deficiency result in a wide range of observed cognitive deficits, some of which may arise as a result of alterations in systemic metabolism, because the brain relies on nutrients supplied through the blood rather than storing energy itself (11).
Dietary iron is never completely absorbed (12), and thus some passes to the colon. Iron is an essential nutrient for bacterial growth and colonization, as well as virulence in the case of pathogenic bacteria (13). Therefore, host iron status has the potential to influence microbial community structure. Associations between gastrointestinal microbes and depression (14), anxiety (15), autism spectrum disorder (16), and neurodegeneration (17, 18) have been reported in humans; and studies using germ-free animals have generated a body of evidence that the microbiome influences brain physiology, neurochemistry, and behavior (11).
The purpose of this observational study was to gain insight into how early-life anemia and IDA are associated with systemic metabolism as well as the structure and function of the gut microbial community in male and female infants. This study furthers our understanding of how anemia and IDA in infancy may lead to cognitive deficits.
METHODS
Subjects
Sample collection occurred between August and November 2014. A total of 102 infants at 12–13 mo of age were recruited at the Moronacocha Health Center in Iquitos, Peru (Figure 1). All of the subjects were residents of Moronacocha, Iquitos, Loreto, outwardly healthy, and born at term with a birth weight of ≥2500 g. Venous blood samples were collected without an anticoagulant by a lab technician at the local health center. Hemoglobin concentrations and malaria status were immediately measured using standard methods, and samples were subsequently transported to Selva Amazonica clinic and centrifuged, and serum was stored at −80°C. Stool samples were collected by caregivers from diapers at home, taken to Selva Amazonica Clinic, and placed into aliquots. Fecal samples were analyzed for fecal parasites at Selva Amazonica, and any necessary treatment was provided at the local health center. Serum and stool samples were shipped to the University of California, Davis, on dry ice, where they were stored at −80°C until analysis.
FIGURE 1.

Participant flow chart and number of samples included in analyses. All infants who were included in the study (n = 95) provided a serum sample to determine iron status and for serum metabolome analysis. A subset provided fecal samples for fecal microbiome and metabolome analyses. The total number and the number of subjects with IDA providing fecal samples are indicated. IDA, iron-deficiency anemia.
Ethics
Approval of this observational study was obtained from the local ethical review board of the Regional Hospital at Iquitos, Loreto, as well as the Regional Health Authority. This study was conducted in accordance with the Declaration of Helsinki and Good Clinical Practice guidelines. Parents provided written informed consent for their infants. This trial is registered at clinicaltrials.gov as NCT03377777.
Assessment of status using serum biomarkers
Hemoglobin concentrations were assessed using a Hemocue Photometer (HemoCue AB). Caregivers were informed about hemoglobin results, and treatment was provided for anemic subjects in accordance with national policy. Aliquots of serum samples were shipped to the laboratory of Jurgen Erhardt (Germany) for simultaneous assessment of serum ferritin, soluble transferrin receptor (sTfR), retinol-binding protein (RBP), C-reactive protein (CRP), and α1-acid glycoprotein (AGP) by sandwich ELISA (19). Standard cutoffs of CRP >5 mg/L and AGP >1 g/L were used to classify infection status of each subject as either incubation (elevated CRP only), early convalescence (both elevated CRP and AGP), late convalescence (elevated AGP only), or reference (neither CRP nor AGP elevated). These classifications were then used to adjust ferritin and RBP using the method of Thurnham et al. (20–22) to account for the acute-phase response of both proteins. In addition, body iron stores for each infant were calculated as a function of sTfR to adjusted ferritin (23), with values <0 mg/kg body weight considered iron deficient.
Anemia was defined as having a hemoglobin concentration <110 g/L, because this is the concentration that WHO defines as anemia in infants (24). Others have observed hemoglobin concentrations in a population after the exclusion of any subjects with possible ID and suggested using a cutoff of 100 g/L in 9-mo-old infants, which corresponds to values 2 SD below the population mean (25). We believe that functional consequences of ID are likely to occur even before the cutoff of 100 g/L at 9 mo is reached and thus used the cutoff noted above.
Assessment of iron status is challenging, particularly in infants. Ferritin concentrations are high at birth and continue to increase for the first 2 mo of life (26), but the concentrations decrease drastically from 4 to 9 mo of age (27). The wide range of ferritin concentrations observed in infants decreases its usefulness as a biomarker for defining iron status at this age (25). Furthermore, the inflammation often associated with malnutrition may increase ferritin concentrations (28, 29), and these changes may not be corrected for in the adjustment of ferritin based on infection status. Therefore, the standard cutoff of adjusted ferritin of <12 μg/L was used to define deficiency (24). For the following analyses, infants were defined as being ID if sTfR was ≥8.3 mg/L. A single female infant exhibited a borderline deficient sTfR concentration (8.06 mg/L), but adjusted ferritin and body iron stores indicated deficiency. This pattern was also classified as ID.
Serum metabolome
Serum samples were thawed on ice. To remove proteins and lipids, samples were filtered through 0.5-mL Amicon Ultra centrifugal filters with a cutoff of 3000 MW (Millipore) at 14,000 x g for 45 min at 4°C. A total of 207 μL filtrate was collected, and if needed, the filtrate volume was adjusted to 207 μL using ultrapure water, after which 23 μL of internal standard containing 4.608 mM 3-(trimethylsilyl)-1-propanesulfonic acid-d6 (DSS-d6), 0.2% sodium azide (NaN3), and 99.8% deuterated water (D2O) was added. Each sample was then adjusted to a pH of 6.85 ± 0.1 using ∼2 μL 1-N hydrochloric acid (HCl). A total of 180 μL was transferred to a 3-mm nuclear magnetic resonance (NMR) tube (Bruker) and stored at 4°C until spectral acquisition.
Fecal metabolome
Fecal samples were thawed on ice. After manual homogenization with a sterile microspatula (Corning), ∼250 mg fecal material was weighed, taking care to avoid any undigested food that may be present. Samples were extracted in 1500 μL of PBS and centrifuged for 5 min at 4°C and 14,000 x g. After careful removal of the supernatant, the pellet was retained and lyophilized for 24 h to determine the dry weight of each fecal sample. The supernatant was subjected to 2 filtering steps, first through a 0.22-μm Millex GP PES membrane syringe filter (Millipore) and then through a 0.5-mL Amicon Ultra centrifugal filter (3000-MW cutoff; Millipore) at 14,000 x g for 45 min at 4°C. A total of 23 μL DSS-d6 (as described above) was combined with 207 μL filtrate, and if necessary, each sample was adjusted to a pH of 6.8 ± 0.1 using small amounts of 1-N HCl and 1-N sodium hydroxide (NaOH). A total of 180 μL was transferred to a 3-mm NMR tube (Bruker) and stored at 4°C until spectral acquisition.
NMR analysis
All 1H-NMR spectra were collected at 25°C using the noseypr1d pulse sequence on an Avance 600-MHz spectrometer (Bruker). The Chenomx NMR Suite (version 8.1; Chenomx Inc.) was used to process and analyze the NMR spectra. Each spectrum was Fourier transformed, and then manually phase and baseline corrected in Chenomx Processor. Metabolites were quantified by the same researcher in Chenomx Profiler, using the concentration of the internal standard (DSS-d6) as a reference. The concentrations of serum metabolites are expressed as micromoles per liter (μM), and the concentrations of fecal metabolites are expressed as nanomoles per gram of dry weight.
Fecal microbiome
Fecal samples were also subjected to 16S ribosomal RNA gene sequencing. In order to minimize freeze-thaw cycles, the fecal metabolome and fecal microbiome sample preparations were completed on the same day for each sample. After being thawed on ice and manually homogenized, ∼250 mg fecal material was placed into aliquots, taking care to avoid any undigested food particles. Microbial DNA was extracted using the PowerLyzer PowerSoil DNA Isolation Kit (MoBio) following the manufacturer's instructions for using the vacuum filter (PowerVac Manifold, MoBio), with the following modifications: 1) after bead beating (FastPrep-24, MP Biomedicals), samples were centrifuged for a full minute at 22°C and 10,000 x g to ensure pellets fully formed, and 2) only 650 μL supernatant was transferred to the collection tube for DNA binding to avoid tube spillover in subsequent steps.
The V4 region of the 16S ribosomal RNA gene was amplified with polymerase chain reaction (PCR) using a 40-cycle program of 45 s at 94°C for denaturation, 60 s at 50°C for annealing, and 90 s at 72°C for primer extension. The F515-R806 primer pair was used, with an 8-bp Hamming error-correcting barcode included on the 3′ end of the forward primer to allow for sample multiplexing. The PCR amplicons in each library were purified using the QIAquick PCR Purification Kit (Qiagen). Due to the large volume of PCR product potentially being greater than the DNA capacity of the elution columns, the manufacturer's instructions were modified slightly. Initially, the samples were combined into 5 separate libraries, and each was cleaned according to the manufacturer's instructions up to the elution of the final product. The first column was eluted using 60 μL elution buffer, and all subsequent libraries were eluted using the filtrate from the previous column, resulting in a single final library. This process was used rather than eluting each library separately and combining the filtrates to theoretically maximize the DNA concentration in the final product. The 250-bp paired-end sequencing was completed by the University of California, Davis, Genome Center (DNA Technologies Core) using the Illumina MiSeq platform (Illumina).
Sequence data were analyzed using the Quantitative Insights Into Microbial Ecology (QIIME) platform, version 1.8.0 (30). Briefly, forward and reverse reads were joined and demultiplexed, and any chimeric sequences identified using the usearch61 method were removed. Closed operational taxonomic unit (OTU) picking to 97% identity was done using the uclust method and the most recent Greengenes taxonomy (Greengenes 13_8). Any samples with <10,000 reads were removed. The fecal microbiome data sets generated and analyzed during the current study are available from the European Nucleotide Archive (accession: ERP104978).
Statistical analysis
All statistical analyses were completed using R (version 3.3.2). Adjusted ferritin, adjusted RBP, and metabolite values were log transformed and microbial relative abundance was arcsine-square root transformed to approximate normality for all statistical analyses. Anthropometric and biochemical indexes were initially assessed for normality using a Shapiro-Wilk test. The differences between the sexes were assessed using a t test and Cohen's D effect size in the case of normally distributed data or a Kruskal-Wallis test and Cliff's δ effect size in the case of nonnormally distributed data. The prevalence of stunting, anemia, and anemia attributed to ID between the sexes were assessed using chi-square tests. Differences in serum metabolite concentrations associated with anemia or IDA in this cohort were analyzed within each sex separately using single-factor ANCOVA (anemia and IDA, both accounting for height-for-age z score as a covariate). Fecal metabolite and fecal microbial relative abundance were assessed using the same models as described for the serum metabolome but included age as an additional covariate. False discovery rate (FDR) correction (corrected by the total number of metabolites or OTUs that were observed in each respective data set) was applied to all calculated P values for the serum metabolome, fecal metabolome, and fecal microbiome. Because correcting for all observed metabolites or OTUs decreases the chance of type 2 errors (false positive) but increases type 1 error (false negative) and our study population is relatively small, uncorrected P values are reported and any differences that remained significant after FDR correction are additionally noted. All reported differences in microbial taxa were considered significant if the uncorrected P value was ≤0.05, a moderate to strong effect size (Cohen's D ≥0.5) was observed, and the OTU was observed in ≥20% of the population being tested. Square brackets surrounding the name of microbial taxa denote proposed, but not yet verified, changes to their phylogenetic classification. β-Diversity was visualized as a principal coordinates analysis (PCoA) of the unweighted UniFrac distance after rarefying to the lowest read count using the phyloseq package (version 1.19.1) in R. R was used to perform principal components analysis (PCA) of metabolites, and all plots were visualized using the ggplot2 library. Because age, treatment for anemia or fecal parasites, and changes in diet can alter the fecal microbiome and/or affect anemia status, only those stool samples that were collected ≤14 d of the serum sample were included in the fecal metabolome and fecal microbiome analyses (Supplemental Figure 1). In addition, 1 sample was excluded due to indications of urinary contamination and 3 samples were excluded that had very high α-diversity and were suspected to have come from an older child or adult.
RESULTS
Subject characteristics
The total number of subjects in each analysis is shown in Figure 1. Anthropometric and biochemical characteristics are shown in Table 1. The prevalence of anemia was 64% and did not differ between the sexes (males: 72%; females: 55%; χ2 = 2.23, df = 1, P = 0.135). However, a significantly greater proportion of the anemia could be attributed to iron deficiency in males than in females (82% compared with 52%; χ2 = 3.87, df = 1, P = 0.049). No difference in the prevalence of stunting was observed between anemic and nonanemic subjects in this cohort as a whole (χ2 = 1.95, df = 1, P = 0.163), or when considering male (χ2 = 1.02, df = 1, P = 0.312) or female (χ2 = 0.04, df = 1, P = 0.849) subjects separately. None of the subjects were vitamin A deficient (adjusted RBP <0.7 μmol/L), although 28% of subjects were noted to have marginal vitamin A status (adjusted RBP: 0.7–1.05 μmol/L). No differences in adjusted RBP values (t test, P = 0.999; Cohen's D = 0.1) or the prevalence of marginal vitamin A status were noted between the sexes (χ2 = 0.01, df = 1, P = 0.914).
TABLE 1.
Anthropometric and biochemical characteristics of subjects in this cohort1
| Total | Male infants | Female infants | P | Effect size | |
|---|---|---|---|---|---|
| n | 95 | 53 | 42 | 0.432 | |
| Age, mo | 12.7 ± 0.5 [12.0, 13.7] | 12.7 ± 0.4 [12.0, 13.6] | 12.8 ± 0.5 [12.0, 13.7] | 0.611 | 0.11 |
| HAZ | −1.2 ± 0.9 [−3.5, 2.2] | −1.3 ± 1.1 [−3.5, 2.2] | −1.2 ± 0.7 [−2.7, 0.3] | 0.674 | 0.08 |
| Stunted, n (%) | 20 (21) | 14 (26) | 6 (14) | 0.235 | |
| WAZ | −0.6 ± 0.9 [−2.6, 1.8] | −0.6 ± 0.8 [−2.6, 1.8] | −0.5 ± 0.9 [−2.4, 1.5] | 0.538 | 0.13 |
| Underweight, n (%) | 7 (7) | 5 (9) | 2 (5) | N/A | |
| WHZ | 0 ± 1.0 [−3.4, 2.3] | 0 ± 0.9 [−3.4, 2.3] | 0 ± 1.0 [−2.4, 2.2] | 0.712 | 0.08 |
| Wasted, n (%) | 3 (3) | 2 (4) | 1 (2) | N/A | |
| CRP, mg/L | 1.00 (0.45, 2.92) | 0.98 (0.54, 3.01) | 1.23 (0.32, 2.78) | 0.572 | 0.07 |
| AGP, g/L | 0.92 (0.62, 1.44) | 0.96 (0.68, 1.75) | 0.80 {0.59, 1.38) | 0.164 | 0.17 |
| Adjusted ferritin,2 μg/L | 22.1 (11.2, 35.9) | 18.9 (11.0, 32.5) | 27.1 (14.9, 37.7) | 0.077 | 0.28 |
| sTfR, mg/L | 9.27 (7.55, 13.14) | 11.77 (7.79, 14.37) | 8.07 (7.16, 11.01) | 0.004 | 0.35 |
| Adjusted BISs, mg/kg | 1.01 ± 3.83 [−9.09, 9.64] | 0.18 ± 3.79 [−9.09, 8.33] | 2.07 ± 3.66 [−7.21, 9.64] | 0.016 | 0.51 |
| Adjusted RBP,3 μmol/L | 1.24 (1.06, 1.52) | 1.24 (1.06, 1.55) | 1.23 (1.05, 1.47) | 0.999 | 0.05 |
| Hemoglobin,4 g/L | 107 (80, 156) | 106 (80, 156) | 109 (84, 152) | 0.074 | 0.21 |
| Anemia, n (%) | 61 (64) | 38 (72) | 23 (55) | 0.135 | |
| IDA, n (%) | 43 (70) | 31 (82) | 12 (52) | 0.049 |
1Values are means ± SDs [ranges] unless otherwise indicated, with differences between sexes assessed by using a t test for significance and Cohen's D for effect size in the case of parametric data. In the case of nonparametric data, values are expressed as medians (25th, 75th percentiles), with differences between the sexes assessed by using the Kruskal-Wallis test and Cliff's δ for effect size. “Stunted” is defined as HAZ ≤−2, underweight as WAZ ≤−2, and wasted as WHZ ≤−2, with the total number and percentage of population reported. The number of IDA infants and percentage of anemia attributable to IDA are also reported. Sex differences in prevalence data were assessed by using a chi-square test. AGP, α1-acid glycoprotein; BIS, body iron store; CRP, C-reactive protein; HAZ, height-for-age z score; IDA, iron-deficiency anemia; N/A, not applicable; RBP, retinol-binding protein; sTfR, soluble transferrin receptor; WAZ, weight-for-age z score; WHZ, weight-for-height z score.
2Sex differences in the prevalence of underweight and wasting were not assessed due to low prevalence.
3Values are medians (25th, 75th percentiles) of nontransformed data, but sex differences were tested using a t test on log-transformed data.
4Values are medians (ranges).
None of the children had an active malarial infection, but 9% of subjects whose samples met the 14-d cutoff requirement had indications of parasitic infection. Of these 6 subjects, 3 fecal samples contained eggs of the nematode Ascaris lumbricoides. The remaining 3 subjects were observed to have Blastocystis hominis, Entamoeba coli, or Giardia. Infections were equally distributed between the 2 sexes, and 4 of the 6 subjects also had elevated markers of inflammation. When considering infants with no indications of acute infection (i.e., CRP and AGP concentrations within the normal range; n = 31 males, n = 23 females), CRP concentrations did not differ between the sexes (Kruskal-Wallis, P = 0.347; Cliff's δ = 0.2). However, AGP concentrations were higher in males than females (Kruskal-Wallis, P = 0.011; Cliff's δ = 0.4) without any differences in the prevalence of anemia between the sexes (χ2 = 0.313, df = 1, P = 0.576).
Anemia is associated with alterations in the serum metabolome
It has been established that genetic complement affects the stress response (31) and metabolism (32) and therefore metabolic development is different between the sexes (reviewed in reference 33). As such, the metabolic changes associated with anemia were investigated in each sex separately. Compared with nonanemic males (n = 15), anemic male infants (n = 38) exhibited significantly higher serum concentrations of inosine, as well as significantly lower serum concentrations of lactate, succinate, choline, taurine, and several amino acids that included histidine, isoleucine, leucine, lysine, methionine, tyrosine, and valine. Interestingly, anemic female infants (n = 23) exhibited significantly lower serum concentrations of only fumarate and glycerol and a trend toward lower concentrations of lactate (P = 0.089; Cohen's D = 0.6) and glutamate (P = 0.094; Cohen's D = 0.6) in comparison to nonanemic females (n = 19) (Table 2, Figure 2, Supplemental Table 1).
TABLE 2.
Sex-specific differences in serum metabolite concentrations associated with anemia status1
| Male infants, μmol/L | Female infants, μmol/L | |||||||
|---|---|---|---|---|---|---|---|---|
| Anemic (n = 38) | Nonanemic (n = 15) | P | Effect size | Anemic (n = 23) | Nonanemic (n = 19) | P | Effect size | |
| Lactate | 2931 ± 129 | 3715 ± 290 | 0.005 | 0.87 | 2954 ± 112 | 3353 ± 196 | NS | 0.57 |
| Succinate | 3.9 ± 0.2 | 4.8 ± 0.4 | 0.031 | 0.67 | 3.8 ± 0.3 | 4.0 ± 0.2 | NS | Low |
| Fumarate | 1.5 ± 0.1 | 1.8 ± 0.2 | NS | Low | 1.4 ± 0.1 | 1.7 ± 0.1 | 0.028 | 0.78 |
| Histidine | 63 ± 1.6 | 74 ± 3.0 | 0.004 | 1.00 | 72 ± 3.0 | 71 ± 2.7 | NS | Low |
| Isoleucine | 54 ± 2.4 | 67 ± 4.7 | 0.007 | 0.86 | 67 ± 4.7 | 69 ± 5.6 | NS | Low |
| Leucine | 85 ± 3.2 | 100 ± 6.5 | 0.021 | 0.74 | 102 ± 6.3 | 101 ± 6.8 | NS | Low |
| Lysine | 121 ± 4.0 | 145 ± 11 | 0.035 | 0.75 | 154 ± 11 | 147 ± 9.2 | NS | Low |
| Methionine | 20 ± 0.9 | 24 ± 1.8 | 0.012 | 0.74 | 26 ± 1.8 | 27 ± 1.8 | NS | Low |
| Tyrosine | 67 ± 2.1 | 82 ± 6.8 | 0.007 | 0.84 | 86 ± 6.2 | 86 ± 6.2 | NS | Low |
| Valine | 170 ± 5.6 | 207 ± 13 | 0.005 | 0.91 | 210 ± 12 | 210 ± 14 | NS | Low |
| Choline | 15 ± 0.5 | 16 ± 0.6 | 0.033 | 0.62 | 15 ± 0.7 | 16 ± 0.9 | NS | Low |
| Glycerol | 408 ± 14 | 402 ± 21 | NS | Low | 368 ± 12 | 453 ± 20 | <0.0012 | 1.17 |
| Inosine | 2.9 ± 0.6 | 0.6 ± 0.3 | 0.006 | 0.78 | 1.5 ± 0.4 | 1.6 ± 0.4 | NS | Low |
| Taurine | 155 ± 6.2 | 186 ± 11 | 0.010 | 0.81 | 181 ± 8.2 | 168 ± 9.7 | NS | Low |
1Values are means ± SEMs. Metabolites that exhibited a difference on the basis of anemia status when male and female subjects were assessed separately are shown (ANCOVA accounting for height-for-agez score as a covariate). Only metabolites with significant differences (P < 0.05) and moderate to strong effect sizes (Cohen's D ≥0.5) are reported (see Supplemental Table 1 for concentrations for nonsignificant metabolites).
2Remained significant (P < 0.05) after false discovery rate correction.
FIGURE 2.

Anemic male infants (n = 38) exhibited lower serum concentrations of succinate and several amino acids in comparison to nonanemic male infants (n = 15). Anemic female infants (n = 23) only exhibited lower serum concentrations of fumarate when compared with nonanemic female infants (n = 19). Within each sex, the effect of anemia was assessed using single-factor ANCOVA with height-for-age z score as a covariate. The gray and white triangles indicate metabolites that are significantly lower (P ≤ 0.05) in anemic males compared with nonanemic males and in anemic females compared with nonanemic females, respectively. OAA, oxaloacetate; TCA cycle, tricarboxylic acid cycle; αKG, α-ketoglutarate.
Because ID is not the only cause of anemia, subjects with IDA were compared with those who were neither iron deficient nor anemic (referred to as the reference population) to assess whether the above changes were specifically associated with IDA. When the effects of IDA were investigated within each sex, histidine, lysine, valine, and taurine were noted to be at significantly lower concentrations in IDA males (n = 31) compared with reference males (n = 8), whereas IDA females (n = 12) had significantly lower serum fumarate and glycerol and a trend toward lower glutamate concentrations (P = 0.098; Cohen's D = 0.7) in comparison to reference females (n = 11) (Table 3, Supplemental Table 2). These results suggest that other causes of anemia (which include vitamin B-12 or folate deficiency) influence the serum metabolome. Unfortunately, vitamin B-12 and folate status were not measured.
TABLE 3.
Differences in serum metabolite concentrations associated with IDA status within each sex1
| Male infants, μmol/L | Female infants, μmol/L | |||||||
|---|---|---|---|---|---|---|---|---|
| IDA (n = 31) | Reference (n = 8) | P | Effect size | IDA (n = 12) | Reference (n = 11) | P | Effect size | |
| Fumarate | 1.6 ± 0.1 | 1.5 ± 0.2 | NS | Low | 1.5 ± 0.1 | 1.8 ± 0.1 | 0.034 | 1.01 |
| Histidine | 64 ± 1.8 | 76 ± 3.1 | 0.005 | 1.26 | 75 ± 3.5 | 68 ± 3.9 | NS | 0.58 |
| Lysine | 120 ± 4.6 | 142 ± 9.6 | 0.029 | 0.86 | 164 ± 14 | 142 ± 12 | NS | Low |
| Valine | 172 ± 5.6 | 198 ± 7.9 | 0.024 | 0.90 | 215 ± 17 | 218 ± 20 | NS | Low |
| Glycerol | 422 ± 15 | 393 ± 20 | NS | Low | 385 ± 19 | 472 ± 28 | 0.017 | 1.10 |
| Taurine | 156 ± 7.3 | 189 ± 11 | 0.032 | 0.83 | 178 ± 9.9 | 165 ± 11 | NS | Low |
1Values are means ± SEMs. Metabolites that exhibited a difference on the basis of IDA status when male and female subjects were considered separately are shown (ANCOVA accounting for HAZ as a covariate). Only metabolites with a significant difference (P < 0.05) and moderate to strong effect size (Cohen's D ≥0.5) are reported (see Supplemental Table 2 for concentrations for nonsignificant metabolites). HAZ, height-for-age z score; IDA, iron-deficiency anemia.
Changes in microbial structure and function associated with anemia and IDA
Because subjects noted to be anemic were provided iron, and the β-diversity plot of subjects with IDA indicated significant changes in the fecal microbiome after 14 d of treatment (Supplemental Figure 1), only those fecal samples collected ≤14 d of blood sample collection were included in the analysis of the fecal microbiome and fecal metabolome. Although this exclusion reduced sample sizes to 36 males (11 excluded) and 32 females (6 excluded) (Figure 1), it ensured that iron treatment was not a confounder in any analyses.
PCoA of fecal 16S gene- sequencing data of anemic compared with nonanemic infants showed no distinct clustering within either sex (data not shown). This may be due to the heterogeneous etiology of anemia. However, PCoA of fecal 16S gene-sequencing data obtained from males with IDA showed that their microbiota tended to separate from reference males (Figure 3A). Several taxonomic differences were noted between IDA (n = 19) and reference (n = 7) male infants (Figure 4). PCoA of fecal 16S gene-sequencing data obtained from females showed no distinct separation between IDA (n = 10) and reference (n = 9) subjects (Figure 3B); however, female infants with IDA had a lower abundance of the butyrate-producing genus Butyricicoccus (P = 0.041; Cohen's D = 1.2) compared with the reference population. Anemic females (n = 17) exhibited a lower relative abundance of the genus Prevotella (family Prevotellaceae; P = 0.026; Cohen's D = 0.6) than did nonanemic females (n = 15).
FIGURE 3.

The fecal microbiome and metabolome differ between IDA and reference subjects. PCoA of the unweighted UniFrac distance, rarefied to the lowest read count, of the fecal microbiome in IDA and reference subjects in male (n = 26) (A) and female (n = 19) (B) infants. PCA showing centroids of the fecal metabolome in male (n = 26) (C) and female (n = 18) (D) infants compared with reference (non–iron-deficient and nonanemic) subjects. IDA, iron-deficiency anemia; PC, principal component; PCA, principal components analysis; PCoA, Principal Coordinates Analysis.
FIGURE 4.

The fecal microbiome of male infants exhibits taxonomic differences between IDA and reference subjects. The relative abundances of the microbes between IDA (n = 19) and reference (n = 7) males were assessed using ANCOVA accounting for age and HAZ. Gray boxes identify taxa that differ (P < 0.05) between IDA and reference subjects. HAZ, height-for-age z score; IDA, iron-deficiency anemia.
Similar tothe fecal microbiome, PCA of the fecal metabolome of either sex showed no distinct clustering based on anemia status (data not shown). PCA of the fecal metabolome of subjects with IDA of either sex showed a tendency to cluster away from reference subjects of the same sex (Figure 3C, D).
Indications of altered microbial metabolism were noted when comparing the IDA and reference subjects. The stool of IDA males (n = 19) contained higher concentrations of pyruvate (P = 0.015; Cohen's D = 0.6), lactate (P = 0.006; Cohen's D = 0.7), 4-hydroxyphenyllactate (4-HPL; P < 0.001; Cohen's D = 0.6), and putrescine (P = 0.042; Cohen's D = 0.6), as well as a lower concentration of 3-hydroxyphenylacetate (P = 0.043; Cohen's D = 0.7), compared with reference males (n = 7) (data not shown).
The stool of IDA females (n = 9) exhibited lower concentrations of 3-hydroxybutyrate (FDR-corrected P = 0.007; Cohen's D = 2.3), 3-hydroxyphenylacetate (P = 0.021; Cohen's D = 0.7), and methanol (P = 0.004; Cohen's D = 1.4), as well as higher concentrations of leucine (P = 0.011; Cohen's D = 1.4) and valine (P = 0.003; Cohen's D = 1.4) compared with reference females (n = 9) (data not shown). Because there was a lag between serum and fecal sample collection, correlations between serum and fecal metabolites were not assessed.
DISCUSSION
A host of negative impacts are associated with early-life ID, ranging from metabolic and growth impairments to cognitive deficits. Metabolically, ID is well known to downregulate flux through the tricarboxylic acid cycle (TCA cycle) and impair hemoglobin synthesis due to activation of iron-regulatory protein 1 (34) (Figure 5). Furthermore, hepatic fatty acid metabolism is affected by iron status, although the effects are not as well understood (reviewed in reference 35).
FIGURE 5.
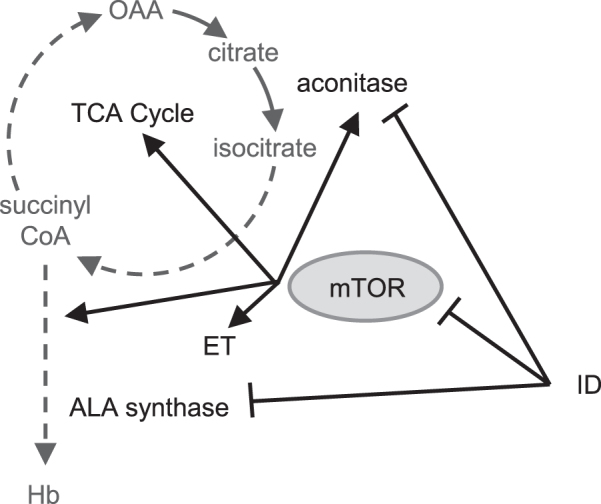
mTOR has a role in energy metabolism and hemoglobin synthesis. mTOR activity promotes hemoglobin production and improves oxygen consumption and oxidative capacity of the mitochondria by increasing the activity of several TCA cycle and ET chain enzymes. ID alone will downregulate the expression of both aconitase and ALA synthase through altering the stability of their mRNA transcripts. In addition, ID creates a second layer of impairment by inhibiting mTOR activity. ALA, δ-aminolevulinic acid; ET, electron transport; Hb, hemoglobin; ID, iron deficiency; mTOR, mechanistic target of rapamycin; OAA, oxaloacetate; TCA cycle, tricarboxylic acid cycle.
Both ID (36) and iron supplementation (13) are associated with alterations in the fecal microbiome, which could influence long-term iron homeostasis (37). Because the microbiome is well known to influence host metabolism, the interconnected effects of the microbiome and its activity should be considered when assessing alterations in systemic metabolism associated with anemia and IDA. As such, this study is a comprehensive investigation describing effects of early-life anemia and IDA on systemic metabolism and microbial community structure and function.
Mitochondrial dysfunction and oxidative stress in anemia is sex-dependent
Mitochondrial dysfunction has been shown to occur in anemia (38). In this study, anemic subjects exhibited mitochondrial dysfunction, as indicated by lower serum concentrations of TCA cycle intermediates (Table 2). Male infants additionally had lower serum concentrations of several essential amino acids, which feed into the TCA cycle (Figure 2), and lower serum taurine concentrations, which may further contribute to mitochondrial dysfunction (39). Mitochondrial dysfunction has been shown to induce fatty liver, which may occur more readily in males than in females (Figure 6) (40). Moreover, rodent studies have noted similar impacts of ID and IDA on male (41, 42), but not female (43), rodents.
FIGURE 6.
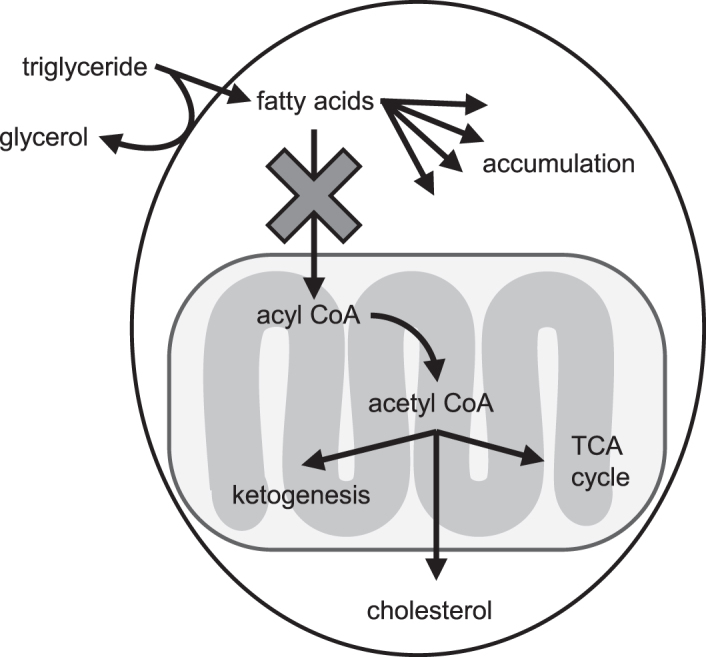
Mitochondrial dysfunction in anemic males may lead to hepatic fatty acid accumulation. Typically, triglycerides are taken up from the bloodstream, releasing free glycerol in the process (40). These fatty acids are then transported into the mitochondria and converted to acetyl CoA, which can enter the TCA cycle, be used for ketone body production, or be transported to the cytosol for cholesterol synthesis. In anemic male infants, no differences in glycerol concentrations were observed, indicating that cellular uptake of triglycerides is unchanged. However, mitochondrial dysfunction could impair the uptake of fatty acids into the mitochondria, resulting in the accumulation of cytosolic fatty acids and the development of fatty liver in anemic males. Because anemic female infants exhibited decreased concentrations of glycerol, this may indicate a decreased cellular fatty acid uptake and lower risk of fatty acid accumulation; TCA cycle, tricarboxylic acid cycle.
Males have been reported to be more susceptible to oxidative stress (44, 45). In the subset of infants without indications of acute illness, males exhibited higher AGP concentrations than females, which suggests in this study that they experience greater oxidative stress. Further indications of increased oxidative stress in anemic males included elevated concentrations of serum inosine, which is released from cells when experiencing metabolic stress (46), and lower serum taurine concentrations, which is a biological antioxidant (47). ID (27), as well as the low energy status (48, 49) and hypoxia (50) associated with anemia, downregulate mechanistic target of rapamycin (mTOR) complex 1 (mTORC1; Figure 5), a serine/threonine kinase with an extensive role in regulating cellular growth, proliferation, metabolism, and survival (48, 49). Lower availability of amino acids further downregulates mTORC1 activity (51–53), which may disadvantage anemic males over anemic females (Figure 5). For instance, inhibition of mTOR leads to decreased oxygen consumption and oxidative capacity of mitochondria through decreased phosphorylation of a number of enzymes involved in the TCA cycle and electron transport (54). Second, mTORC1 has a critical role in hemoglobin synthesis (55). Finally, activation of mTORC1 in hypoxic conditions promotes transcriptional activity of hypoxia-inducible factor 1α (56), leading to altered expression of several genes involved in oxygen supply and redox balance to promote survival in hypoxia (57). Taken together, our results suggest that anemic males may have an impaired ability to activate mTOR signaling, which exacerbates mitochondrial dysfunction and increases oxidative stress.
IDA affects gut health and oxidative stress in a sex-specific manner
The fecal microbiome of both sexes showed decreased relative abundance of butyrate-producing bacteria in IDA: Butyricicoccus in females and Coprococcus and Roseburia in males. In females, Butyricicoccus accounts for 0.1% of the relative abundance of all bacteria. However, in males, the combined abundance of Coprococcus and Roseburia is 6.7% in reference subjects and 1.6% in IDA subjects. It is unknown whether these low bacterial abundances would produce a biological impact. Indeed, no difference in fecal butyrate concentrations was observed. However, there could be lower colonic butyrate concentrations (58), which might negatively affect several aspects of gastrointestinal health (59). Such changes have been noted in ID male rodents (36).
Iron availability has the potential to regulate bacterial metabolic status and, in the case of pathogens, virulence (60). Females with IDA had greater concentrations of leucine and valine in their stool, which could provide several benefits for intestinal development (61), amino acid absorption (61, 62), and immune response (63). In males, IDA was associated with elevated fecal 4-HPL, and although 4-HPL is produced by several bacteria and is noted to suppress reactive oxygen species production in mitochondria (64) and neutrophils (65), no differences were seen in the relative abundance of the bacterial genera or species that produce this compound (65). Polyamines have been shown to increase virulence or promote survival of several human pathogens (66). Although seemingly contradictory, the combination of elevated putrescine and 4-HPL in IDA males may render them more susceptible to pathogenic invasion.
Alterations in systemic and microbial metabolism may affect cognitive development
The systemic mitochondrial impairment and low concentrations of circulating amino acids seen in anemic males may create impairments in the pathways leading to myelin synthesis through downregulation of mTORC1. Indeed, balanced mTOR activity is critical for proper neurodevelopment (Figure 7) (67–73). Lower choline concentrations in anemic males could also negatively affect neurotransmitter synthesis and myelination (74). In addition, sex-dependent effects of the microbiome on neurodevelopment and cognition are beginning to be deciphered (75). Our results suggest that the male microbiome is negatively affected by IDA to a greater extent than the female microbiome, with lower abundances of butyrogenic bacteria in IDA males than in IDA females that may contribute to lower colonic butyrate concentrations in males with IDA. Because evidence has been compiled for benefits of butyrate or butyrate-producing bacteria on cognitive function (58), this change may negatively alter the gut-brain axis in IDA males. Furthermore, elevated concentrations of putrescine in IDA males may have further negative effects because elevated concentrations are toxic and have been implicated in neuronal damage (76).
FIGURE 7.
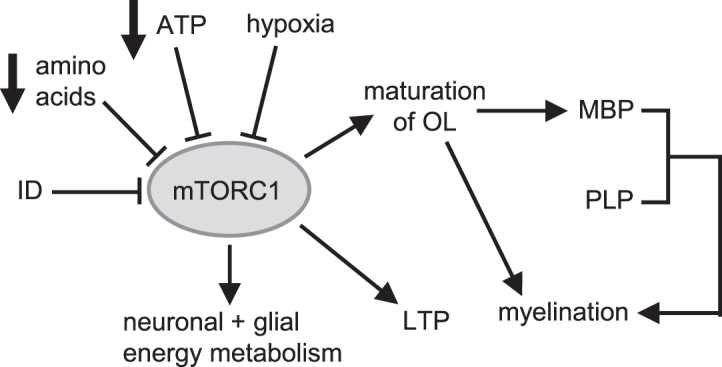
Balanced mTOR activity is critical for neuronal and glial energy metabolism, maturation of oligodendrocytes, myelination, and long-term potentiation (67–73). Considering the extensive role of mTOR in neurodevelopment, its inhibition by ID, hypoxia, low energy status, and decreased amino acid concentrations associated with anemia in anemic males could have several negative ramifications on neurodevelopment in early life. ID, iron deficiency; LTP, long-term potentiation; MBP, myelin basic protein; mTOR, mechanistic target of rapamycin; mTORC1, mechanistic target of rapamycin complex 1; OL, oligodendrocyte; PLP, proteolipid protein.
Limitations of the study
A few limitations should be recognized. The exact time between defecation and sample freezing is unknown. In addition, blood samples were not collected at a defined time after a subject's last meal, and with a decreased desire to eat associated with anemia, differences could be due to fasting. Moreover, low blood amino acid concentrations have been associated with stunting (77) and hepatic fatty acid accumulation with protein malnutrition (78, 79). Here, the effect of stunting on the serum metabolome is likely minimal because there was no significant difference in the proportion of anemic (32%) and nonanemic (13%) stunted male subjects (χ2 = 1.02, df = 1, P = 0.312). Finally, only vitamin A status was assessed, yet multiple nutrient deficiencies have been shown to alter fasting amino acid concentrations (80) and could affect anemia status.
In conclusion, differences in the serum metabolome and fecal microbiome and metabolome suggest a sexually dimorphic response to anemia and IDA. The cause of these differences is still unclear; however, it should be stressed that future research should consider males and females separately, even before subjects have entered puberty.
Supplementary Material
ACKNOWLEDGEMENTS
We acknowledge the help of Mariana Leal, Brittany Robinson, Yu Hasegawa, Jennie Sotelo Orozco, and Shin-Yu Chen for their assistance in sample preparation.
The authors’ responsibilities were as follows—BL and NZ: designed the research; AL and MC: conducted the research under the supervision of NZ; SM: performed all metabolite and DNA extractions; BL: provided guidance on interpreting iron status; SM and CMS: analyzed data and wrote the manuscript with editing by all authors; CMS had primary responsibility for final content; and all authors: read and approved the final manuscript. None of the authors declared a competing interest.
Notes
Support for this project was provided by GAIN, Global Alliance for Improved Nutrition and Arla Foods Ingredients. CMS also receives support through the USDA National Institute of Food and Agriculture Hatch Project 1005945. The Bruker Advance 600-MHz nuclear magnetic resonance Spectrometer is supported by NIH grant RR011973.
Supplemental Figure 1 and Supplemental Tables 1 and 2 are available from the “Supplementary data” link in the online posting of the article and from the same link in the online table of contents at https://academic.oup.com/ajcn/.
Present address for NZ: Peruvian National Center for Food and Nutrition, National Institute of Health, Lima, Peru.
Abbreviations used:
- AGP
α1-acid glycoprotein
- CRP
C-reactive protein
- DSS-d6
3-(trimethylsilyl)-1-propanesulfonic acid-d6
- FDR
false discovery rate
- ID
iron deficient
- IDA
iron-deficiency anemia
- mTOR
mechanistic target of rapamycin
- mTORC1
mechanistic target of rapamycin complex 1
- NMR
nuclear magnetic resonance
- OTU
operational taxonomic unit
- PCA
principal components analysis
- PCoA
principal coordinates analysis
- PCR
polymerase chain reaction
- RBP
retinol-binding protein
- sTfR
soluble transferrin receptor
- TCA cycle
tricarboxylic acid cycle
- 4-HPL
4-hydroxyphenyllactate
REFERENCES
- 1. Kraemer K, Zimmerman MB, editors. Nutritional anemia. Basel (Switzerland): Sight and Life Press, 2007. [Google Scholar]
- 2. Levy A, Fraser D, Rosen SD, Dagan R, Deckelbaum RJ, Coles C, Naggan L. Anemia as a risk factor for infectious diseases in infants and toddlers: results from a prospective study. Eur J Epidemiol. 2005;20:277–84. [DOI] [PubMed] [Google Scholar]
- 3. von Lindern JS, Lopriore E. Management and prevention of neonatal anemia: current evidence and guidelines. Expert Rev Hematol. 2014;7:195–202. [DOI] [PubMed] [Google Scholar]
- 4. Fretham SJB, Carlson ES, Georgieff MK. The role of iron in learning and memory. Adv Nutr. 2011;2:112–21. [DOI] [PMC free article] [PubMed] [Google Scholar]
- 5. Domellöf M, Lönnerdal B, Dewey KG, Cohen RJ, Landa Rivera L, Hernell O. Sex differences in iron status during infancy. Pediatrics. 2002;110:545–52. [DOI] [PubMed] [Google Scholar]
- 6. Lozoff B, Clark KM, Jing Y, Armony-Sivan R, Angelilli ML, Jacobson SW. Dose-response relationships between iron deficiency with or without anemia and infant social-emotional behavior. J Pediatr. 2008;152:696–702. [DOI] [PMC free article] [PubMed] [Google Scholar]
- 7. de Ungria M, Rao R, Wobken JD, Luciana M, Nelson CA, Georgieff MK. Perinatal iron deficiency decreases cytochrome c oxidase (CytOx) activity in selected regions of neonatal rat brain. Pediatr Res. 2000;48:169–76. [DOI] [PubMed] [Google Scholar]
- 8. Georgieff MK. The role of iron in neurodevelopment: fetal iron deficiency and the developing hippocampus. Biochem Soc Trans. 2008;36:1267–71. [DOI] [PMC free article] [PubMed] [Google Scholar]
- 9. Carlson ES, Stead JDH, Neal CR, Petryk A, Georgieff MK. Perinatal iron deficiency results in altered developmental expression of genes mediating energy metabolism and neuronal morphogenesis in hippocampus. Hippocampus. 2007;17:679–91. [DOI] [PubMed] [Google Scholar]
- 10. Georgieff MK. Long-term brain and behavioral consequences of early iron deficiency. Nutr Rev. 2011;69:S43–8. [DOI] [PMC free article] [PubMed] [Google Scholar]
- 11. Jašarević E, Morrison KE, Bale TL. Sex differences in the gut microbiome–brain axis across the lifespan. Phil Trans R Soc B. 2016;371:20150122. [DOI] [PMC free article] [PubMed] [Google Scholar]
- 12. Stipanuk MH, Caudill MA, editors. Biochemical, physiological, and molecular aspects of human nutrition. 3rd ed St. Louis, Missouri: Elsevier Inc; 2013. [Google Scholar]
- 13. Jaeggi T, Kortman GAM, Moretti D, Chassard C, Holding P, Dostal A, Boekhorst J, Timmerman HM, Swinkels DW, Tjalsma H et al.. Iron fortification adversely affects the gut microbiome, increases pathogen abundance and induces intestinal inflammation in Kenyan infants. Gut. 2015;64:731–42. [DOI] [PubMed] [Google Scholar]
- 14. Naseribafrouei A, Hestad K, Avershina E, Sekelja M, Linløkken A, Wilson R, Rudi K. Correlation between the human fecal microbiota and depression. Neurogastroenterol Motil. 2014;26:1155–62. [DOI] [PubMed] [Google Scholar]
- 15. Foster JA, Neufeld K-AM. Gut–brain axis: how the microbiome influences anxiety and depression. Trends Neurosci. 2013;36:305–12. [DOI] [PubMed] [Google Scholar]
- 16. Mayer EA, Padua D, Tillisch K. Altered brain-gut axis in autism: comorbidity or causative mechanisms?. Bioessays. 2014;36:933–9. [DOI] [PubMed] [Google Scholar]
- 17. Felice VD, Quigley EM, Sullivan AM, O'Keeffe GW, O'Mahony SM. Microbiota-gut-brain signalling in Parkinson's disease: implications for non-motor symptoms. Parkinsonism Relat Disord. 2016;27:1–8. [DOI] [PubMed] [Google Scholar]
- 18. Scheperjans F, Aho V, Pereira PAB, Koskinen K, Paulin L, Pekkonen E, Haapaniemi E, Kaakkola S, Eerola-Rautio J, Pohja M et al.. Gut microbiota are related to Parkinson's disease and clinical phenotype. Mov Disord. 2014;30:350–8. [DOI] [PubMed] [Google Scholar]
- 19. Erhardt JG, Estes JE, Pfeiffer CM, Biesalski HK, Craft NE. Combined measurement of ferritin, soluble transferrin receptor, retinol binding protein, and C-reactive protein by an inexpensive, sensitive, and simple sandwich enzyme-linked immunosorbent assay technique. J Nutr. 2004;134:3127–32. [DOI] [PubMed] [Google Scholar]
- 20. Thurnham DI, McCabe GP, Northrop-Clewes CA, Nestel P. Effects of subclinical infection on plasma retinol concentrations and assessment of prevalence of vitamin A deficiency: meta-analysis. Lancet. 2003;362:2052–8. [DOI] [PubMed] [Google Scholar]
- 21. Thurnham DI, Mburu ASW, Mwaniki DL, Muniu EM, Alumasa F, de Wagt A. Using plasma acute-phase protein concentrations to interpret nutritional biomarkers in apparently healthy HIV-1-seropositive Kenyan adults. Br J Nutr. 2008;100:174–82. [DOI] [PubMed] [Google Scholar]
- 22. Thurnham DI, McCabe LD, Haldar S, Wieringa FT, Northrop-Clewes CA, McCabe GP. Adjusting plasma ferritin concentrations to remove the effects of subclinical inflammation in the assessment of iron deficiency: a meta-analysis. Am J Clin Nutr. 2010;92:546–55. [DOI] [PubMed] [Google Scholar]
- 23. Cook JD, Flowers CH, Skikne BS. The quantitative assessment of body iron. Blood. 2003;101:3359–64. [DOI] [PubMed] [Google Scholar]
- 24. WHO. Assessing the iron status of populations. Geneva (Switzerland): WHO; 2007. [Google Scholar]
- 25. Domellöf M, Dewey KG, Lönnerdal B, Cohen RJ, Hernell O. The diagnostic criteria for iron deficiency in infants should be reevaluated. J Nutr. 2002;132:3680–6. [DOI] [PubMed] [Google Scholar]
- 26. WHO. Serum ferritin concentrations for the assessment of iron status and iron deficiency in populations. Geneva (Switzerland): WHO; 2011. [Google Scholar]
- 27. Ndong M, Kazami M, Suzuki T, Uehara M, Katsumata S-I, Inoue H, Kobayashi K-I, Tadokoro T, Suzuki K, Yamamoto Y. Iron deficiency down-regulates the Akt/TSC1-TSC2/mammalian target of rapamycin signaling pathway in rats and in COS-1 cells. Nutr Res. 2009;29:640–7. [DOI] [PubMed] [Google Scholar]
- 28. Kalantar-Zadeh K, Rodriguez RA, Humphreys MH. Association between serum ferritin and measures of inflammation, nutrition and iron in haemodialysis patients. Nephrol Dial Transplant. 2004;19:141–9. [DOI] [PubMed] [Google Scholar]
- 29. Wickramasinghe SN, Gill DS, Broom GN. Limited value of serum ferritin in evaluating iron status in children with protein‐energy malnutrition. Scand J Haematol. 1985;35:292–8. [DOI] [PubMed] [Google Scholar]
- 30. Caporaso JG, Kuczynski J, Stombaugh J, Bittinger K, Bushman FD, Costello EK, Fierer N, Peña AG, Goodrich JK, Gordon JI et al.. QIIME allows analysis of high-throughput community sequencing data. Nat Methods. 2010;7:335–6. [DOI] [PMC free article] [PubMed] [Google Scholar]
- 31. Penaloza C, Estevez B, Orlanski S, Sikorska M, Walker R, Smith C, Smith B, Lockshin RA, Zakeri Z. Sex of the cell dictates its response: differential gene expression and sensitivity to cell death inducing stress in male and female cells. FASEB J. 2009;23:1869–79. [DOI] [PMC free article] [PubMed] [Google Scholar]
- 32. Link JC, Chen X, Arnold AP, Reue K. Metabolic impact of sex chromosomes. Adipocyte. 2014;2:74–9. [DOI] [PMC free article] [PubMed] [Google Scholar]
- 33. Dearden L, Bouret SG, Ozanne SE. Sex and gender differences in developmental programming of metabolism. Mol Metab. 2018;15:8–19. [DOI] [PMC free article] [PubMed] [Google Scholar]
- 34. Beinert H, Kennedy MC. Aconitase, a two-faced protein: enzyme and iron regulatory factor. FASEB J. 1993;7:1442–9. [DOI] [PubMed] [Google Scholar]
- 35. Ahmed U, Latham PS, Oates PS. Interactions between hepatic iron and lipid metabolism with possible relevance to steatohepatitis. World J Gasterenterol. 2012;18:4651–8. [DOI] [PMC free article] [PubMed] [Google Scholar]
- 36. Dostal A, Chassard C, Hilty FM, Zimmermann MB, Jaeggi T, Rossi S, Lacroix C. Iron depletion and repletion with ferrous sulfate or electrolytic iron modifies the composition and metabolic activity of the gut microbiota in rats. J Nutr. 2012;142:271–7. [DOI] [PMC free article] [PubMed] [Google Scholar]
- 37. Deschemin J-C, Noordine M-L, Remot A, Willemetz A, Afif CM, Canonne-Hergaux FO, Langella P, Karim Z, Vaulont S, Thomas M et al.. The microbiota shifts the iron sensing of intestinal cells. FASEB J. 2016;30:252–61. [DOI] [PubMed] [Google Scholar]
- 38. Walter PB, Knutson MD, Paler-Martinez A, Lee S, Viteri FE, Ames BN. Iron deficiency and iron excess damage mitochondria and mitochondrial DNA in rats. Proc Natl Acad Sci USA. 2002;99:2264–9. [DOI] [PMC free article] [PubMed] [Google Scholar]
- 39. Jong C, Ito T, Prentice H, Wu J-Y, Schaffer S. Role of mitochondria and endoplasmic reticulum in taurine-deficiency-mediated apoptosis. Nutrients. 2017;9:795–17. [DOI] [PMC free article] [PubMed] [Google Scholar]
- 40. Tao RC, Kelley RE, Yoshimura NN, Benjamin F. Glycerol: its metabolism and use as an intravenous energy source. J Parenter Enteral Nutr. 1983;7:479–88. [DOI] [PubMed] [Google Scholar]
- 41. Kamei A, Watanabe Y, Ishijima T, Uehara M, Arai S, Kato H, Nakai Y, Abe K. Dietary iron-deficient anemia induces a variety of metabolic changes and even apoptosis in rat liver: a DNA microarray study. Physiol Genomics. 2010;42:149–56. [DOI] [PubMed] [Google Scholar]
- 42. Kamei A, Watanabe Y, Kondo K, Okada S, Shinozaki F, Ishijima T, Nakai Y, Kondo T, Arai S, Abe K. Influence of a short-term iron-deficient diet on hepatic gene expression profiles in rats. PLoS One. 2013;8:e65732–9. [DOI] [PMC free article] [PubMed] [Google Scholar]
- 43. Uehara M, Chiba H, Mogi H, Suzuki K, Goto S. Induction of increased phosphatidylcholine hydroperoxide by an iron-deficient diet in rats. J Nutr Biochem. 1997;8:385–91. [Google Scholar]
- 44. Borrás C, Sastre J, García-Sala D, Lloret A, Pallardó FV, Viña J. Mitochondria from females exhibit higher antioxidant gene expression and lower oxidative damage than males. Free Radic Biol Med. 2003;34:546–52. [DOI] [PubMed] [Google Scholar]
- 45. Lavoie J-C, Tremblay A. Sex-specificity of oxidative stress in newborns leading to a personalized antioxidant nutritive strategy. Antioxidants. 2018;7:11. [DOI] [PMC free article] [PubMed] [Google Scholar]
- 46. Hasko G, Kuhel DG, Nemeth ZH, Mabley JG, Stachlewitz RF, Virag L, Lohinai Z, Southan GJ, Salzman AL, Szabo C. Inosine inhibits inflammatory cytokine production by a posttranscriptional mechanism and protects against endotoxin-induced shock. J Immunol. 2000;164:1013–9. [DOI] [PubMed] [Google Scholar]
- 47. Zhang Z, Liu D, Yi B, Liao Z, Tang L, Yin D, He M. Taurine supplementation reduces oxidative stress and protects the liver in an iron-overload murine model. Mol Med Report. 2014;10:2255–62. [DOI] [PMC free article] [PubMed] [Google Scholar]
- 48. Laplante M, Sabatini DM. mTOR signaling at a glance. J Cell Sci. 2009;122:3589–94. [DOI] [PMC free article] [PubMed] [Google Scholar]
- 49. Laplante M, Sabatini DM. mTOR signaling in growth control and disease. Cell. 2012;149:274–93. [DOI] [PMC free article] [PubMed] [Google Scholar]
- 50. Ohyashiki JH, Kobayashi C, Hamamura R, Okabe S, Tauchi T, Ohyashiki K. The oral iron chelator deferasirox represses signaling through the mTOR in myeloid leukemia cells by enhancing expression of REDD1. Cancer Sci. 2009;100:970–7. [DOI] [PMC free article] [PubMed] [Google Scholar]
- 51. Sancak Y, Peterson TR, Shaul YD, Lindquist RA, Thoreen CC, Sabatini DM. The Rag GTPases bind Raptor and mediate amino acid signaling to mTORC1. Science. 2008;320:1496–501. [DOI] [PMC free article] [PubMed] [Google Scholar]
- 52. Sancak Y, Bar-Peled L, Zoncu R, Markhard AL, Nada S, Sabatini DM. Ragulator-Rag complex targets mTORC1 to the lysosomal surface and is necessary for its activation by amino acids. Cell. 2010;141:290–303. [DOI] [PMC free article] [PubMed] [Google Scholar]
- 53. Tsokanos F-F, Albert M-A, Demetriades C, Spirohn K, Boutros M, Teleman AA. eIF4A inactivates TORC1 in response to amino acid starvation. EMBO J. 2016;35:1058–76. [DOI] [PMC free article] [PubMed] [Google Scholar]
- 54. Schieke SM, Phillips D, McCoy JJ, Aponte AM, Shen R-F, Balaban RS, Finkel T. The mammalian target of rapamycin (mTOR) pathway regulates mitochondrial oxygen consumption and oxidative capacity. J Biol Chem. 2006;281:27643–52. [DOI] [PubMed] [Google Scholar]
- 55. Knight ZA, Schmidt SF, Birsoy K, Tan K, Friedman JM. A critical role for mTORC1 in erythropoiesis and anemia. eLife. 2014;3:645. [DOI] [PMC free article] [PubMed] [Google Scholar]
- 56. Land SC, Tee AR. Hypoxia-inducible factor 1α is regulated by the mammalian target of rapamycin (mTOR) via an mTOR signaling motif. J Biol Chem. 2007;282:20534–43. [DOI] [PubMed] [Google Scholar]
- 57. Dengler VL, Galbraith MD, Espinosa JM. Transcriptional regulation by hypoxia inducible factors. Crit Rev Biochem Mol Biol. 2013;49:1–15. [DOI] [PMC free article] [PubMed] [Google Scholar]
- 58. Stilling RM, van de Wouw M, Clarke G, Stanton C, Dinan TG, Cryan JF. The neuropharmacology of butyrate: the bread and butter of the microbiota-gut-brain axis?. Neurochem Int. 2016;99:110–32. [DOI] [PubMed] [Google Scholar]
- 59. Rivière A, Selak M, Lantin D, Leroy F, De Vuyst L. Bifidobacteria and butyrate-producing colon bacteria: importance and strategies for their stimulation in the human gut. Front Microbiol. 2016;7:979. [DOI] [PMC free article] [PubMed] [Google Scholar]
- 60. Somerville GA, Proctor RA. At the crossroads of bacterial metabolism and virulence factor synthesis in Staphylococci. Microbiol Mol Bio Rev. 2009;73:233–48. [DOI] [PMC free article] [PubMed] [Google Scholar]
- 61. Zhang S, Qiao S, Ren M, Zeng X, Ma X, Wu Z, Thacker P, Wu G. Supplementation with branched-chain amino acids to a low-protein diet regulates intestinal expression of amino acid and peptide transporters in weanling pigs. Amino Acids. 2013;45:1191–205. [DOI] [PubMed] [Google Scholar]
- 62. Zhang S, Ren M, Zeng X, He P, Ma X, Qiao S. Leucine stimulates ASCT2 amino acid transporter expression in porcine jejunal epithelial cell line (IPEC-J2) through PI3K/Akt/mTOR and ERK signaling pathways. Amino Acids. 2014;46:2633–42. [DOI] [PubMed] [Google Scholar]
- 63. Calder PC. Branched-chain amino acids: metabolism, physiological function, and application. J Nutr. 2006;136(Suppl):288S–93S. [DOI] [PubMed] [Google Scholar]
- 64. Fedotcheva NI, Kazakov RE, Kondrashova MN, Beloborodova NV. Toxic effects of microbial phenolic acids on the functions of mitochondria. Toxicol Lett. 2008;180:182–8. [DOI] [PubMed] [Google Scholar]
- 65. Beloborodova N, Bairamov I, Olenin A, Shubina V, Teplova V, Fedotcheva N. Effect of phenolic acids of microbial origin on production of reactive oxygen species in mitochondria and neutrophils. J Biomed Sci. 2012;19:89. [DOI] [PMC free article] [PubMed] [Google Scholar]
- 66. Di Martino ML, Campilongo R, Casalino M, Micheli G, Colonna B, Prosseda G. Polyamines: emerging players in bacteria–host interactions. Int J Med Microbiol. 2013;303:484–91. [DOI] [PubMed] [Google Scholar]
- 67. Tyler WA, Gangoli N, Gokina P, Kim HA, Covey M, Levison SW, Wood TL. Activation of the mammalian target of rapamycin (mTOR) is essential for oligodendrocyte differentiation. J Neurosci. 2009;29:6367–78. [DOI] [PMC free article] [PubMed] [Google Scholar]
- 68. Wahl SE, McLane LE, Bercury KK, Macklin WB, Wood TL. Mammalian target of rapamycin promotes oligodendrocyte differentiation, initiation and extent of CNS myelination. J Neurosci. 2014;34:4453–65. [DOI] [PMC free article] [PubMed] [Google Scholar]
- 69. Tyler WA, Jain MR, Cifelli SE, Li Q, Ku L, Feng Y, Li H, Wood TL. Proteomic identification of novel targets regulated by the mammalian target of rapamycin pathway during oligodendrocyte differentiation. Glia. 2011;59:1754–69. [DOI] [PMC free article] [PubMed] [Google Scholar]
- 70. Bercury KK, Dai J, Sachs HH, Ahrendsen JT, Wood TL, Macklin WB. Conditional ablation of Raptor or Rictor has differential impact on oligodendrocyte differentiation and CNS myelination. J Neurosci. 2014;34:4466–80. [DOI] [PMC free article] [PubMed] [Google Scholar]
- 71. Narayanan SP, Flores AI, Wang F, Macklin WB. AKT signals through the mammalian target of rapamycin pathway to regulate CNS myelination. J Neurosci. 2009;29:6860–70. [DOI] [PMC free article] [PubMed] [Google Scholar]
- 72. Norrmén C, Suter U. Akt/mTOR signalling in myelination. Biochem Soc Trans. 2013;41:944–50. [DOI] [PubMed] [Google Scholar]
- 73. Ehninger D, Han S, Shilyansky C, Zhou Y, Li W, Kwiatkowski DJ, Ramesh V, Silva AJ. Reversal of learning deficits in a Tsc2+/− mouse model of tuberous sclerosis. Nat Med. 2008;14:843–8. [DOI] [PMC free article] [PubMed] [Google Scholar]
- 74. Georgieff MK. Nutrition and the developing brain: nutrient priorities and measurement. Am J Clin Nutr. 2007;85(Suppl):614S–20S. [DOI] [PubMed] [Google Scholar]
- 75. Hoban AE, Stilling RM, Ryan FJ, Shanahan F, Dinan TG, Claesson MJ, Clarke G, Cryan JF. Regulation of prefrontal cortex myelination by the microbiota. Transl Psychiatry. 2016;6:e774. [DOI] [PMC free article] [PubMed] [Google Scholar]
- 76. Pegg AE. Toxicity of polyamines and their metabolic products. Chem Res Toxicol. 2013;26:1782–800. [DOI] [PubMed] [Google Scholar]
- 77. Semba RD, Shardell M, Ashour FAS, Moaddel R, Trehan I, Maleta KM, Ordiz MI, Kraemer K, Khadeer MA, Ferrucci L et al.. Child stunting is associated with low circulating essential amino acids. Ebiomedicine. 2016;6:246–52. [DOI] [PMC free article] [PubMed] [Google Scholar]
- 78. Lykke M, Hother A-L, Hansen CF, Friis H, Mølgaard C, Michaelsen KF, Briend A, Larsen T, Sangild PT, Thymann T. Malnutrition induces gut atrophy and increases hepatic fat infiltration: studies in a pig model of childhood malnutrition. Am J Transl Res. 2013;5:543–54. [PMC free article] [PubMed] [Google Scholar]
- 79. Toyoshima Y, Tokita R, Taguchi Y, Akiyama-Akanishi N, Takenaka A, Kato H, Chida K, Hakuno F, Minami S, Takahashi S-I. Tissue-specific effects of protein malnutrition on insulin signaling pathway and lipid accumulation in growing rats. Endocr J. 2014;61:499–512. [DOI] [PubMed] [Google Scholar]
- 80. Katre P, Joshi S, Bhat DS, Deshmukh M, Gurav N, Pandit S, Lubree H, Marczewski S, Bennett C, Gruca L et al.. Effect of multi-nutrient insufficiency on markers of one carbon metabolism in young women: response to a methionine load. Eur J Clin Nutr. 2015;70:687–93. [DOI] [PMC free article] [PubMed] [Google Scholar]
Associated Data
This section collects any data citations, data availability statements, or supplementary materials included in this article.