Abstract
Background:
Histamine is a critical mediator of IgE/mast cell-mediated anaphylaxis. Histamine is synthesized by decarboxylating the amino acid histidine, a reaction catalyzed by the Hdc-gene encoded enzyme histidine decarboxylase. However, regulation of the Hdc gene in mast cells is poorly understood.
Objective:
We sought to investigate the in vivo regulation of IgE/mast cell mediated anaphylaxis by transcription factors GATA2 and MITF and the mechanisms by which GATA2 and MITF regulate Hdc gene expression in mouse and human mast cells.
Methods:
mice deficient in the transcription factors Gata2, Ahr, Ahrr, or Bhlhe40 were assessed for anaphylactic reactions. Chromatin immunoprecipitation sequencing analysis identified putative Hdc enhancers. Luciferase reporter transcription assay confirmed enhancer activities of putative enhancers in the Hdc gene. The shRNA knock down approach was used to determine the role of MITF in regulating mouse and human HDC gene expression.
Results:
Connective tissue mast cell (CTMC)-specific Gata2 deficient mice failed to develop IgE/mast cell-mediated anaphylaxis. GATA2 induced the expression of Mitf, Ahr, Ahrr and Bhlhe40 in mast cells. MITF, but not AHR, AHRR or BHLHE40, was required for anaphylaxis. MITF bound to an enhancer located 8.8 kb upstream of the transcription start site of the Hdc gene and directed enhancer activity. MITF overexpression largely restored Hdc gene expression in the Gata2 deficient-mast cells. In human mast cell line LAD2, MITF was required for the HDC gene expression and histamine synthesis.
Conclusion:
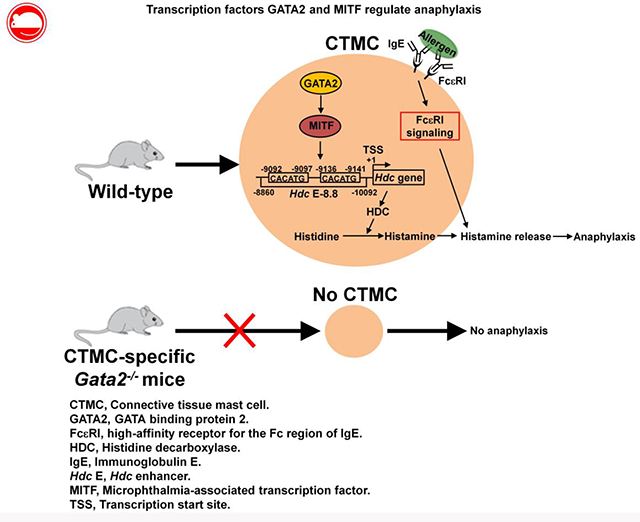
The transcription factors GATA2 and MITF regulate Hdc gene expression in mast cells and are required for IgE/mast cell-mediated anaphylaxis.
Keywords: mast cell, CTMC, GATA2, MITF, Hdc, enhancer, anaphylaxis, histamine synthesis
Capsule summary
Our study demonstrates that the transcription factors GATA2 and MITF play an essential role in IgE/mast cell-mediated anaphylaxis mainly by regulating Hdc gene in mast cells.
Graphical Abstract
INTRODUCTION
Anaphylaxis is a serious allergic reaction that is rapid in onset and includes signs and symptoms that involve the skin, gastrointestinal track, respiratory system and cardiovascular system1. The most severe form of anaphylaxis is anaphylactic shock, which is characterized by hypotension and can cause death1. Anaphylaxis can be caused by allergies to foods, insect venoms, medications and other agents1. The incidence of food-induced anaphylaxis has risen at an alarming rate, especially in children, in developed countries during the past several decades and continues to rise2–4 Understanding the molecular regulation of anaphylactic shock is an important step in developing effective prevention and treatment.
Mast cells are mononuclear protease granule-containing cells that display FcεRI, the high affinity receptor for IgE, on the cell surface. FcεRI is a heterotetramer composed of one IgE-binding α subunit, one membrane-tetraspanning β subunit and a dimer of disulfide-linked γ subunits. Mast cells can be activated by antigen (Ag) crosslinking of specific IgE that is associated with FcεRI. Mast cell activation by IgE/FcεRI crosslinking induces degranulation, with release of inflammatory mediators including histamine, and secretion of both pre-formed and newly synthesized cytokines. While cytokines induce allergic inflammation, histamine has a major role in causing IgE-mediated anaphylactic shock5–7. Mice genetically deficient in mast cells or depleted of mast cells by treatment with anti-stem cell factor antibody are unable to develop IgE-mediated anaphylactic shock6, 7 Amelioration of peanut allergy by treatment with the anti-IgE monoclonal antibody omalizumab supports the importance of IgE/mast cells in mediating human anaphylactic shock8.
Histamine is produced by the decarboxylation of the amino acid histidine, a reaction catalyzed by enzyme histidine decarboxylase9, 10. The Hdc gene encodes histidine decarboxylase, the rate-limiting enzyme that is essential for mouse and human histamine synthesis9, 11, 12 Mice deficient in the Hdc gene fail to synthesize histamine and have reduced or absent IgE-mediated anaphylactic responses13–16. There is only limited knowledge of how Hdc gene expression is regulated. The transcription factor SP1 binds to a GC box found in both the human and mouse Hdc gene promoters17, 18. Several promoter elements that negatively regulate Hdc gene transcription have been reported. For example, YY1 and KLF4 negatively regulate the Hdc gene by suppressing SP1 in a gastric cancer cell line19, 20.
GATA binding protein 2 (GATA2) is a member of the GATA family of transcription factors. GATA2 has been shown to be critical for survival and proliferation of hematopoietic stem cells21, 22, granulocyte-monocyte progenitor differentiation23 , and basophil and mast cell differentiation24,25. Recently, we demonstrated that GATA2 plays a critical role in regulating Hdc gene expression in mast cells26. However, the in vivo role of GATA2 in regulating IgE/mast cell-mediated anaphylaxis is not clear. Microphthalmia-associated transcription factor (MITF) plays a critical role in mast cell differentiation. A MITF null mutation results in loss of cKIT expression and severely impairs mast cell differentiation in C57BL/6 mice27, 28, although this mutation does not affect mast cell differentiation in WB mice because of overproduction of the cKIT ligand stem cell factor in this strain29. We reported that MITF is sufficient to induce the differentiation of common basophil/mast cell progenitor pre-BMPs into mast cells and is required to maintain mast cell identity30. However, it is unknown whether MITF regulates the Hdc gene in either mouse or human mast cells. Furthermore, the mechanisms by which GATA2 and MITF regulate the Hdc gene have not been investigated.
In this study, we have investigated the in vivo roles of GATA2 and MITF in IgE/mast cell-mediated anaphylaxis. We determined that GATA2 is required for CTMC differentiation and for maintaining the expression of genes required for anaphylaxis in vivo. MITF, but not other GATA2-dependent transcription factors, is critical for regulating IgE/mast cell-mediated anaphylaxis. We observed that MITF binds the −8.8 Hdc enhancer and is important for activities of its enhancer. Our results indicate that the transcription factors GATA2 and MITF control IgE/mast cell-mediated anaphylaxis mainly by regulating Hdc gene expression in mast cells.
METHODS
Mice
Mouse information is described in detail in the METHODS section of this article’s Online Repository at www.jacionline.org. All animal experiments were conducted according to protocols approved by the National Jewish Health Institutional Animal Care and Use Committee (Denver, CO).
FACS analysis and sorting
Cells prepared from various tissues were stained with fluorochrome-labeled antibodies. Stained cells were acquired by CyAN (DakoCytomation, Glostrup, Denmark) and analyzed using FlowJo software (Tree Star, Ashland, OR). Cell sorting was carried out using a Moflo cytometer (DakoCytomation). A more detailed description of cell surface markers used is included in the METHODS section in this article’s Online Repository at www.jacionline.org.
Quantitative RT-PCR (qPCR)
qPCR measurements were performed as described in detail under METHODS of the Online Repository. Primer sequences are listed in Table E1 of the Online Repository. qPCR analysis was carried out as described in detail in the METHODS section in this article’s Online Repository at www.jacionline.org.
Passive cutaneous anaphylaxis (PCA)
Mice were sensitized with IgE anti-2, 4, 6-Trinitrophenyl (TNP) antibody and challenged with TNP-BSA (300μg /300 μl PBS) and 0.5% Evans blue dye via intravenous injection. Thirty minutes after challenge, the ears were collected and incubated in dimethylformamide for 48 hours, after which the absorbance of the dimethylformamide at 620 nm (OD620 nm) was measured. See the METHODS in this article’s Online Repository at www.jacionline.org for further details.
Passive systemic anaphylaxis (PSA)
Mice were sensitized with 10 μg of IgE anti-TNP antibody and challenged with 10 μg of TNP-BSA. Rectal temperatures of the challenged mice were measured before challenge (0 min) and at 5, 10, 15, 20, 25, 30, 40, 60, 80, 100 and 120 minutes after challenge. See the METHODS in this article’s Online Repository at www.jacionline.org for further details.
Chromatin Immunoprecipitation Sequencing (ChIP-seq)
DNA fragments associated with histone H3 lysine 4 monomethylation (H3K4me1) or H3 lysine 27 acetylation (H3K27ac) were immunoprecipitated using respective specific antibodies obtained from Abcam (Cambridge, MA). The immunoprecipitated DNA fragments were repaired, ligated to adapters, and size selected to libraries, which were sequenced as reported previously31. Reads were aligned to the mouse reference genome and peaks were called comparing an immunoprecipated sample to its corresponding input sample. ChIP-seq data were visualized using the Integrative Genomics Viewer (IGV)32, 33. Data may be accessed at the Gene Expression Omnibus (GEO) database (http://www.ncbi.nlm.nih.gov/geo, GSE97253). See the METHODS in this article’s Online Repository at www.jacionline.org for further details.
Statistical analysis
All the error bars in this report represent standard error of mean (SEM). For ELISA, qPCR, and luciferase analyses, mean ± SEM were derived from data pooled from two or three independent experiments. Results from each independent experiment are detailed in supplemental figures in this article’s Online Repository at www.jacionline.org. Differences between paired samples were analyzed using Student’s t test. The changes at various time points before and after challenge in PSA analyses were analyzed using a two-way repeated measure ANOVA.
Other methods including cell culture, histology, ELISA measurements, plasmid construction, adoptive transfer of BMMCs, luciferase reporter assay, retroviral infection, ChIP, and cholera toxin treatment of BMMCs, are included in the METHODS in this article’s Online Repository at www.jacionline.org.
RESULTS
GATA2 is critical for CTMC differentiation and IgE/mast cell-mediated anaphylaxis
GATA2 exerts its functions at multiple developmental stages of hematopoiesis. Previously, we reported that Gata2 mRNA expression is upregulated in common basophil and mast cell progenitors (pre-BMPs)26. GATA2 is required for the differentiation of pre-BMPs into mast cells and for maintaining gene expression in mast cells in vitro26. However, the in vivo roles of GATA2 in mast cell differentiation and maintenance have not been investigated. To address this, we generated CTMC-specific Gata2-deficient mice by crossing Gata2f/f mice to CTMC-specific Mcpt5-Cre mice34. Gata2f/f Mcpt5-Cre mice exhibited a nearly complete deficiency of mast cells in the ear skin, stomach, trachea and peritoneal cavity, while having comparable number of basophils (Fig 1, A and B) and T cells, B cells, DCs, NK cells, neutrophils and macrophages (see Fig E1 in this article’s Online Repository at www.jacionline.org). Thus, we refer to Gata2f/f Mcpt5-Cre mice as CTMC-deficient mice.
FIG 1.
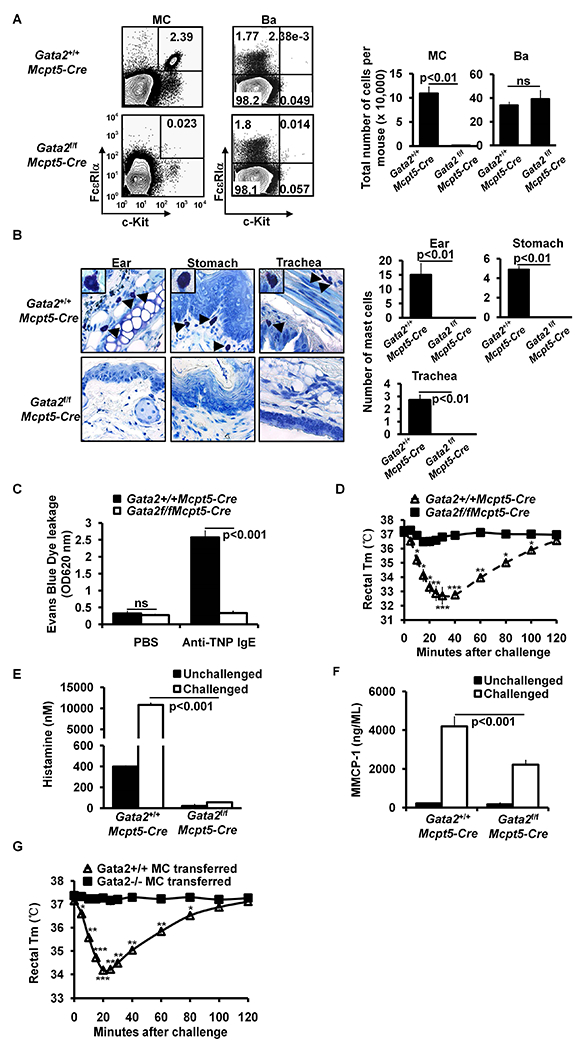
GATA2 is critical for connective tissue mast cell differentiation and IgE/mast cell-mediated anaphylaxis. A, Flow analysis of peritoneal cavity mast cells (MC) and bone marrow basophils (Ba). Total number of cells (mean ± SEM, n=3 mice) (right panel). B, Toluidine blue staining of mast cells (magnification 3×40; insert, 3×100). Mast cells are indicated by arrows. Average number of mast cells in ten randomly selected fields (mean ± SEM, n=3 mice). C, PCA analysis, mean ± SEM, n = 3 mice; D, PSA analysis, mean ± SEM, n = 6 mice. E, ELISA analysis of histamine, mean ± SEM, n=3 samples from 3 individual mice. F, ELISA analysis of MMCP-1 (mean ± SEM, n=3 samples from 3 individual mice). G, PSA analysis of the Gata2f/fMcpt5-Cre mice reconstituted BMMCs (mean ± SEM, n=5 mice). Statistical differences were analyzed by student’s t test (A, B, C, E, F) or by ANOVA (D, G). *: p<0.05; **: p<0.01; ***: p<0.001.
To analyze whether connective tissue mast cell-deficient mice have compromised mast cell functions, we performed passive cutaneous anaphylaxis (PCA), an assay that measures cutaneous mast cell degranulation, as well as passive systemic anaphylaxis (PSA). We found that CTMC-deficient mice failed to develop PCA and PSA in response to antigen (Ag) and Ag-specific IgE crosslinking of FcεRI (Fig. 1, C and D). These mice failed to release histamine 5 minutes after antigen challenge (5% of controls) (Fig 1, E). MMCP-1 is a protease predominantly expressed by mucosal mast cells35. To determine whether CTMC-deficient mice retain the ability to produce MMCP-1, we examined MMCP-1 levels in the serum of the sensitized and challenged mice and found that CTMC-deficient mice produced 47% less MMCP-1 than WT controls (Fig 1, F), suggesting that approximately half of mucosal mast cells in Gata2f/f Mcpt5-Cre mice are also impaired by the absence of the Gata2 gene. These data demonstrate that GATA2 is critical for CTMC differentiation and function in vivo and suggest that GATA2 also contributes to the differentiation and function of mucosal mast cells that express MMCP1.
To distinguish the role of GATA2 in maintaining the expression of genes that are required for mediating anaphylaxis from its role in connective tissue mast cell differentiation, we acutely deleted the Gata2 gene in differentiated Bone Marrow-derived Mast Cells (BMMCs) and tested whether Gata2−/− BMMCs restore the ability of CTMC-deficient mice to develop anaphylactic reactions. To prepare Gata2−/− BMMCs, we treated BMMCs cultured from conditional Gata2 knockout (Gata2f/fRosaYfp/YfpTgCreErt2hemi mice) or littermate control mice (Gata2+/+RosaYfp/YfpTgCreErt2hemi mice) with 4 hydroxytamoxifen (4HT) for 11 days to delete the Gata2 gene as described previously26. YFP+Gata2 −/− BMMCs and the control YFP+Gata2+/+ BMMCs were FACS-sorted and transferred into recipient CTMC-deficient mice. Our results show that Gata2−/− BMMCs failed to restore IgE-mediated anaphylaxis in CTMC-deficient mice, whereas Gata2+/+ BMMCs completely restored the ability of CTMC-deficient mice to develop anaphylaxis (Fig 1, G). Our data establish that GATA2 is essential in maintaining the expression of genes that are required for anaphylaxis.
The transcription factor MITF, but not AHR, AHRR or BHLHE40, regulates Hdc gene expression and IgE/mast cell-mediated anaphylaxis
Our previous study showed that GATA2 is critical for Hdc gene expression in mast cells26. However, it remained unclear whether GATA2 directly regulates the Hdc gene or regulates it indirectly by inducing the expression of Hdc gene-regulating transcription factors. Mast cells express higher levels of Hdc transcripts36. Therefore, we reasoned that transcription factors that are highly expressed in mast cells, but not in basophils, are more likely to play a role in regulating the Hdc gene. We analyzed our published microarray data that profiled gene expression in mast cells versus basophils30 and identified 15 transcription factor genes that are expressed to a much greater extent in mast cells than in basophils. These include Mitf, Ahrr, Ahr, Hic1, Mecom, Bhlhe40, Batf1, Eid2, Id2, Mdfic, Meis1, Mzf1, Pgr, Tal1 and Zfhx3 (Fig. 2, A). In this study, we selected transcription factor genes Mitf, Ahr, Ahrr and Bhlhe40 for further study because MITF has been shown to play a critical role in mast cell differentiation and because mice deficient in Ahr37, Ahrr (NIH Knockout Mice Project) and Bhlhe4038 genes are available, which allowed investigation of the role of these genes in mast cell differentiation by both gene deletion and gene suppression (shRNA) approaches. Using qPCR, we verified that Mitf, Ahr, Ahrr and Bhlhe40 mRNA were expressed to a much greater extent_in mast cells than in basophils [fold difference (mast cells/basophils): Mitf 8.8, Ahr 33.2, Ahrr 17.2 and Bhlhe40 19.8] (Fig. 2, B). Furthermore, expression of these transcription factor genes in mast cells is dependent on GATA2 (percentages of reduction in Gata2−/− BMMCs: Ahr 79.9%, Ahrr 94.5%, Bhlhe40 86.8%, and Mitf 60.8%) (Fig 2, C).
FIG 2.
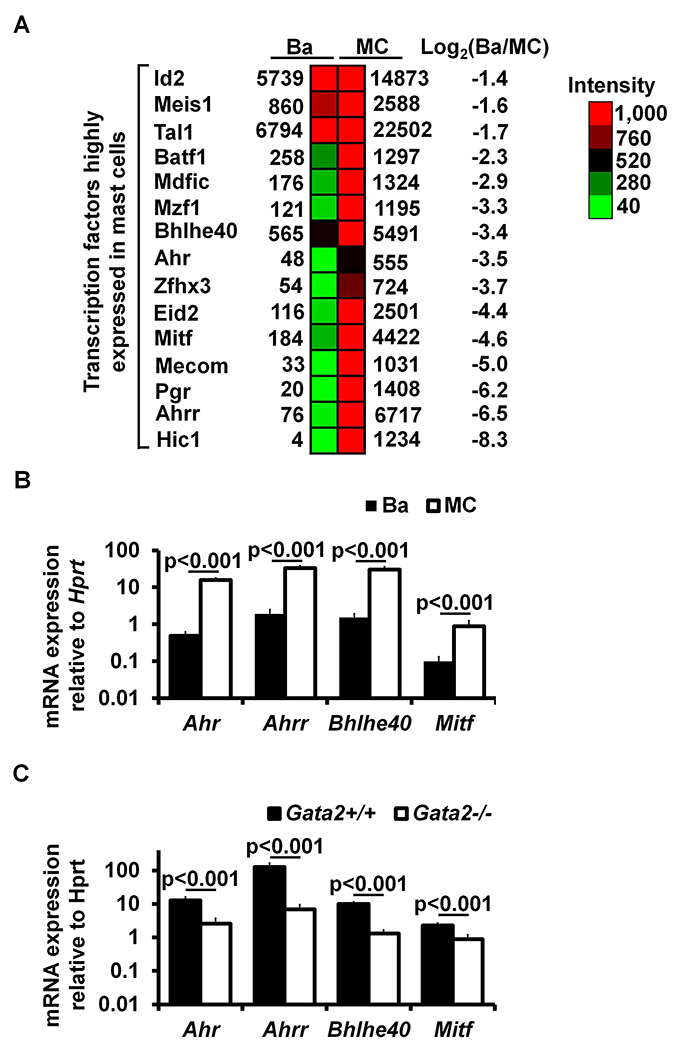
Transcription factors AHR, AHRR, BHLHE40, and MITF depend on GATA2 for their expression in mast cells. A, Microarray analysis of transcription factor expression profiles in BMMCs versus basophils. B, qPCR analysis of mRNA expression in BMMCs versus basophils. The numbers indicate the fold of difference in mRNA expression between basophils and BMMCs (mean ± SEM, n=3 samples from 3 individual mice). C, qPCR analysis of mRNA expression in Gata2+/+ or Gata2−/− BMMCs (mean ± SEM, n=3 samples from 3 individual mice).
Mitf null mutant mice on a C57B1/6 background do not develop mature mast cells39, 40. To determine whether the GATA2-dependent transcription factors MITF, AHR, AHRR and BHLHE40 regulate the Hdc gene, we used a shRNA knockdown approach. We examined Hdc mRNA expression in BMMCs with knocked down Mitf (shMitf), Ahr (shAhr), Ahrr (shAhrr), or Bhlhe40 mRNA expression (shBhlhe40). We found that Hdc mRNA expression was significantly diminished (70% reduction) in BMMCs with knocked down Mitf mRNA expression (Fig 3, A), but not in BMMCs with knocked down Ahr, Ahrr or Bhlhe40 mRNA (Fig 3, B). BMMCs with knocked down Mitf mRNA also synthesized less histamine (68% reduction) (Fig 3, A). BMMCs with knocked down Mitf mRNA, but not with control shRNA targeting random sequences or with knocked down Ahr, Ahrr, or Bhlhe40 mRNA, failed to restore anaphylaxis in CTMC mice (Fig 3, C).
FIG 3.
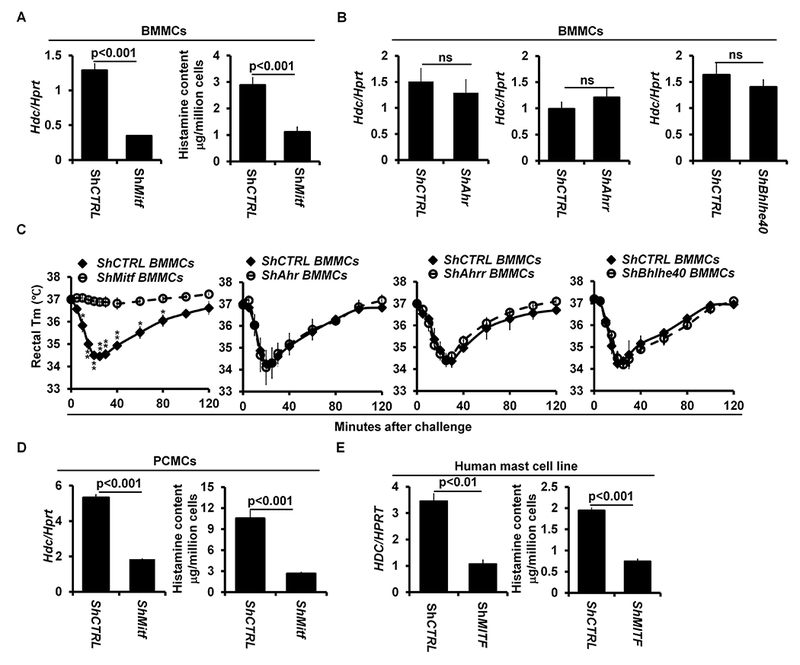
Transcription factors MITF, but not AHR, AHRR or BHLHE40, regulate Hdc gene expression and IgE/mast cell-mediated anaphylaxis. A, qPCR analysis of Hdc mRNA expression in BMMCs with knocked down Mitf mRNA (shMitf) or with shRNA control (shCTRL) (mean ± SEM, n=3 samples from 3 individual mice). ELISA analysis of the histamine contents in BMMCs with knocked down Mitf mRNA (shMitf) or with shRNA control (mean ± SEM, n=3 samples from 3 individual mice) (right panel). B, qPCR analysis of Hdc mRNA expression in BMMCs with knocked down Ahr mRNA (shAhr), Ahrr mRNA (shAhrr) and Bhlhe40 mRNA (shBhlhe40) or with shRNA control (shCTRL) (mean ± SEM, n=3 samples from 3 individual mice). C, PSA analysis of Gata2f/f Mcpt5-Cre mice reconstituted with BMMCs with knocked down Mitf mRNA (n=4 mice), Ahr mRNA (n=3 mice), Ahrr mRNA (n=3 mice), Bhlhe40 mRNA (n=3 mice) or with shRNA control (n=4 mice). Statistical differences in PSA analysis were analyzed by ANOVA. *: p<0.05; **: p<0.01. D, qPCR analysis of Hdc gene expression (left panel) and ELISA analysis of histamine content (right panel) in PCMCs with knocked down Mitf mRNA (shMitf) or with shRNA control (shCTRL) (mean ± SEM, n=3 samples from 3 individual mice). E, qPCR analysis HDC gene expression (left panel) and ELISA analysis of the histamine contents (right panel) in the human mast cell line LAD2 with knocked down Mitf mRNA (shMitf) or with shRNA control (shCTRL) (mean ± SEM, n=3 transduced samples).
BMMCs are considered to be immature because they contain low levels of histamine41, 42. To determine whether MITF is also required for Hdc mRNA expression and histamine synthesis in mature mast cells, we knocked down Mitf mRNA expression in mature peritoneal cavity mast cells (PCMCs) and found that PCMCs with knocked down Mitf mRNA expressed 65% less Hdc mRNA-and synthesized 75% less histamine than normal control mast cells (Fig 3, D). Knockdown of Mitf mRNA expression did not lead to mast cell death or down regulation of Fcer1a mRNA expression (see Fig E5 in this article’s Online Repository at www.jacionline.org).
To verify the results obtained using the shRNA knockdown approach, we examined the Hdc mRNA in mature PCMCs of Ahr−/−, Ahrr−/− or Bhlhe40−/− mice. Consistent with the results obtained using shRNAs, comparable levels of Hdc mRNA expression were observed in the mature PCMCs derived from Ahr−/−, Ahrr−/− or Bhlhe40−/− mice and littermate control mice (see Fig E6 in this article’s Online Repository at www.jacionline.org). In agreement with these findings, Ahr−/− (see Fig E7A), Ahrr−/− (see Fig E8A) and Bhlhe40−/− mice (see Fig E9A) had normal numbers of mast cells in the ear skin, stomach, trachea and peritoneal cavity. These mice also developed normal PCA (see Fig E7B, Fig E8B and Fig E9B) and PSA (see Fig E7C, Fig E8C and Fig E9C in this article’s Online Repository at www.jacionline.org).
A recent study comparing mouse and human mast cell gene signatures found considerable similarity in gene expression between mast cells from these two species43. This observation prompted us to investigate whether MITF regulates the Hdc gene in human mast cells. We knocked down human MITF mRNA expression in LAD2 human mast cells, which have high levels of HDC mRNA and histamine44. LAD2 cells with knocked down Mitf mRNA expressed 69% less HDC mRNA and synthesized 62% less histamine than negative control LAD2 cells (Fig 3, E). Collectively, these results demonstrate that MITF, but not any of the other GATA2-dependent transcription factors, regulates Hdc gene expression and histamine synthesis in both mouse and human mast cells as well as IgE/mast cell-mediated anaphylaxis in mice.
Identification of putative Hdc enhancers
Although our experiments established roles for MITF in regulating the Hdc gene and anaphylaxis, they did not provide evidence that MITF directly regulates the Hdc gene. To address this, we studied MITF binding of Hdc enhancers. Epigenomic studies demonstrate that monomethylation of lysine 4 on histone 3 (H3K4me1) marks genes that are poised to be transcribed, whereas acetylation of lysine 27 on histone 3 (H3K27ac) identifies genes that are actively being transcribed. The combined presence of H3K4me1 and H3K27ac modifications predicts enhancer activity45–49. To detect these marks genome-wide, we performed H3K4me1 and H3K27ac ChIP-seq analysis of BMMCs. We used BMMCs because they recapitulate the Hdc gene expression in peritoneal mast cells analyzed directly ex vivo. We found two putative Hdc enhancers (defined by both H3K4me1 and H3K27ac histone modifications) located −8.8 kb upstream and +0.3 kb downstream from the transcription start site (TSS) of the Hdc gene (indicated in Fig 4, A by red lines). We also note that there are two H3K4me1 peaks located around the +8.5 kb region. However, H3K27ac peaks in the locations were insignificant based on our peak calling statistical analysis (Fig 4, A). Thus, we did not consider these two H3K4me1 peaks further as putative Hdc enhancers.
FIG 4.
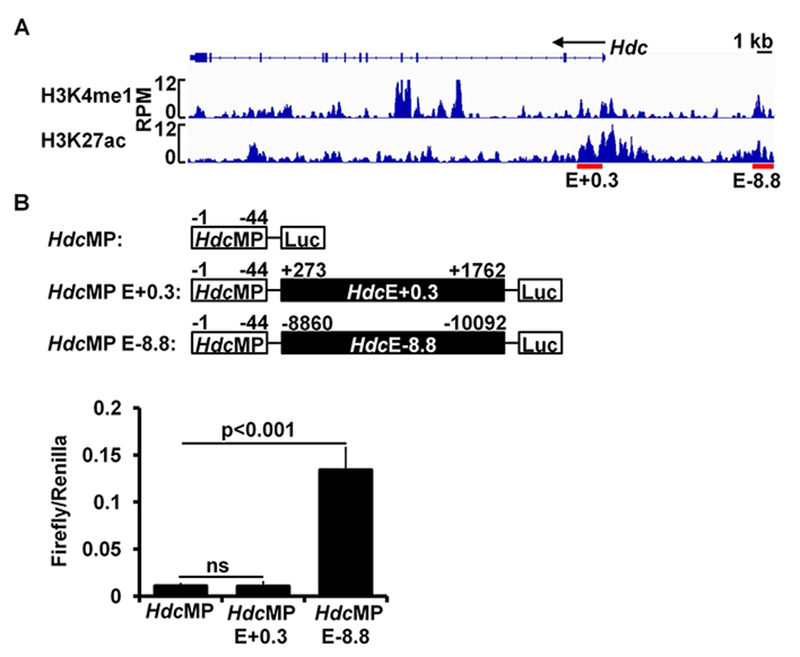
Identification of putative Hdc enhancers. A, BMMCs were used for ChIP-seq (duplicate samples were used for H3K4me1 ChIP-seq and triplicate samples were used for H3K27ac ChIP-seq). H3K4me1 and H3K27ac ChIP-seq data were analyzed with the Integrative Genomics Viewer. Red bars indicate putative Hdc enhancers that show significant H3K4me1 and H3K27ac modifications. RPM: reads per million nucleotides; E: enhancer, +0.3 indicates the distance from the beginning of the downstream Hdc enhancer to the TSS of the Hdc gene, and −8.8 indicates the distance from the beginning of the upstream Hdc enhancer to the TSS of the Hdc gene. B, Scheme of the luciferase constructions (upper panel) and luciferase reporter analysis of the Hdc enhancer activities in the CFTL-15 mast cell line_(lower panel). Error bars represent mean ± SEM, n=3 transfectants. HdcMP: Hdc minimal promoter.
To determine whether the putative Hdc enhancers function in Hdc gene transcription, we constructed a luciferase reporter gene in which luciferase expression is under the control of the Hdc minimal promoter (−44 to +1 relative to the TSS) and the −8.8 or +0.3 Hdc enhancer (a schematic diagram is shown in Fig 4, B upper panel). We found that the −8.8 Hdc enhancer dramatically increased the activity of the Hdc minimal promoter (13.4-fold increase) (Fig 4, B, lower panel), whereas the +0.3 Hdc enhancer failed to show significant enhancer activity.
MITF binds to the −8.8 Hdc enhancer and drives its activity
To determine whether MITF binds to the −8.8 Hdc enhancer, we aligned our H3K4me1 and H3K27ac ChIP-seq data from this region with the published MITF ChIP-seq data50 and found one statistically significant MITF-binding peak in the −8.8 Hdc enhancer (Fig 5, A). Our ChIP-qPCR analysis of MITF binding in BMMCs revealed that among five predicted MITF-binding sites located within the −8.8 and +0.3 Hdc enhancers (Fig 5, A), MITF binding was only detected at two MITF-binding sites located in the −8.8 Hdc enhancer (e.g., MITF-binding sites 3 and 4, a 6.3-fold enrichment found in the combined binding sites) (Fig 5, B).
FIG 5.
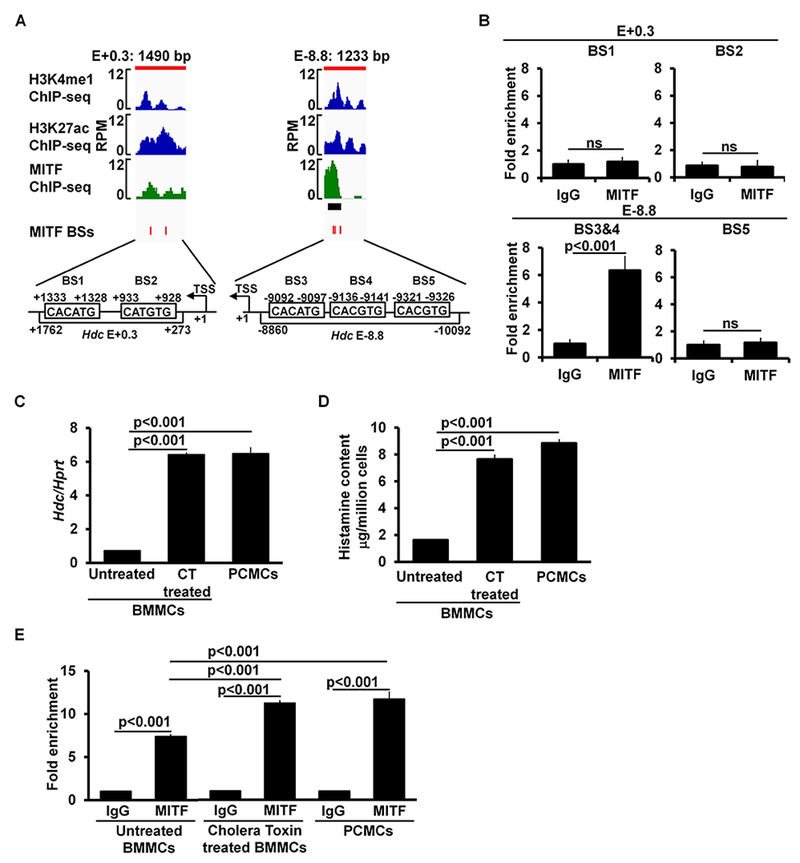
MITF binds to the −8.8 enhancer in immature and mature mast cells. A, Enlarged ChIP-seq peak plots of the Hdc E-8.8 region and Hdc E+0.3. The published MITF ChIP-seq data were aligned with our H3K4me1 and H3K27ac ChIP data using the Integrative Genomics Viewer. The black bar beneath the MITF ChIP-seq peak plot indicates the MITF-binding peak that is statistically significant. The red bars indicate the positions of consensus MITF-binding sites (BSs). B, ChIP-qPCR analysis of MITF binding (mean ± SEM, n=2 samples from 2 independent experiments). BMMCs, anti-MITF antibody or control IgG was used for immunoprecipitation. C, qPCR analysis of the Hdc mRNA expression (mean ± SEM, n=3 samples from 3 individual mice); D, ELISA analysis of histamine content (mean ± SEM, n=3 samples from 3 individual mice); and E, ChIP-qPCR analysis of MITF binding in untreated BMMCs, cholera toxin treated BMMCs, and PCMCs (mean ± SEM, n=3 samples from 3 independent experiments). CT: Cholera Toxin.
BMMCs and the CFTL-15 mast cells that we used to analyze Hdc enhancer activity are considered to be immature mast cells because they contain low amounts of histamine and express fewer receptors for IgE than mature mast cells51–53. To determine whether the binding of MITF to the −8.8 Hdc enhancer increases in mature mast cells, we measured MITF binding both in BMMCs that were induced to mature and in mature PCMCs. BMMCs were induced to mature by cholera toxin treatment as reported54. We found that Hdc mRNA expression levels and histamine content were enhanced 8.9- and 4.7-fold, respectively, by cholera toxin treatment (Fig 5, C and D). Concomitantly, the binding of MITF to the −8.8 Hdc enhancer also increased to levels similar to those of mature PCMCs [Fold enrichment (anti-MITF antibody/IgG): untreated BMMCs 7.4, cholera toxin-treated BMMCs 11.2 and PCMCs 11.7] (Fig 5, E).
To determine whether MITF activates −8.8 Hdc enhancer activity, we prepared CFTL-15 mast cells with control or knocked down Mitf mRNA, followed by transfection of the −8.8 Hdc enhancer luciferase reporter gene construct. The −8.8 Hdc enhancer lost ~60% of its activity in the presence of knocked down (by 80%) Mitf mRNA (Fig 6, A). Conversely, overexpression of MITF in a non-mast cell line greatly increased the activity of the −8.8 Hdc enhancer (8.2-fold increase) (Fig 6, B). Mutations in MITF-binding sites 3 and 4, but not MITF-binding site 5, abolished the MITF/−8.8 Hdc enhancer-driven luciferase reporter gene activity (percentages of reduction: BS3 Mut, 98%; BS4 Mut, 92% and BS345 Mut, 92%) (Fig 6, C). Taken together, our results demonstrate that MITF directly binds to the −8.8 Hdc enhancer in immature as well as mature mast cells and activates the enhancer.
FIG 6.
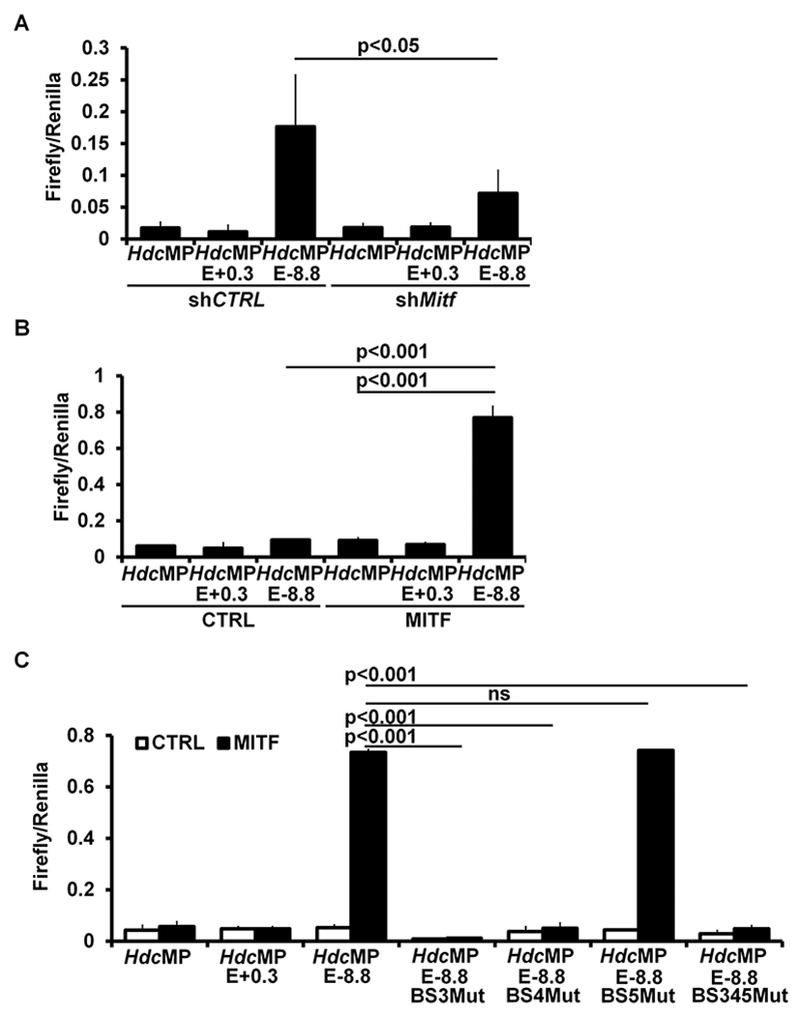
MITF drives the −8.8 Hdc enhancer activity. A, Luciferase reporter gene analysis of Hdc enhancer activities in CFTL-15 cells with knocked down Mitf mRNA or shRNA control (mean ± SEM, n=2 transfectants). B. Luciferase reporter gene analysis of the Hdc enhancer activities in HEK293 cells co-transfected with vector control or the MITF expression construct (mean ± SEM, n=2 transfectants). C. Luciferase reporter gene analysis of the activity of Hdc enhancers that have a mutated MITF binding site(s) (mean ± SEM, n=2 transfectants).
MITF is sufficient to fully restore Kit and Fcer1a gene expression but only partially restores Hdc gene expression
Having established that expression of the Mitf gene in mast cells is GATA2-dependent and that MITF directly regulates the Hdc gene, we investigated whether MITF is sufficient to upregulate Hdc gene expression in the absence of the Gata2 gene. To prepare Gata2−/− BMMCs that overexpress MITF (Mitf+ Gata2−/− BMMCs), Gata2f/f × ERT2-Cre BMMCs were retrovirally transduced with recombinant retrovirus for enforced expression of MITF. Next, Mitf+ Gata2f/f BMMCs were acutely depleted of the Gata2 gene by 4HT treatment for 11 days26. Our results confirmed that overexpression of MITF is sufficient to drive the expression of the Kit and Fcer1a genes (Fig 7, A), but only partially restored Hdc gene expression ~63% relative to the wild-type control (Fig 7, B). In contrast, overexpression of GATA2 completely restored Hdc gene expression (146% of wild-type) (Fig 7, B). Together, these results indicate that GATA2 regulates Hdc expression though inducing MITF, and that additional GATA-2 dependent mechanisms are required for full expression of the Hdc gene in mast cells.
FIG 7.
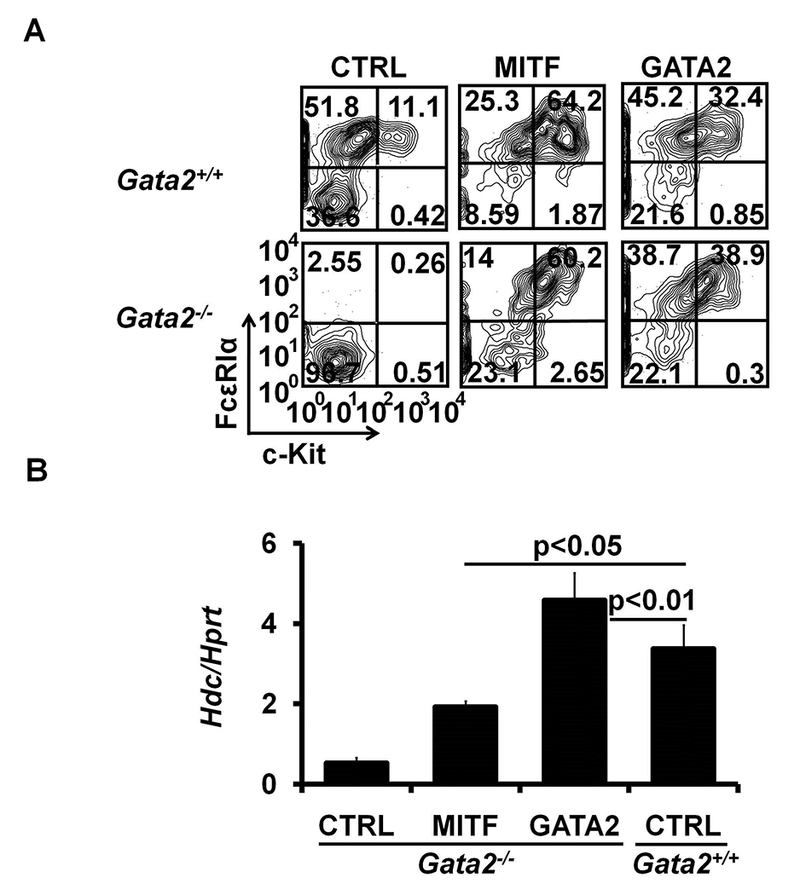
MITF is sufficient to fully restore cKIT and FcεRI expression but can only partially restore Hdc gene expression. A, Flow analysis of cKIT and FcεRI expression in Gata2−/− BMMCs overexpressing MITF, GATA2 or control vector (CTRL). YFP+ GFP+ cell populations are shown. Data represent three independent experiments with similar results. B, qPCR analysis of the Hdc mRNA expression in Gata2−/− BMMCs overexpressing MITF, GATA2 or a control vector (CTRL). YFP+ GFP+ BMMCs were FACS-sorted for qPCR analysis. Error bars represent mean ± SEM, n=3 samples from 3 independent experiments.
DISCUSSION
Our results demonstrate that a GATA2-MITF regulatory circuit controls IgE/mast cell-mediated anaphylaxis in mast cells. Previous studies established that GATA2 plays a crucial role in mast cell development. We and others have demonstrated that GATA2 is essential for the differentiation of pre-BMPs into mast cells and is required for maintaining the molecular program that defines mast cells in vitro26, 55. In this study, we present evidence that GATA2 is required for the differentiation of CTMCs in vivo. Although CTMC-deficient mice failed to release histamine in response to Ag and Ag-specific IgE crosslinking of FcεRI, these mice retained the capacity to secrete mast cell protease MMCP1, albeit in reduced amounts. Our findings are consistent with evidence that CTMCs play a major role in inducing anaphylaxis56. Taking advantage of the CTMC-deficient mice in adoptive transfer experiments, we demonstrated that GATA2 was essential for maintaining the ability of mast cells to mediate anaphylaxis in response to Ag and Ag-specific IgE crosslinking of FcεRI.
Our study sheds light on molecular mechanisms by which transcription factors regulate IgE/mast cell-mediated anaphylaxis. We and others previously confirmed that GATA2 is the major transcription factor required for maintaining the expression of many, if not all, mast cell signature genes26, 55. These results indicated that GATA2 initiates a regulatory hierarchy composed of many transcription factors that synergistically control expression of mast cell-specific genes. Here, we show that GATA2 induces the expression of the transcription factor-encoding Mitf, Ahr, Ahrr and Bhlhe40 genes. We also found that the expression of Ahr, Ahrr and Bhlhe40 depends on MITF (Li et. al. unpublished data), indicating that MITF functions at a higher level within the hierarchy than AHR, AHRR and BHLHE40. Consistent with this model, MITF is critically involved in regulating the expression of Hdc, as well as additional genes in mast cells (Li et. al. unpublished data). Our data obtained with both gene deletion and shRNA approaches demonstrate that AHR, AHRR and BHLHE40 are not required for Hdc gene expression. However, we should interpret these findings with caution. We do not rule out the possibility that AHR, AHRR or BHLHE40 redundantly regulate the Hdc gene in mast cells.
Enhancers and their associated transcription factors are critical regulators of cell-specific gene expression49, 57 We used active histone marks to localize two potential Hdc gene enhancers. We demonstrate that MITF directly binds and activates the −8.8 kb upstream Hdc enhancer. Because transfection efficiency of mature primary mast cells is inefficient, we transfected CFTL-15 mast cells with the Mitf and luciferase reporter genes to analyze Hdc enhancer activity. CFTL-15 mast cells are thought to resemble immature mast cells because they contain low amounts of histamine and express fewer receptors for IgE than mature PCMCs58. Our results provide evidence that MITF also regulates the Hdc gene expression in mature mast cells. MITF binding to the −8.8 Hdc enhancer concomitantly was increased when BMMCs were induced to mature to cells with higher Hdc gene expression. Although the increase in MITF binding was moderate compared with the increase in Hdc gene expression as BMMCs matured, we propose that this moderate increase in MITF binding might correlate with greater Hdc transcriptional output when the MITF binding is put into context with the Hdc promoter and other potential Hdc enhancers. Furthermore, we demonstrated that Mitf gene expression is required to maintain Hdc gene expression in mature mast cells. In contrast to the −8.8 enhancer, the +0.3 downstream Hdc enhancer lacks detectable_enhancer activity. However, the in vivo importance of this enhancer in Hdc gene transcription cannot be ruled out by the luciferase reporter gene transcription assay alone.
Although mouse and human mast cells share expression of similar genes programs, direct evidence that MITF plays a critical role in regulating Hdc gene expression and histamine synthesis in human mast cells lays a solid foundation for future studies of how the human HDC gene are transcriptionally regulated. This will enable a more comprehensive understanding of how histamine synthesis and release are controlled.
Although MITF fully restored c-Kit and FcεR1αexpression, it only restored Hdc gene transcription to an average of 63% of wild-type amounts. This suggests that in addition to inducing MITF expression, GATA2 is directly involved in regulating the Hdc gene. Feed-forward loop transcription circuits regulate gene expression in many developmental systems59. This regulation involves three classes of factors. First, a primary transcription factor gene (gene product) regulates the expression of a second transcription factor gene. The primary and secondary transcription factors bind the regulatory region of a third (target) gene and cooperatively regulate its transcription59. Our data support GATA2, MITF and the Hdc gene form a feed-forward loop. In this mode of action, it is possible that in addition to inducing MITF expression, GATA2 maintains the accessibility of the Hdc promoter and/or enhancers, and that GATA2 may function by coordinating interactions between promoter and enhancers modules. It is also possible that GATA2 cooperates with MITF to optimally transcribe the Hdc gene. Thus, our findings that GATA2 and MITF regulate IgE/mast cell-mediated anaphylaxis mainly by regulating the Hdc enhancer add new knowledge how enhancers and their associated transcription factors_regulate anaphylaxis.
Genes are typically regulated by a set of transcription factors that bind together to clustered binding sites within an enhancer region49, 60, 61. One of the best-studied examples is the human IFNB enhancer, which is activated by multiple transcription factors in response to intracellular signaling pathways62. Our findings confirm a central role for MITF in coordinating a cluster of transcription factor-binding sites within the Hdc enhancer to regulate histamine synthesis. Future studies will address how Hdc enhancers interact with the Hdc promoter, as well as how other transcription factors cooperatively regulate the Hdc gene.
METHODS
Mice
Gata2f/f mice (B6.129-Gata2tm1Sac/Mmmh)E1 were purchased from the Mutant Mouse Regional Resource Center (the mutant mouse regional resource center at University of California-Davis, Davis, CA). Inducible Gata2 knockout mice (Gata2f/fRosaYfp/YfpTgCreErt2hemi mice) were generated by crossing Gata2f/fmice to Cre activity reporter RosaYfp/Yfp miceE2 [B6.129X1-Gt(ROSA)26Sortm1(EYFP)Cos/J, the Jackson Lab, Bar Harbor, ME] and inducible Cre mice [B6. Cg-Tg(CAG-cre/Esr1*)5Amc/J]E3 (the Jackson Lab) as described E4. These mice were backcrossed to the C56BL/6 background for 4 generations. Connective tissue mast cell-specific Gata2 deficient mice (Gata2f/f Mcpt5-Cre mice) were generated by crossing Gata2f/f mice to connective tissue mast cell-specific Cre miceE5 [Mcpt5-Cre mice, B6-Tg(Cma1-cre)/ARoer, provided by Dr. Axel Roer via Dr. Jim Hagman, Denver, CO]. These mice were backcrossed to the C56BL/6 background for 5 generations. Mast cell-specific Ahr deficient mice (Ahrf/fCpa3-Cre mice) were generated by crossing Ahrf/f miceE6 (B6-Ahrtm3.1Bra/J, the Jackson Lab) to the mast cell-specific Cre miceE7 [Cpa3-Cre mice, B6-Tg(Cpa3- cre)4Glli/J, the Jackson Lab]. Ahrr−/− sperm with the FRT flanked Neo and floxed Ahrr gene (Ahrrtm1a(KOMP)Wtsi) were purchased from the NIH knockout mouse project repository (University of California-Davis, Davis, CA). Our core facility (National Jewish Health, Denver, CO) performed in vitro fertilization and generated Ahrr knockout first mice (referred to as Ahrr−/− mice). Bhlhe40−/− mice (B6.129.CD1-Bhlhe40tm1Rhli) were generated by Dr. Robert H LipskyE8 and provided by Dr. Mark Mattson of the National Institutes of Health (Bethesda, Maryland). These mice were on a B6.129 mixed genetic background (backcrossed to the C56BL/6 background for one generation). All animal experiments were conducted according to protocols approved by the National Jewish Health Institutional Animal Care and Use Committee.
FACS analysis and sorting
For fluorescence activated cell sorting (FACS) analysis of basophils, mast cells, cells obtained from the bone marrow and peritoneal cavity were stained with the following antibodies: basophils and mast cells were stained with APC-CY7-conjugated anti-c-Kit (2B8) and PE-CY7-conjugated anti-FcεRIα (MAR-1) antibodies; peritoneal mast cells were identified as CD3ε−B220− FcεR1α+c-Kit+; T cells and B cells were stained with PE-CY5-conjugated anti-CD3ε (145–2C11) and PE-CY7-conjugated anti-CD19 (1D3) antibodies, respectively; dendritic cells (DCs) were stained with APC-conjugated anti-MHC Class II (MHC II) (M5/114.15.2) and PE-conjugated anti-CD11c (N418) antibodies; neutrophils and macrophages were stained with PE-conjugated anti-Gr-1 (RB6–8C5) and APC-conjugated anti-CD11b (M1/70) antibodies; NK cells were stained with APC-conjugated anti mouse pan-NK cells (CD49b) (DX5) and PE-conjugated anti-NK1.1 (PK136) antibodies. Dead cells were identified by staining with propidium iodide (PI) and excluded from all FACS plots. Stained cells were acquired by using CyAN (DakoCytomation, Glostrup, Denmark) and analyzed using FlowJo software (Tree Star, Ashland, OR). The total number of positive cells was calculated by multiplying the total number of cells harvested from the bone marrow or peritoneal cavities by the percentage of positive cells. The YFP+ or YFP+GFP+ BMMCs, and basophils (FcεR1α+c-Kit− CD49b+CD11b+) were FACS-sorted using a MoFlo cytometer (DakoCytomation, Glostrup, Denmark). All Abs used for FACS analysis and sorting were purchased from BD Pharmingen (San Diego, CA) or eBioscience (San Diego, CA).
Cell culture
Bone marrow-derived mast cells (BMMCs) were prepared by culturing bone marrow cells from mice in the presence of IL-3 for 4weeks as describedE4. Greater than 99% of BMMCs were mast cells (FcεRIα+ c-Kit+) as determined by FACS analysis. Peritoneal Cavity Mast Cells (PCMCs) were cultured from cells collected from the peritoneal cavity of mice in Iscove’s DMEM (10016CV, Corning™ cellgro™, Manassas, VA) plus 10% FBS,100 units/ml penicillin, 100 μg/ml streptomycin, and 2 mM beta-mercaptoethanol in the presence of 20 ng/mL IL-3 and 20 ng/mL recombinant murine SCF (250–03, Peprotech, Rocky Hill, NJ). After 4 weeks of culture, over 99% of cells were mast cells (FcεRIα+ c-Kit+). Basophils were prepared as describedE4. Briefly, IL-3 (10 μg) and anti-IL-3 antibody (5 μg; MP2-8F8; BD PharMingen) complex (IL-3C) was i.p. injected into mice 3 days before bone marrow harvest. HEK293 cells were purchased from American Type Culture Collection (ATCC, Manassas, VA) and cultured in DMEM plus 10% FBS, 100 units/ml penicillin, and 100 μg/ml streptomycin at 5% CO2 and 37 °C. CFTL-15, a murine IL-3-dependent mast cell lineE9, was provided by Dr. Melissa Brown (Northwestern University, Chicago, IL). CFTL-15 cells were cultured in complete RPMI 1640 containing 10% FBS in the presence of 20 ng/ml IL-3E10.
The human mast cell line LAD2 was provided by Dr. Dean Metcalfe (National Institutes of Health, Bethesda, MD)E11 and cultured in StemPro™-34 SFM (10639011, Thermo Fisher Scientific, Waltham, MA) plus 2.6% StemPro-34 Nutrient Supplement (GIBCO), 2 mM L-Glutamine (25005CI, Corning™ cellgro™), 100 units/ml penicillin, and 100 μg/ml streptomycin in the presence of 100 ng/ml recombinant human SCF (300-07, Peprotech)E12.
Histology
Tissues from Gata2f/fMcpt5-Cre mice or littermate control Gata2+/+Mcpt5-Cre mice, Ahrf/f Cpa3-Cre mice or littermate control Ahr+/+Cpa3-Cre mice, Ahrr−/− mice or littermate control Ahrr+/+ mice, Bhlhe40−/− mice or littermate control Bhlhe40+/+ mice, were fixed in 4% paraformaldehyde, cut into 5 μm sections and stained with toluidine blue as described previouslyE4. Histological images were captured on a Nikon E800 microscope (Nikon, Melville, NY).
Passive cutaneous anaphylaxis (PCA)
Gata2f/fMcpt5-Cre mice or littermate control Gata2+/+Mcpt5-Cre mice, Ahrf/f Cpa3-Cre mice or littermate control Ahr+/+Cpa3-Cre mice, Ahrr−/− mice or littermate control Ahrr+/+ mice, Bhlhe40−/− mice or littermate control Bhlhe40+/+ mice, were sensitized by IgE anti-2, 4, 6-Trinitrophenyl (TNP) antibody (100 ng/10 μl) (IGEL 2a, ATCC, Manassas, VA)E13 or PBS (10 μl) via intradermal injection. Twenty-four hours later, the sensitized mice were challenged with TNP-BSA (300 μg/300 μl PBS) (T-5050–100, LGC Biosearch Technologies, Novato, CA) with 0.5% of Evans blue dye via intravenous injection. Thirty minutes after challenge, ears were collected and incubated in dimethylformamide for 48 hours, which was then measured for absorbance at 620 nm (OD620 nm)E14.
Passive systemic anaphylaxis (PSA)
Mice were intraperitoneally sensitized with 10 μg of IgE anti-TNP antibody (IGEL 2a, ATCC)E13 in 100 μl PBS. Twenty-four hours later, the sensitized mice were intraperitoneally challenged with 10 μg of TNP-BSA in 100 μl PBS. Rectal temperature of the challenged mice was measured before challenge (0 min) and at 5, 10, 15, 20, 25, 30, 40, 60, 80, 100 and 120 minutes after challenge as describedE15.
Histamine measurement
Plasma was collected 5 minutes after antigen challenge for histamine release measurement._For histamine content measurement, BMMCs, PCMCs, and human mast cell line LAD2 cells were frozen and thawed three times. Histamine in the plasma or cell lysates was measured by using an enzyme immunoassay kit (Beckman Coulter, Fullerton, CA) according to the manufacturer’s instruction.
Measurement of Mouse Mast Cell Protease 1 (MMCP-1)
Serum was collected 4 hours after antigen challenge. Mouse Mast Cell Protease 1 (MMCP-1) concentrations in the serum were measured with an ELISA kit (Penicuik, Scotland) according to the manufacturer’s instruction.
Lentiviral short hairpin (sh) RNA
shRNA targeting genes of interest (shMitf, TRCN0000362536, shAhr TRCN0000226005, shAhrr TRCN0000445538, and shBhlhe40 TRCN0000226078) were designed and tested by The RNAi Consortium (TRC) at the Broad Institute and distributed as Mission® shRNA library by Sigma-Aldrich (Sigma-Aldrich, St. Louis, MO). ShRNA targeting random sequences was used as a control (shRNA CTRL, SHC216-pLKO.5-puro Nontarget shRNA control). Lentiviral transduction particles were prepared by transfecting HEK293 cells with shRNA plasmid (2 μg) and packaging plasmids (1.5 μg ofpΔ8.9 and 0.5 μg ofpCMV-VSV-G, Sigma-Aldrich). Lentiviral supernatant was collected and filtered 48 hours after transfection. Lentivirus was added to BMMCs (1 × 10⁶ cells/ml) or CFTL-15 cells (1 × 10⁶ cells/ml) in a 12-well plate in the presence of polybrene (8 μg/ml; Millipore, Billerica, MA) and centrifuged at 1,350 g for 90 minutes at room temperature. Transduced cells were then cultured in complete IDMEM (BMMC) or RPMI160 (CFTL-15) in the presence of 20 ng/ml of IL-3 and 2 μg/ml (BMMC) or 4 μg/ml (CFTL-15) puromycin (Sigma-Aldrich) for three days. Ten days after puromycin selection, cells were used for experiments.
Adoptive transfer of BMMCs
Gata2−/− and control Gata2+/+ BMMCs were prepared as describedE4. Briefly, Gata2−/− BMMCs were cultured from bone marrow of Gata2f/fRosaYfp/YfpTgCreErt2hemi and Gata2+/+BMMCs were cultured from control Gata2+/+RosaYfp/YfpTgCreErt2hemi mice for 4 weeks. The cultured BMMCs were treated with 25 nM 4-hydroxytamoxifen (4HT) for 11 days. YFP+ BMMCs were FACS-sorted and used as donor BMMCs. Deletion of the floxed Gata2 gene in the sorted YFP+Gata2f/fRosaYfp/YfpTgCreErt2hemi BMMCs was determined to be near 100%. Donor BMMCs with knocked down Mitf mRNA, Ahr mRNA, Ahrr mRNA, Bhlhe40 mRNA, or with a shRNA control were prepared by using the shRNA approach. BMMCs from bone marrow of Gata2+/+Mcpt5-Cre mice were transduced with shMitf lentivirus, shAhr lentivirus, shAhrr lentivirus, shBhlhe40 lentivirus, or shRNA control virus. Donor cells (1 × 10⁶ in 200 μl PBS) were intraperitoneally injected into Gata2f/fMcpt5-Cre mice. Three days later, the reconstituted mice were analyzed for PSA.
Quantitative PCR (qPCR)
Total RNA from FACS-sorted basophils, cultured BMMCs, PCMCs, or human mast cell line LAD2 cells was isolated using TRIzol® (Ambion Inc, Austin, TX). cDNA was synthesized by reverse transcription. Quantitative PCR (qPCR) was performed in an ABI PRISM 7700 Sequence Detection System. Primer sequences are listed in Table E1. Relative mRNA amounts were calculated as follows: Relative mRNA amount = 2[Ct(Sample)−Ct(Hprt)].
Chromatin immunoprecipitation assay
ChIP analysis of MITF recruitment to the Hdc enhancers was performed as describedE4. Anti-MITF antibody (C5) was purchased from Thermo Scientific (Fremont, CA). IgG control was purchased from Santa Cruz Biotech. Fold enrichment was calculated using the following equation: Fold Enrichment= 2[ΔCt(IgG)−ΔCt(IP)], where ΔCt(IgG)=Ct(IgG)−[Ct(input)−Log2(Input Dilution Factor)], ΔCt(IP)= Ct(IP)−[Ct(input)-Log2(Input Dilution Factor)]E16.
Plasmid construction
The Hdc minimal promoter (−44 to −1 relative to the transcription start site (TSS) of the Hdc gene) was amplified and cloned into a pGL3-basic luciferase vector (Madison, WI) via the Bg1II and HindIII restriction sites. The −8.8 enhancer (−8860 to −10092 relative to the TSS of the Hdc gene) and the +0.3 enhancer (+273 to +1762) were generated by PCR amplification and cloned into the Hdc minimal promoter luciferase vector via the KpnI and MluI restriction sites. The MITF binding site mutations were generated by overlapping PCR. The primers used for plasmid constructions are listed in Table E1. All constructed plasmids were verified by sequencing.
Luciferase reporter assay
CFTL-15 cells (5 × 10⁶) were electroporated with 10 μg of luciferase plasmid and 0.5 μg of Renilla vector at 450 V and 500 microfarads using a Bio-Rad Gene Pulser. HEK293 cells were transfected with 1 μg of luciferase plasmid and 0.1 μg of Renilla vector plus MITF expression plasmid or control plasmid using calcium phosphate. Twenty hours after electroporation or transfection, cells were collected, and luciferase activities were measured by using an InfiniteMlOOO® microplate reader (Tecan Systems, Inc., San Jose, CA) and the Dual-Luciferase reporter assay system (E1960, Promega). The transcription activity was normalized as the ratio of luciferase activity divided by Renilla activity.
Retroviral infection
Full-lengths Gata2 and Mitf cDNAs were amplified from mouse BMMC mRNA and cloned into the retroviral expression vector MSCV2.2-Ires-Gfp through BglII and NotI restriction sites. The retroviral particles preparation and infection were conducted as described previously E4. In brief, bone marrow cells from the control (Gata2+/+RosaYfp/YfpTgCreErt2hemi, Gata2+/+) mice and inducible Gata2 knockout (Gata2f/fRosaYfp/YfpTgCreErt2hemi, Gata2f/f) mice were spin infected with 1 mL of recombinant retrovirus containing the Gata2, Mitf, or Gfp (CTRL) gene. Infected cells were cultured in complete IDMEM in the presence of 20 ng/ml of IL-3 for two days before they were treated with 25 nM 4HT for 11 days to delete the Gata2 gene as describedE4. The treated cells were analyzed by FACS analysis or subjected to FACS sorting. YFP+GFP+ cells were used for qPCR analysis.
ChIP-seq
DNA fragments associated with H3K4me1 or H3K27ac histone marks were immunoprecipitated with anti-H3K4me1 antibody (ab8895, Abcam, Cambridge, MA) or anti-H3K27ac antibody (ab4729, Abcam), respectively. The immunoprecipitated DNA fragments were repaired, ligated to adapters, and size selected with the Ion Plus Fragment Library Kit (#4471252, Thermo Fisher Scientific) according to the Ion ChIP-Seq Library Preparation protocol. Libraries were analyzed for size and quantity using the High Sensitivity Bioanalyzer Kit (#5067–4626, Agilent Technologies, Santa Clara, CA). The ChIP library was sequenced on an Ion Torrent Proton Semiconductor Sequencer. Reads were aligned to the mouse mm9 reference genome using Torrent Suite v4.4.6 for the H3K4me1 samples and v5.0.4 for the H3K27ac samples using default parameters. Peaks were identified by comparison with matched input DNA using MACS version 2.0.10.20130306 (tag: beta) for H3K4me1 and v2.1.1.20160309 for H3K27ac with a q-value threshold of 0.001 (macs2 callpeak -t .. -c .. -f BAM -g mm -n … -q 0.001 -B -- SPMR)E14. A bedGraph coverage file to display the fold enrichment (FE) of each immunoprecipated sample with respect to its matched input DNA was created using MACS (macs2 bdgcmp -c …_control_lambda.bdg -t …_treat_pileup.bdg - o …_FE.bedgraph -m FE). ChIP-seq data were displayed using Integrative Genomics Viewer (IGV)E17, 18. The ChIP-seq data have been deposited in the Gene Expression Omnibus (GEO) database (http://www.ncbi.nlm.nih.gov/geo, GSE97253). These data will be released to the public upon acceptance of this manuscript.
Cholera toxin treatment of BMMCs
BMMCs were not treated or treated with 0.08 μg/mL cholera toxin (#100B, List Biological Laboratories Inc., Campbell, California) for 48 hours according to the published reportE19. Then, the cells were used for qPCR analysis of Hdc mRNA expression and ELISA analysis of histamine content.
Extended Data
FIG E1.
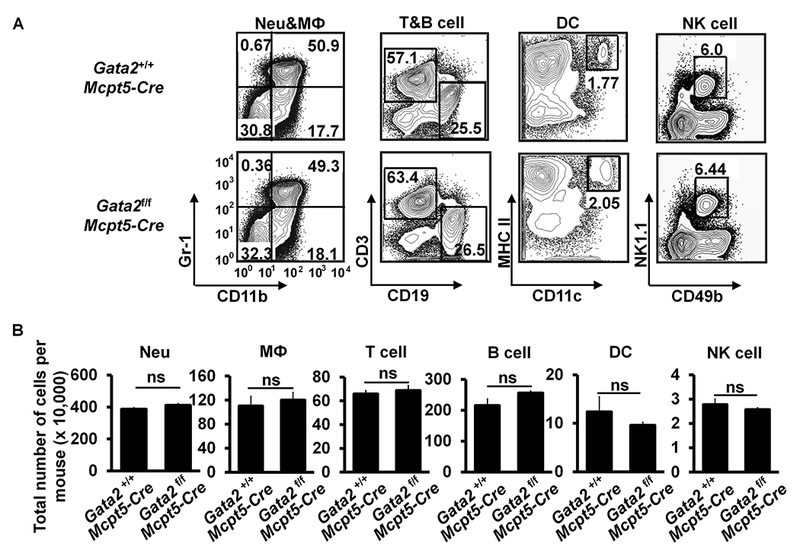
Neutrophils (Neu), Macrophages (MФ), T cells, B cells, Dendritic cells (DCs), and NK cells are not affected in Gata2f/f Mcpt5-Cre mice. A. Flow analysis of the indicated cell lineages in the bone marrow (Neutrophils and macrophages) and spleen (T cells, B cells, Dendritic cells and NK cells). B. Total number of cells (mean ± SEM, n=3 mice). FIG E1 related to FIG 1.
FIG E2.
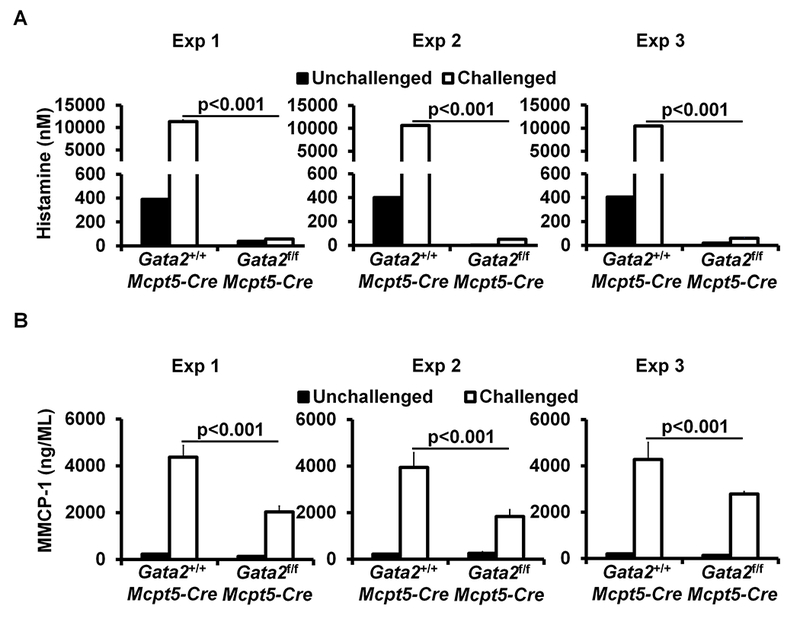
Plasma histamine and serum MMCP-1 levels are decreased in Gata2f/f Mcpt5-Cre mice. A. ELISA analysis of plasma histamine level (mean ± SEM, triplicates). The left, middle, and right panels show three independent experiments. B. ELISA analysis of serum MMCP-1 level (mean ± SEM, triplicates). The left, middle, and right panels show three independent experiments. FIG E2A related to FIG 1E; FIG E2B related to FIG 1F.
FIG E3.
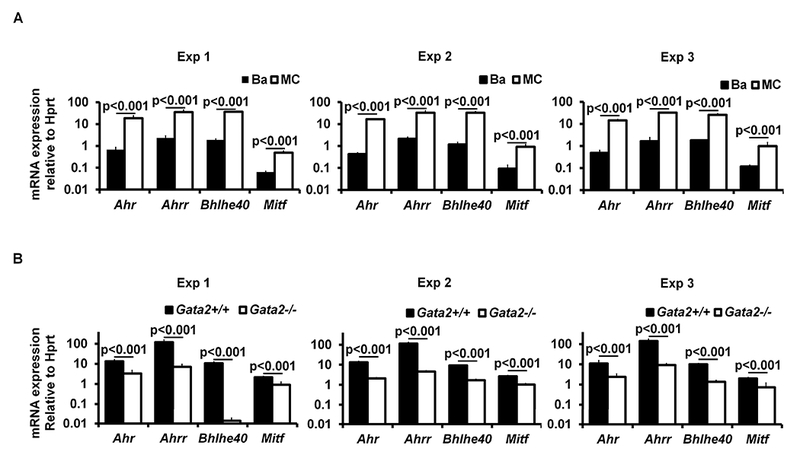
Transcription factors AHR, AHRR, BHLHE40 and MITF depend on GATA2 for their expression in mast cells. qPCR analysis of the mRNA expression in BMMCs (MC) versus basophils (Ba) (A), and Gata2+/+ BMMCs versus Gata2−/− BMMCs (B) (mean ± SEM, triplicates). The left, middle, and right panels each show three independent experiments. FIG E3A related to FIG 2B; FIG E3B related to FIG 2C.
FIG E4.
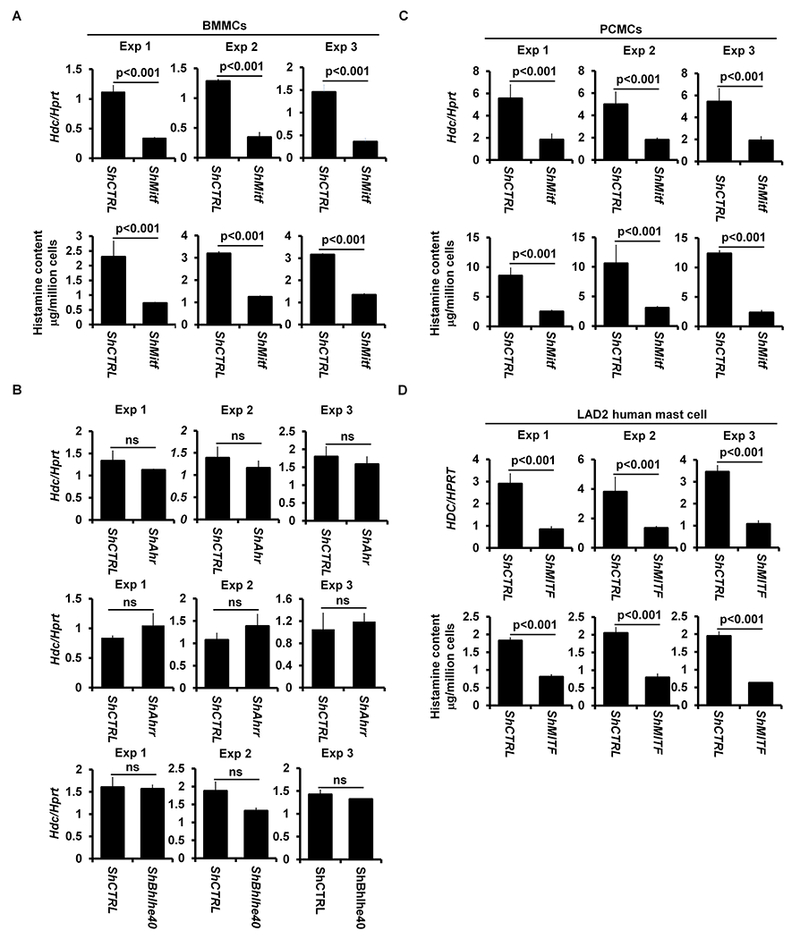
The transfection factor MITF, but not AHR, AHRR or BHLHE40 regulates the Hdc gene expression. qPCR analysis of the Hdc mRNA expression and ELISA analysis of histamine content in BMMCs (A), PCMCs (C), and human mast cell line LAD2 (D) with knocked down Mitf mRNA (ShMitf) or with shRNA control (ShCTRL) (mean ± SEM, triplicates); B. qPCR analysis of the Hdc mRNA expression in BMMCs with knocked down Ahr mRNA (ShAhr), Ahrr mRNA (ShAhrr), and Bhlhe40 mRNA (ShBhlhe40) or with shRNA control (ShCTRL) (mean ± SEM, triplicates). The left, middle, and right panels each show three independent experiments. FIG E4A related to FIG 3A; FIG E4B related to FIG 3B; FIG E4C related to FIG 3D; FIG E4D related to FIG 3E.
FIG E5.
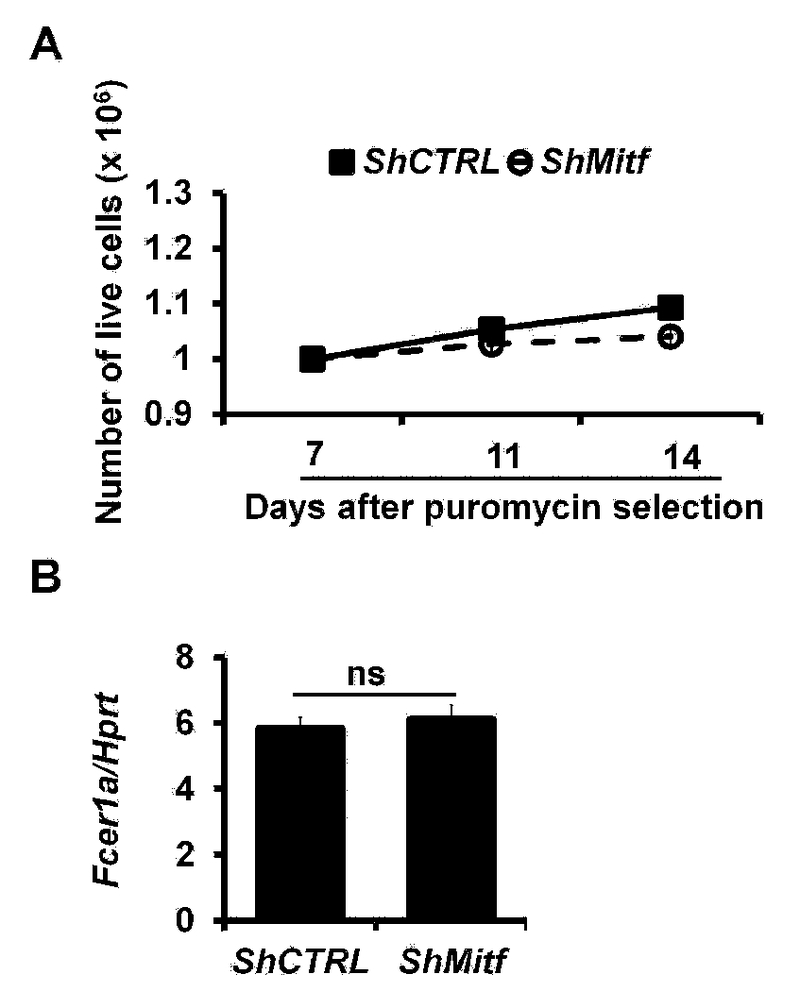
Knockdown of Mitf mRNA expression does not lead to mast cell death or down regulation of FceR1a expression. A. Number of live ShCTRL or ShMitf PCMCs at different days after puromycin selection (mean ± SEM, n=3 samples). B. qPCR analysis of the Fcer1a mRNA expression in ShCTRL or ShMitf PCMCs (mean ± SEM, n=3 samples). FIG E5 related to FIG 3.
FIG E6.
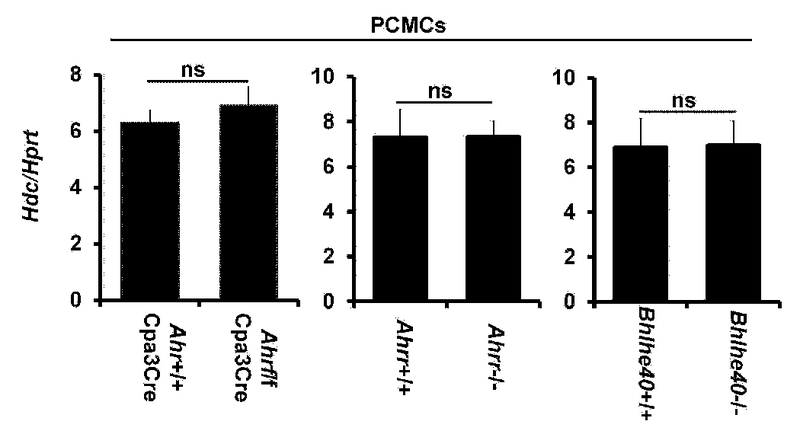
The transfection factors AHR, AHRR and BHLHE40 are not required for the Hdc gene expression in PCMCs. qPCR analysis of the Hdc mRNA expression in PCMCs of the indicated mice (mean ± SEM, triplicates). FIG E6 related to FIG 3.
FIG E7.
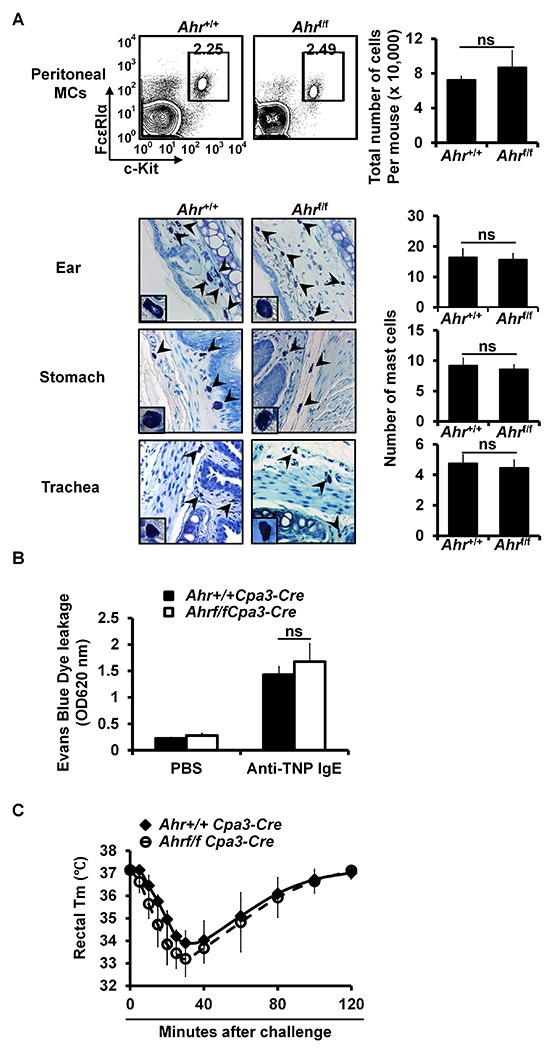
Ahrf/fCpa3-Cre mice have normal numbers of mast cells and develop passive cutaneous anaphylaxis and passive systemic anaphylaxis normally. A. Flow analysis of peritoneal cavity mast cells and total number of peritoneal cavity mast cells (mean ± SEM, n=3 mice) (left panel). Toluidine blue staining of mast cells (magnification ×40; insert, ×100). Mast cells are indicated by arrows. Average number of mast cells in ten randomly selected fields (×40) (mean ± SEM, n=3 mice) (right panels). B. PCA analysis, mean ± SEM, n=3 mice. C. PSA analysis, mean ± SEM, n=3 mice. FIG E7 related to FIG 3.
FIG E8.
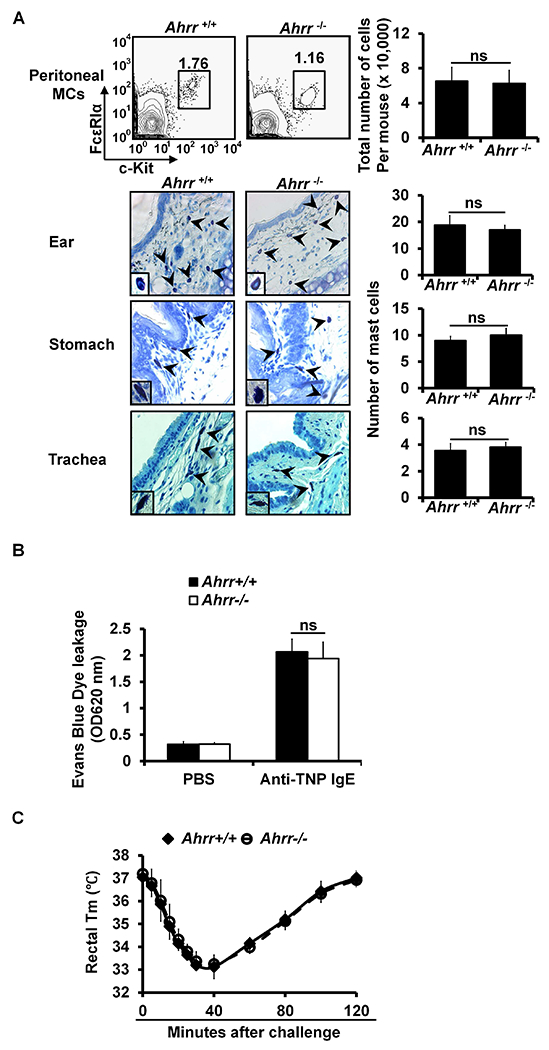
Ahrr−/− mice have normal numbers of mast cells and develop passive cutaneous anaphylaxis and passive systemic anaphylaxis normally. A. Flow analysis of peritoneal cavity mast cells and total number of peritoneal cavity mast cells (mean ± SEM, n=3 mice) (left panel). Toluidine blue staining of mast cells (magnification ×40; insert, ×100). Mast cells are indicated by arrows. Average number of mast cells in ten randomly selected fields (×40) (mean ± SEM, n = 3 mice) (right panels). B. PCA analysis, mean ± SEM, n = 3 mice. C. PSA analysis, mean ± SEM, n=3 mice. FIG E8 related to FIG 3.
FIG E9.

Bhlhe40−/− mice have normal numbers of mast cells and develop passive cutaneous anaphylaxis and passive systemic anaphylaxis normally. A. Flow analysis of peritoneal cavity mast cells and total number of peritoneal cavity mast cells (mean ± SEM, n=3 mice) (left panel). Toluidine blue staining of mast cells (281 magnification ×40; insert, ×100). Mast cells are indicated by arrows. Average number of mast cells in ten randomly selected fields (×40) (mean ± SEM, n=3 mice) (right panels). B. PCA analysis, mean ± SEM, n=3 mice. C. PSA analysis, mean ± SEM, n=3 mice. FIG E9 related to FIG 3.
FIG E10.

Identification of putative Hdc enhancers. Luciferase reporter analysis of the Hdc enhancer activities in the CFTL-15 mast cell line. Error bars represent mean ± SEM, triplicates. The left, middle, and right panels each show three independent experiments. HdcMP: Hdc minimal promoter. FIG E10 related to FIG 4B.
FIG E11.
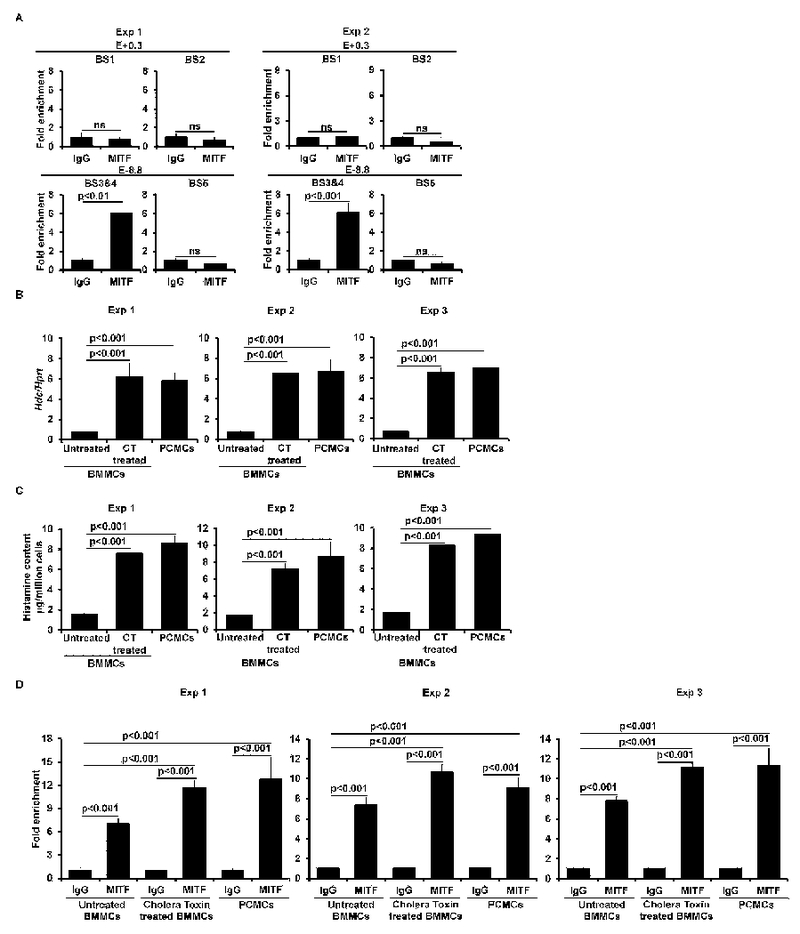
MITF binds to the -8.8 enhancer. A. ChIP-qPCR analysis of MITF binding (mean ± SEM, triplicates). B, qPCR analysis of the Hdc gene expression in untreated or cholera toxin (CT) treated BMMCs, and PCMCs (mean ± SEM, triplicates). C. ELISA analysis of histamine content in untreated or cholera toxin (CT) treated BMMCs and PCMCs (mean ± SEM, triplicates). D. ChIP-qPCR analysis of MITF binding in untreated or cholera toxin (CT) treated BMMCs and PCMCs (mean ± SEM, triplicates). The left and right panels (A) or the left, middle, and right panel (B, C, and D) each show two or three independent experiments, respectively. FIG E11A related to FIG 5B; FIG E11B related to FIG 5C; FIG E11C related to FIG 5D; FIG E11D related to FIG 5E.
FIG E12.
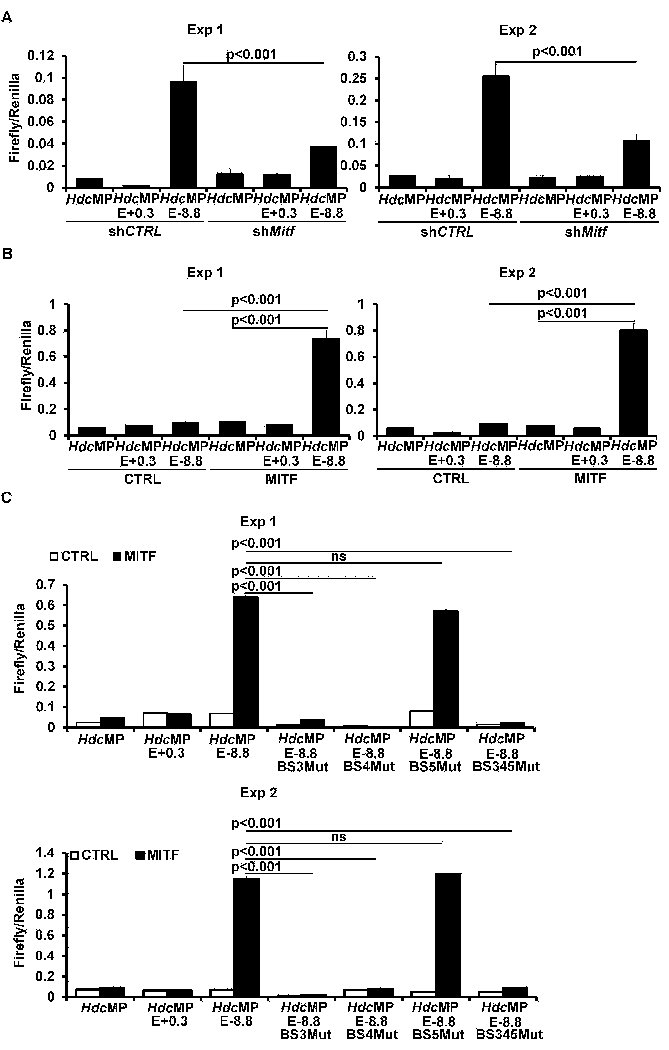
MITF drives the −8.8 enhancer activity. A, Luciferase reporter gene analysis of Hdc enhancer activities in CFTL-15 cells with knocked down Mitf mRNA or shRNA control (mean ± SEM, triplicates). B. Luciferase reporter gene analysis of the Hdc enhancer activities in HEK293 cells co-transfected with vector control or the MITF expression construct (mean ± SEM, triplicates). C. Luciferase reporter gene analysis of the activity of Hdc enhancers that have a mutated MITF binding site(s) (mean ± SEM, triplicates). The left and right panels (A, B, and C) or the upper and lower panel (D) each show two independent experiments. FIG E12A related to FIG 6A; FIG E12B related to FIG 6B; FIG E12C related to FIG 6C.
FIG E13.

MITF partially restores Hdc gene expression in Gata2 deficient mast cells. qPCR analysis of the Hdc mRNA expression in Gata2−/− BMMCs overexpressing MITF, GATA2 or a control vector (CTRL) (mean ± SEM, triplicates). The left, middle, and right panels each show three independent experiments. FIG E13 related to FIG 7B.
Table E1.
Primer sequences:
| Primers for qPCR and
ChIP-qPCR | ||
|---|---|---|
| Gene | 5′ primer | 3′ primer |
| Mitf | AACCGACAGAAGAAGCTGGA | TGATGATCCGATTCACCAGA |
| Ahr | AGCAGCTGTGTCAGATGGTG | CTGAGCAGTCCCCTGTAAGC |
| Ahrr | AGAGGAGGACCAGAAGCACA | TCTGTGCTCCAGTTCAGGTG |
| Bhlhe40 | CATGAGAACACTCGGGACCT | TCTCTTTCAAGTCCACGGCT |
| Hdc | TTCCAGCCTCCTCTGTCTGT | GGTATCCAGGCTGCACATTT |
| Hprt | CTCATGGACTGATTATGGACAGGAC | GCAGGTCAGCAAACTTATAGCC |
| Human HDC | TTCTGCCTGTGGATGACAAC | TAAGCAGCATCGATGTGGAG |
| Human HPRT | CTCATGGACTAATTATGGACAGGAC | GCAGGTCAGCAAAGAATTTATAGCC |
| HdcE+0.3BS1 ChIP | GGGGCCACAGTGTATGAAAC | AGGAAAATGTGTCCCACTGC |
| HdcE+0.3BS2 ChIP | GAAGGGTTTCTGGTTGCTCA | CTTGTCACACGGCTTCCAC |
| HdcE-8.8BS3&4 ChIP | GCAAAGCCTCAAGGTGGTAA | GAAGCTGCCCGAATACTTGT |
| HdcE-8.8BS5 ChIP | CTGCAAGCTACATTTTCAGCA | TGTGAGAACAAACTGCACTGG |
| Primers for
constructions | ||
| Constructs | 5′ primer | 3′ primer |
| pGL3-HdcMP | AATAAGATCTGGCTAAAGGAGGGGAATAGG | AATAAAGCTTGCATCTCTTATTTAAGGAGTTCCC |
| pGL3-HdcMPE+0.3 | AATAGCTAGCGTAGATCAGAGTTTTAACAGGTCCCT | AATAAGA TCTCTTCTTCTTCTTCTTCTTTTTTTTTTTT |
| pGL3-HdcMPE-8.8 | AATAGGTACCAACCAATTAGACTCCTCATGCCTT | AATAACGCGTAAGGAACTGATAAACGAGGGGTG |
| BS3 Mut | GTTCTGCTGGAGACAATTAAATACAG | ATTACATCCTGTATTTAATTGTCTCCAG |
| BS4 Mut | CAGCTGCAGGCGAATTAATGT | GTGAAAGCAACATTAATTCGCCT |
| BS5 Mut | AAGCCGTTGGAGAATTAATTGCT | ACACAAACCCAAGCAATTAATTCTC |
Key messages:
GATA2 is required for connective tissue mast cell differentiation
GATA2 and MITF regulate IgE-mediated anaphylaxis in vivo
MITF regulates Hdc gene expression by directly activating an Hdc enhancer
Acknowledgements
We thank lab members for thoughtful discussions. We are grateful to Dr. Jing Wang of the University of Colorado School of Medicine for assistance with lentivirus infection; to Dr. Melissa Brown of Northwestern University for providing us with the CFTL-15 mast cell line; to Dr. Dean Metcalfe of National Institute of Allergy and Infectious Diseases for providing us with the human mast cell line LAD2; to Dr. Mark Mattson of the NIH; to Dr. Xiaoping Zhong of Duke University for SCF-producing cell line; and Dr. Robert H Lipsky of the Virginia Commonwealth University for Bhlhe40−/− mice; to our Mouse Genetic Core facility for generating Ahrr−/− mice. We are indebted to Josh Loomis and Shirley Sobus of the Cytometry Core, Animal Care Facility, Gene and Environment Center of National Jewish Health for cell sorting and FACS analysis and other technical assistance.
Supported by grants from the National Institutes of Health R01AI107022 and RO1AI083986 (H.H.), R01 AI098417 (J.H.), R01AI113162 (F. F), a fund provided by China Scholarship Council (No. 201606385033, Z. L.; No.201406270087, B.L.), and a fund provided by Sun Yet-Sen University (J.L.).
Abbreviations used:
- 4HT
4 hydroxytamoxifen
- AHR
Aryl hydrocarbon receptor
- AHRR
Aryl-hydrocarbon receptor repressor
- BHLHE40
Basic helix-loop-helix family member E40
- BMMCs
Bone marrow-derived mast cells
- ChIP-seq
Chromatin immunoprecipitation sequencing
- CTMC
connective tissue mast cell
- FACS
Fluorescence activated cell sorting
- GATA2
GATA binding protein 2
- H3K4me1
Monomethylation of lysine residue 4 on histone 3
- H3K27Ac
Acetylation of lysine residue 27 on histone 3
- HDC
Histidine decarboxylase
- MMCP1
Mouse mast cell protease 1
- MITF
Microphthalmia-associated transcription factor
- PCA
Passive cutaneous anaphylaxis
- PCMCs
Peritoneal Cavity Mast Cells
- pre-BMPs
Pre-basophil and mast cell progenitors
- PSA
Passive systemic anaphylaxis
- TNP
2, 4, 6-Trinitrophenyl
- TSS
Transcription start site
- YFP
Yellow fluorescent protein.
Footnotes
Publisher's Disclaimer: This is a PDF file of an unedited manuscript that has been accepted for publication. As a service to our customers we are providing this early version of the manuscript. The manuscript will undergo copyediting, typesetting, and review of the resulting proof before it is published in its final citable form. Please note that during the production process errors may be discovered which could affect the content, and all legal disclaimers that apply to the journal pertain.
Disclosure of potential conflict of interest: The authors declare no conflicts of interest.
REFERENCES:
- 1.Simons FE. Anaphylaxis. J Allergy Clin Immunol 2010; 125:S161–81. [DOI] [PubMed] [Google Scholar]
- 2.Sicherer SH, Sampson HA. Food allergy. J Allergy Clin Immunol 2010; 125:S116–25. [DOI] [PubMed] [Google Scholar]
- 3.Hogan SP, Wang YH, Strait R, Finkelman FD. Food-induced anaphylaxis: mast cells as modulators of anaphylactic severity. Semin Immunopathol 2012; 34:643–53. [DOI] [PMC free article] [PubMed] [Google Scholar]
- 4.Vickery BP, Chin S, Burks AW. Pathophysiology of food allergy. Pediatr Clin North Am 2011; 58:363–76, ix-x. [DOI] [PMC free article] [PubMed] [Google Scholar]
- 5.Kemp SF, Lockey RF. Anaphylaxis: a review of causes and mechanisms. J Allergy Clin Immunol 2002; 110:341–8. [DOI] [PubMed] [Google Scholar]
- 6.Finkelman FD. Anaphylaxis: lessons from mouse models. J Allergy Clin Immunol 2007; 120:506–15; quiz 16–7. [DOI] [PubMed] [Google Scholar]
- 7.Strait RT, Morris SC, Yang M, Qu XW, Finkelman FD. Pathways of anaphylaxis in the mouse. J Allergy Clin Immunol 2002; 109:658–68. [DOI] [PubMed] [Google Scholar]
- 8.Leung DY, Sampson HA, Yunginger JW, Burks AW Jr., Schneider LC, Wortel CH, et al. Effect of anti-IgE therapy in patients with peanut allergy. N Engl J Med 2003; 348:986–93. [DOI] [PubMed] [Google Scholar]
- 9.Ichikawa A, Sugimoto Y, Tanaka S. Molecular biology of histidine decarboxylase and prostaglandin receptors. Proc Jpn Acad Ser B Phys Biol Sci 2010; 86:848–66. [DOI] [PMC free article] [PubMed] [Google Scholar]
- 10.Hocker M, Zhang Z, Koh TJ, Wang TC. The regulation of histidine decarboxylase gene expression. Yale J Biol Med 1996; 69:21–33. [PMC free article] [PubMed] [Google Scholar]
- 11.Komori H, Nitta Y, Ueno H, Higuchi Y. Structural study reveals that Ser-354 determines substrate specificity on human histidine decarboxylase. J Biol Chem 2012; 287:29175–83. [DOI] [PMC free article] [PubMed] [Google Scholar]
- 12.Yatsunami K, Tsuchikawa M, Kamada M, Hori K, Higuchi T. Comparative studies of human recombinant 74- and 54-kDa L-histidine decarboxylases. J Biol Chem 1995; 270:30813–7. [DOI] [PubMed] [Google Scholar]
- 13.Ohtsu H, Tanaka S, Terui T, Hori Y, Makabe-Kobayashi Y, Pejler G, et al. Mice lacking histidine decarboxylase exhibit abnormal mast cells. FEBS Lett 2001; 502:53–6. [DOI] [PubMed] [Google Scholar]
- 14.Hallgren J, Gurish MF. Granule maturation in mast cells: histamine in control. Eur J Immunol 2014; 44:33–6. [DOI] [PubMed] [Google Scholar]
- 15.Makabe-Kobayashi Y, Hori Y, Adachi T, Ishigaki-Suzuki S, Kikuchi Y, Kagaya Y, et al. The control effect of histamine on body temperature and respiratory function in IgE-dependent systemic anaphylaxis. J Allergy Clin Immunol 2002; 110:298–303. [DOI] [PubMed] [Google Scholar]
- 16.Nakazawa S, Sakanaka M, Furuta K, Natsuhara M, Takano H, Tsuchiya S, et al. Histamine synthesis is required for granule maturation in murine mast cells. Eur J Immunol 2014; 44:204–14. [DOI] [PubMed] [Google Scholar]
- 17.Suzuki-Ishigaki S, Numayama-Tsuruta K, Kuramasu A, Sakurai E, Makabe Y, Shimura S, et al. The mouse L-histidine decarboxylase gene: structure and transcriptional regulation by CpG methylation in the promoter region. Nucleic Acids Res 2000; 28:2627–33. [DOI] [PMC free article] [PubMed] [Google Scholar]
- 18.Hirasawa N, Torigoe M, Kano K, Ohuchi K. Involvement of Sp1 in lipopolysaccharide-induced expression of HDC mRNA in RAW 264 cells. Biochem Biophys Res Commun 2006; 349:833–7. [DOI] [PubMed] [Google Scholar]
- 19.Ai W, Liu Y, Wang TC. Yin yang 1 (YY1) represses histidine decarboxylase gene expression with SREBP-1a in part through an upstream Sp1 site. Am J Physiol Gastrointest Liver Physiol 2006; 290:G1096–104. [DOI] [PubMed] [Google Scholar]
- 20.Ai W, Liu Y, Langlois M, Wang TC. Kruppel-like factor 4 (KLF4) represses histidine decarboxylase gene expression through an upstream Sp1 site and downstream gastrin responsive elements. J Biol Chem 2004; 279:8684–93. [DOI] [PubMed] [Google Scholar]
- 21.Ling KW, Ottersbach K, van Hamburg JP, Oziemlak A, Tsai FY, Orkin SH, et al. GATA-2 plays two functionally distinct roles during the ontogeny of hematopoietic stem cells. J Exp Med 2004; 200:871–82. [DOI] [PMC free article] [PubMed] [Google Scholar]
- 22.Lim KC, Hosoya T, Brandt W, Ku CJ, Hosoya-Ohmura S, Camper SA, et al. Conditional Gata2 inactivation results in HSC loss and lymphatic mispatterning. J Clin Invest 2012; 122:3705–17. [DOI] [PMC free article] [PubMed] [Google Scholar]
- 23.Rodrigues NP, Boyd AS, Fugazza C, May GE, Guo Y, Tipping AJ, et al. GATA-2 regulates granulocyte-macrophage progenitor cell function. Blood 2008; 112:4862–73. [DOI] [PubMed] [Google Scholar]
- 24.Tsai FY, Orkin SH. Transcription factor GATA-2 is required for proliferation/survival of early hematopoietic cells and mast cell formation, but not for erythroid and myeloid terminal differentiation. Blood 1997; 89:3636–43. [PubMed] [Google Scholar]
- 25.Iwasaki H, Mizuno S, Arinobu Y, Ozawa H, Mori Y, Shigematsu H, et al. The order of expression of transcription factors directs hierarchical specification of hematopoietic lineages. Genes Dev 2006; 20:3010–21. [DOI] [PMC free article] [PubMed] [Google Scholar]
- 26.Li Y, Qi X, Liu B, Huang H. The STAT5-GATA2 pathway is critical in basophil and mast cell differentiation and maintenance. J Immunol 2015; 194:4328–38. [DOI] [PMC free article] [PubMed] [Google Scholar]
- 27.Kitamura Y, Morii E, Jippo T, Ito A. Regulation of mast cell phenotype by MITF. Int Arch Allergy Immunol 2002; 127:106–9. [DOI] [PubMed] [Google Scholar]
- 28.Kitamura Y, Oboki K, Ito A. Development of mast cells. Proc Jpn Acad Ser B Phys Biol Sci 2007; 83:164–74. [DOI] [PMC free article] [PubMed] [Google Scholar]
- 29.Morii E, Oboki K, Jippo T, Kitamura Y. Additive effect of mouse genetic background and mutation of MITF gene on decrease of skin mast cells. Blood 2003; 101:1344–50. [DOI] [PubMed] [Google Scholar]
- 30.Qi X, Hong J, Chaves L, Zhuang Y, Chen Y, Wang D, et al. Antagonistic regulation by the transcription factors C/EBPalpha and MITF specifies basophil and mast cell fates. Immunity 2013; 39:97–110. [DOI] [PMC free article] [PubMed] [Google Scholar]
- 31.Tong Q, Weaver MR, Kosmacek EA, O’Connor BP, Harmacek L, Venkataraman S, et al. MnTE-2-PyP reduces prostate cancer growth and metastasis by suppressing p300 activity and p300/HIF-1/CREB binding to the promoter region of the PAI-1 gene. Free Radic Biol Med 2016; 94:185–94. [DOI] [PMC free article] [PubMed] [Google Scholar]
- 32.Robinson JT, Thorvaldsdottir H, Winckler W, Guttman M, Lander ES, Getz G, et al. Integrative genomics viewer. Nat Biotechnol 2011; 29:24–6. [DOI] [PMC free article] [PubMed] [Google Scholar]
- 33.Thorvaldsdottir H, Robinson JT, Mesirov JP. Integrative Genomics Viewer (IGV): high-performance genomics data visualization and exploration. Brief Bioinform 2013; 14:178–92. [DOI] [PMC free article] [PubMed] [Google Scholar]
- 34.Dudeck A, Dudeck J, Scholten J, Petzold A, Surianarayanan S, Kohler A, et al. Mast cells are key promoters of contact allergy that mediate the adjuvant effects of haptens. Immunity 2011; 34:973–84. [DOI] [PubMed] [Google Scholar]
- 35.Wastling JM, Knight P, Ure J, Wright S, Thornton EM, Scudamore CL, et al. Histochemical and ultrastructural modification of mucosal mast cell granules in parasitized mice lacking the beta-chymase, mouse mast cell protease-1. Am J Pathol 1998; 153:491–504. [DOI] [PMC free article] [PubMed] [Google Scholar]
- 36.Dwyer DF, Barrett NA, Austen KF. Expression profiling of constitutive mast cells reveals a unique identity within the immune system. Nat Immunol 2016; 17:878–87. [DOI] [PMC free article] [PubMed] [Google Scholar]
- 37.Walisser JA, Glover E, Pande K, Liss AL, Bradfield CA. Aryl hydrocarbon receptor-dependent liver development and hepatotoxicity are mediated by different cell types. Proc Natl Acad Sci U S A 2005; 102:17858–63. [DOI] [PMC free article] [PubMed] [Google Scholar]
- 38.Jiang X, Tian F, Du Y, Copeland NG, Jenkins NA, Tessarollo L, et al. BHLHB2 controls Bdnf promoter 4 activity and neuronal excitability. J Neurosci 2008; 28:1118–30. [DOI] [PMC free article] [PubMed] [Google Scholar]
- 39.Stechschulte DJ, Sharma R, Dileepan KN, Simpson KM, Aggarwal N, Clancy J, Jr., et al. Effect of the mi allele on mast cells, basophils, natural killer cells, and osteoclasts in C57Bl/6J mice. J Cell Physiol 1987; 132:565–70. [DOI] [PubMed] [Google Scholar]
- 40.Morii E, Ito A, Jippo T, Koma Y, Oboki K, Wakayama T, et al. Number of mast cells in the peritoneal cavity of mice: influence of microphthalmia transcription factor through transcription of newly found mast cell adhesion molecule, spermatogenic immunoglobulin superfamily. Am J Pathol 2004; 165:491–9. [DOI] [PMC free article] [PubMed] [Google Scholar]
- 41. Levi-Schaffer F, Austen KF, Gravallese PM, Stevens RL Coculture of interleukin 3-dependent mouse mast cells with fibroblasts results in a phenotypic change of the mast cells. Proc Natl Acad Sci U S A 1986; 83:6485–8. [DOI] [PMC free article] [PubMed] [Google Scholar]
- 42.Levi-Schaffer F, Dayton ET, Austen KF, Hein A, Caulfield JP, Gravallese PM, et al. Mouse bone marrow-derived mast cells cocultured with fibroblasts. Morphology and stimulation-induced release of histamine, leukotriene B4, leukotriene C4, and prostaglandin D2. J Immunol 1987; 139:3431–41. [PubMed] [Google Scholar]
- 43.Dwyer DF, Barrett NA, Austen KF, Immunological Genome Project C. Expression profiling of constitutive mast cells reveals a unique identity within the immune system. Nat Immunol 2016; 17:878–87. [DOI] [PMC free article] [PubMed] [Google Scholar]
- 44.Kirshenbaum AS, Akin C, Wu Y, Rottem M, Goff JP, Beaven MA, et al. Characterization of novel stem cell factor responsive human mast cell lines LAD 1 and 2 established from a patient with mast cell sarcoma/leukemia; activation following aggregation of FcepsilonRI or FcgammaRI. Leuk Res 2003; 27:677–82. [DOI] [PubMed] [Google Scholar]
- 45.Rada-Iglesias A, Bajpai R, Swigut T, Brugmann SA, Flynn RA, Wysocka J. A unique chromatin signature uncovers early developmental enhancers in humans. Nature 2011; 470:279–83. [DOI] [PMC free article] [PubMed] [Google Scholar]
- 46.Calo E, Wysocka J. Modification of enhancer chromatin: what, how, and why? Mol Cell 2013; 49:825–37. [DOI] [PMC free article] [PubMed] [Google Scholar]
- 47.Heintzman ND, Stuart RK, Hon G, Fu Y, Ching CW, Hawkins RD, et al. Distinct and predictive chromatin signatures of transcriptional promoters and enhancers in the human genome. Nat Genet 2007; 39:311–8. [DOI] [PubMed] [Google Scholar]
- 48.Creyghton MP, Cheng AW, Welstead GG, Kooistra T, Carey BW, Steine EJ, et al. Histone H3K27ac separates active from poised enhancers and predicts developmental state. Proc Natl Acad Sci U S A 2010; 107:21931–6. [DOI] [PMC free article] [PubMed] [Google Scholar]
- 49.Spitz F, Furlong EE. Transcription factors: from enhancer binding to developmental control. Nat Rev Genet 2012; 13:613–26. [DOI] [PubMed] [Google Scholar]
- 50.Calero-Nieto FJ, Ng FS, Wilson NK, Hannah R, Moignard V, Leal-Cervantes AI, et al. Key regulators control distinct transcriptional programmes in blood progenitor and mast cells. EMBO J 2014; 33:1212–26. [DOI] [PMC free article] [PubMed] [Google Scholar]
- 51.Galli SJ, Dvorak AM, Marcum JA, Ishizaka T, Nabel G, Der Simonian H, et al. Mast cell clones: a model for the analysis of cellular maturation. J Cell Biol 1982; 95:435–44. [DOI] [PMC free article] [PubMed] [Google Scholar]
- 52.Nakano T, Sonoda T, Hayashi C, Yamatodani A, Kanayama Y, Yamamura T, et al. Fate of bone marrow-derived cultured mast cells after intracutaneous, intraperitoneal, and intravenous transfer into genetically mast cell-deficient W/Wv mice. Evidence that cultured mast cells can give rise to both connective tissue type and mucosal mast cells. J Exp Med 1985; 162:1025–43. [DOI] [PMC free article] [PubMed] [Google Scholar]
- 53.Malbec O, Roget K, Schiffer C, Iannascoli B, Dumas AR, Arock M, et al. Peritoneal cell-derived mast cells: an in vitro model of mature serosal-type mouse mast cells. J Immunol 2007; 178:6465–75. [DOI] [PubMed] [Google Scholar]
- 54.Katz HR, Levine JS, Austen KF. Interleukin 3-dependent mouse mast cells express the cholera toxin-binding acidic glycosphingolipid, ganglioside GM1, and increase their histamine content in response to toxin. J Immunol 1987; 139:1640–6. [PubMed] [Google Scholar]
- 55.Ohmori S, Moriguchi T, Noguchi Y, Ikeda M, Kobayashi K, Tomaru N, et al. GATA2 is critical for the maintenance of cellular identity in differentiated mast cells derived from mouse bone marrow. Blood 2015; 125:3306–15. [DOI] [PubMed] [Google Scholar]
- 56.Ottina E, Lyberg K, Sochalska M, Villunger A, Nilsson GP. Knockdown of the antiapoptotic Bcl-2 family member A1/Bfl-1 protects mice from anaphylaxis. J Immunol 2015; 194:1316–22. [DOI] [PMC free article] [PubMed] [Google Scholar]
- 57.Cildir G, Pant H, Lopez AF, Tergaonkar V. The transcriptional program, functional heterogeneity, and clinical targeting of mast cells. J Exp Med 2017; 214:2491–506. [DOI] [PMC free article] [PubMed] [Google Scholar]
- 58.Pierce JH, Di Fiore PP, Aaronson SA, Potter M, Pumphrey J, Scott A, et al. Neoplastic transformation of mast cells by Abelson-MuLV: abrogation of IL-3 dependence by a nonautocrine mechanism. Cell 1985; 41:685–93. [DOI] [PubMed] [Google Scholar]
- 59.Mangan S, Alon U. Structure and function of the feed-forward loop network motif. Proc Natl Acad Sci U S A 2003; 100:11980–5. [DOI] [PMC free article] [PubMed] [Google Scholar]
- 60.Ong CT, Corces VG. Enhancer function: new insights into the regulation of tissue-specific gene expression. Nat Rev Genet 2011; 12:283–93. [DOI] [PMC free article] [PubMed] [Google Scholar]
- 61.Bulger M, Groudine M. Functional and mechanistic diversity of distal transcription enhancers. Cell 2011; 144:327–39. [DOI] [PMC free article] [PubMed] [Google Scholar]
- 62.Thanos D, Maniatis T. Virus induction of human IFN beta gene expression requires the assembly of an enhanceosome. Cell 1995; 83:1091–100. [DOI] [PubMed] [Google Scholar]
- E1.Charles MA, Saunders TL, Wood WM, Owens K, Parlow AF, Camper SA, et al. Pituitary-specific Gata2 knockout: effects on gonadotrope and thyrotrope function. Mol Endocrinol 2006; 20:1366–77. [DOI] [PubMed] [Google Scholar]
- E2.Srinivas S, Watanabe T, Lin CS, William CM, Tanabe Y, Jessell TM, et al. Cre reporter strains produced by targeted insertion of EYFP and ECFP into the ROSA26 locus. BMC Dev Biol 2001; 1:4. [DOI] [PMC free article] [PubMed] [Google Scholar]
- E3.Hayashi S, McMahon AP. Efficient recombination in diverse tissues by a tamoxifen-inducible form of Cre: a tool for temporally regulated gene activation/inactivation in the mouse. Dev Biol 2002; 244:305–18. [DOI] [PubMed] [Google Scholar]
- E4.Li Y, Qi X, Liu B, Huang H. The STAT5-GATA2 pathway is critical in basophil and mast cell differentiation and maintenance. J Immunol 2015; 194:4328–38. [DOI] [PMC free article] [PubMed] [Google Scholar]
- E5.Dudeck A, Dudeck J, Scholten J, Petzold A, Surianarayanan S, Kohler A, et al. Mast cells are key promoters of contact allergy that mediate the adjuvant effects of haptens. Immunity 2011; 34:973–84. [DOI] [PubMed] [Google Scholar]
- E6.Walisser JA, Glover E, Pande K, Liss AL, Bradfield CA. Aryl hydrocarbon receptor-dependent liver development and hepatotoxicity are mediated by different cell types. Proc Natl Acad Sci U S A 2005; 102:17858–63. [DOI] [PMC free article] [PubMed] [Google Scholar]
- E7.Lilla JN, Chen CC, Mukai K, BenBarak MJ, Franco CB, Kalesnikoff J, et al. Reduced mast cell and basophil numbers and function in Cpa3-Cre; Mcl-1fl/fl mice. Blood 2011; 118:6930–8. [DOI] [PMC free article] [PubMed] [Google Scholar]
- E8.Jiang X, Tian F, Du Y, Copeland NG, Jenkins NA, Tessarollo L, et al. BHLHB2 controls Bdnf promoter 4 activity and neuronal excitability. J Neurosci 2008; 28:1118–30. [DOI] [PMC free article] [PubMed] [Google Scholar]
- E9.Pierce JH, Di Fiore PP, Aaronson SA, Potter M, Pumphrey J, Scott A, et al. Neoplastic transformation of mast cells by Abelson-MuLV: abrogation of IL-3 dependence by a nonautocrine mechanism. Cell 1985; 41:685–93. [DOI] [PubMed] [Google Scholar]
- E10.Hural JA, Kwan M, Henkel G, Hock MB, Brown MA. An intron transcriptional enhancer element regulates IL-4 gene locus accessibility in mast cells. J Immunol 2000; 165:3239–49. [DOI] [PubMed] [Google Scholar]
- E11.Kirshenbaum AS, Akin C, Wu Y, Rottem M, Goff JP, Beaven MA, et al. Characterization of novel stem cell factor responsive human mast cell lines LAD 1 and 2 established from a patient with mast cell sarcoma/leukemia; activation following aggregation of FcepsilonRI or FcgammaRI. Leuk Res 2003; 27:677–82. [DOI] [PubMed] [Google Scholar]
- E12.Radinger M, Jensen BM, Kuehn HS, Kirshenbaum A, Gilfillan AM. Generation, isolation, and maintenance of human mast cells and mast cell lines derived from peripheral blood or cord blood. Curr Protoc Immunol 2010; Chapter 7:Unit 7 37. [DOI] [PMC free article] [PubMed] [Google Scholar]
- E13.Rudolph AK, Burrows PD, Wabl MR. Thirteen hybridomas secreting hapten specific immunoglobulin E from mice with Iga or Igb heavy chain haplotype. Eur J Immunol 1981; 1:527–9. [DOI] [PubMed] [Google Scholar]
- E14.Teshima R, Akiyama H, Akasaka R, Goda Y, Toyoda M, Sawada J. Simple spectrophotometric analysis of passive and active ear cutaneous anaphylaxis in the mouse. Toxicol Lett 1998; 95:109–15. [DOI] [PubMed] [Google Scholar]
- E15.Metz M, Schafer B, Tsai M, Maurer M, Galli SJ. Evidence that the endothelin A receptor can enhance IgE-dependent anaphylaxis in mice. J Allergy Clin Immunol 2011; 128:424–6 e1. [DOI] [PMC free article] [PubMed] [Google Scholar]
- E16.Qi X, Hong J, Chaves L, Zhuang Y, Chen Y, Wang D, et al. Antagonistic regulation by the transcription factors C/EBPalpha and MITF specifies basophil and mast cell fates. Immunity 2013; 39:97–110. [DOI] [PMC free article] [PubMed] [Google Scholar]
- E17.Robinson JT, Thorvaldsdottir H, Winckler W, Guttman M, Lander ES, Getz G, et al. Integrative genomics viewer. Nat Biotechnol 2011; 29:24–6. [DOI] [PMC free article] [PubMed] [Google Scholar]
- E18.Thorvaldsdottir H, Robinson JT, Mesirov JP. Integrative Genomics Viewer (IGV): high-performance genomics data visualization and exploration. Brief Bioinform 2013; 14:178–92. [DOI] [PMC free article] [PubMed] [Google Scholar]
- E19.Katz HR, Levine JS, Austen KF. Interleukin 3-dependent mouse mast cells express the cholera toxin-binding acidic glycosphingolipid, ganglioside GM1, and increase their histamine content in response to toxin. J Immunol 1987; 139:1640–6. [PubMed] [Google Scholar]


