

Abstract
It is unknown if estimates of illicit drug use among young men who have sex with men and transgender women (YMSM/TW) may be biased due to historical distrust of research or reliable due to more accepting norms for use. Research is needed to examine the validity of drug use self-reports among YMSM/TW.
Data came from an ongoing longitudinal study of YMSM/TW aged 16–29 living in Chicago (analytic N=1029). Baseline urinalysis screens for marijuana, ecstasy, amphetamine, methamphetamine, cocaine, benzodiazepine, and opiate metabolites were compared to self-reported use within different recall periods using measures of concordance. Generalized estimating equations logistic regressions were conducted on three waves of data to identify predictors of disclosing past-6-month use of marijuana and non-marijuana drugs.
Past-6-month self-reported use of all non-marijuana substances was <15%. There was excellent agreement between self-reported and drug-tested marijuana use. For other substances, sensitivities within the urinalysis detection window were <0.5 but increased with longer recall periods. Black participants had lower odds of disclosing non-marijuana drug use. Gender minority participants had lower odds of disclosing marijuana use. Participants with a history of arrest had higher odds of disclosing both marijuana and non-marijuana drug use. Wave and year of first research participation were non-significant, suggesting no systematic bias or increasing honesty associated with longer research participation.
Programs that rely on self-identification of non-marijuana illicit substance use may be missing a substantial portion of drug-using YMSM/TW. Future epidemiological studies should work to reduce social desirability biases and include biomarker-based drug screenings to increase validity.
Keywords: men who have sex with men, illicit drugs, drug testing, validity, measurement error
1. Introduction
Accurate measurement of substance use is critical to epidemiological understanding and the subsequent prevention and service interventions that arise from that foundation [1]. However, most research continues to rely on self-reported substance use behaviors. Sources of bias in such data are extensive and encompass many issues of measurement error [2]. Certain cognitive (e.g., social desirability) and situational factors (e.g., perceptions of confidentiality within the interview setting) have been linked to underreporting behaviors deemed unfavorable [3, 4], including substance use [5]. Other factors such as memory difficulties have been shown to predict over-reporting [4].
Previous research has found variability in the validity of self-reported substance use by drug type, age, setting, education, socioeconomic status, region, and time [1, 6, 7]. Consistent across studies is lower reliability among racial/ethnic minorities [1, 2, 8–10]. Concerns about confidentiality, cultural distrust due to histories of mistreatment by researchers, and fear of legal consequences have been posited as possible explanations [8, 9]. Johnson and Fendrich [4] reported that, among a general population sample, measurement error among Black adults—but not White or Hispanic adults—was significantly associated with social desirability.
While evidence suggests most youth and young adults accurately report recent drug use [11], histories of experiencing stigma and judgement in psychological, medical, and research settings [12–15] might lead young men who have sex with men and transgender women (YMSM/TW) to minimize their reports of drug use in ways that are similar to minimizations by racial/ethnic minorities. Alternatively, prior literature has described norms more accepting of drug use [16–18], which may enhance willingness to disclose in research studies connected with the LGBT community [6, 7]. Given that the majority of research involving YMSM/TW has been in the context of HIV/AIDS, YMSM/TW may also be more comfortable reporting on substance use when they have already disclosed other sensitive information like sexual orientation or high-risk sexual behavior [6, 19].
Little research on this topic has been conducted with YMSM/TW, though two studies from the same sample found that the correspondence of self-report and objective drug use was roughly equivalent between MSM and general population males [6, 7]. For YMSM specifically, Fendrich et al. [6] found no differences in underreporting cocaine or marijuana use relative to older MSM. Compared to young males in the general population, however, YMSM were more likely to self-report past-year use of ecstasy, inhalants, ketamine, methamphetamine, and tranquilizers/sedatives but not past-month substance use [7]. Those differences dissipated after adjusting for underreporting among the general population young males, suggesting that the YMSM self-reports were more valid.
Given the dearth of research in this area on YMSM/TW, who are particularly affected by the substance use epidemic [20, 21] as well as its association with HIV [22, 23], it is important to quantify the extent of measurement error and identify factors associated with inaccuracies. Additionally, the intersection of sexual orientation and race/ethnicity should be explored. Mistrust of the medical establishments has been shown to be high among Black MSM [24], possibly contributing to the lower validity of drug use self-reports observed among racial/ethnic MSM [25]. The current study aimed to assess the concordance between drug use self-reports and urinalysis drug screens and to examine predictors of non-correspondence among a large, racially diverse sample of YMSM/TW.
2. Methods
2.1. Design and procedures
Data came from RADAR, a cohort study of HIV risk and substance use among YMSM/TW living around Chicago, IL. Using an accelerated longitudinal design [26], we recruited YMSM/TW from three previous studies, conducted in 2008, 2011, and 2015, as well as newly recruited individuals (also in 2015) to form the new RADAR cohort. This process has been described in detail elsewhere [27, 28]. Individuals were eligible for RADAR if they were 16–29 years old, were assigned male at birth, spoke English, and either reported a sexual encounter with a man in the previous year or identified as gay or bisexual.
Data collection occurred every 6 months. Each study visit included a computer-assisted self-interview (CASI) and collection of biological specimens, including urine for drug screening and STI testing. All participants were informed of and consented to the drug screening, which was processed on site (cf. STI testing, which was processed by an off-site laboratory). Participants were informed and directed to a healthcare provider if they tested positive for STIs; results of the drug screen were not reported back to participants. Participants provided written consent and received $50 in compensation each visit. Study activities were approved by the Institutional Review Board at Northwestern University with waivers of parental permission for minors [19]. Baseline data collection for RADAR began in February 2015 and closed to primary recruits in April 2017; follow-up visits are ongoing. The current study used data from the first three waves collected through May 2017. At the time of analysis, 1,029 YMSM/TW had completed a baseline survey, 842 had completed Wave 2, and 599 had completed Wave 3.
2.2. Measures
Urine drug screen.
Urine samples were tested with the Ecstasy Drug Test (DMD-114) and Multi-Drug Screen Test Panel (DOA-264) dip cards from Innovacon, Inc. (San Diego, CA), to detect metabolites of the following seven drugs: methylenedioxymethamphetamine (MDMA), marijuana, cocaine, opiates, amphetamines, methamphetamine, and benzodiazepines. Sensitivities for the urine screens compared to gas chromatography/mass spectrometry ranged from 96% (cocaine) to >99% (opiates); specificities ranged from 90% (cocaine) to >99% (MDMA) [29]. Estimated detection periods for each substance are described below.
Self-reported substance use.
At each visit, participants were asked to select from a list any substances they used in the past 6 months, including ecstasy, marijuana, cocaine, heroin, methamphetamines, prescription stimulants (e.g., Adderall, Concerta), prescription painkillers (e.g., Vicodin, Codeine), and prescription depressants/tranquilizers (e.g., Ativan, Klonopin). Endorsement of a substance triggered a question asking how many occasions they used that substance in the past 30 days. At baseline only, those who endorsed past-6-month substance use were also asked how many days it had been since they last used that drug.
Responses to the recency question were matched to urinalysis detection windows for each drug to assess whether participants reported using that drug within the detectable period. Detection windows were determined from the test product insert [29] or, when not explicitly stated, estimated from a SAMHSA technical assistance publication [30]. Window periods based on the product insert were 1–2 days for cocaine, 3–5 days for methamphetamines, 3–7 days for benzodiazepines, and 3–10 days for marijuana. Those based on the SAMHSA publication were 1–2 days for MDMA and 1–4 days for amphetamines and opiates. For these comparisons, prescription stimulants were considered amphetamines, heroin and prescription painkillers were considered opiates, and prescription depressants/tranquilizers were considered benzodiazepines. Two dichotomous variables were calculated for each substance using the lower and upper limits of the detection windows as bounds. Self-report and urinalysis measures were also calculated for a composite of non-marijuana drugs.
Demographic covariates.
Self-reported age, race/ethnicity (Non-Hispanic Black, Non-Hispanic White, Hispanic/Latino, Non-Hispanic Multiracial/Other); sexual orientation identity (gay, bisexual, other); and gender identity (cisgender man, gender minority [e.g., transgender woman, non-binary]) were assessed at baseline. Socioeconomic status (SES) at baseline was determined using the urban hardship index [31, 32], a standardized score calculated from six census-tract-level indicators. Census tracts within Cook County, IL, were ranked and assigned scores ranging from 0 to 100, with higher values representing greater hardship or lower SES [33]. Participants who reported living in Cook County were assigned the score matching their address; those who lived outside the county or did not report an address were not assigned a score (n = 90).
Arrest history.
Because substance abuse is involved in nearly 80% of juvenile arrests [34], previous incarceration may influence an individual’s keenness to disclose continued use of illicit drugs. Participants were asked at baseline if they had ever been arrested by the police. In subsequent waves, they were asked if they had been arrested in the past 6 months. These variables were combined to create a dichotomous item at each wave representing having been arrested by that wave.
2.3. Analytic approach
Concordance between substance use self-report and urinalysis.
Using baseline data, self-reported recency of drug use in the upper (more liberal) and lower (more conservative) detection windows were compared to reactive urine screens using sensitivity, specificity, and conditional kappa. The traditional Cohen’s kappa assesses chance-adjusted agreement between two measures, allowing for equal probability of error on both sides. In contrast, conditional kappa holds one measure (i.e., urinalysis) as correct and assesses the chance-adjusted agreement of the other measure to the first [35–37]. Sensitivity and conditional kappa were also calculated for substance use in the past 6 months and 30 days; specificity was not calculated because the longer recall periods would have included individuals who may have truthfully disclosed using drugs but were not detected by the urine screen, thereby erroneously inflating the number of false negatives.
Predictors of concordance.
To sufficiently power analyses of low frequency drugs, we collapsed all substances except marijuana. Using data from Waves 1–3, generalized estimating equations (GEE) logistic regression was used to assess predictors of self-reporting past-6-month use of marijuana and non-marijuana drugs among participants with reactive urine screens for each. Study wave (1, 2, or 3) and year of first participation in one of our studies (2008, 2011, or 2015) were added as covariates to examine possible study design effects that may have been associated with increased disclosure over time. Individuals who first participated in 2008 and 2011 had previously completed repeated longitudinal measures of substance use prior to joining the RADAR cohort. Although those prior longitudinal data were not included here, we examined if participants who participated in the 2008 and 2011 studies were more likely to disclose substance use as a result of longer involvement with the research team and more experience reporting on substance use. Having a history of arrest at the time of assessment was also added as a predictor.
For each substance, the best fitting covariance structure was identified in the unconditional model using the quasi-likelihood under independence model criterion (QIC) [38]. Each predictor was then examined in a bivariate GEE regression for improvement to model fit relative to the unconditional model, using the corrected quasi-likelihood criterion (QICC). Predictors that improved fit were included as main effects in a preliminary multivariable model, which was examined again for covariance structure and reduced in a stepwise approach using the Wald test and QICC. Lastly, interactions were added and assessed. All analyses were conducted with IBM SPSS Statistics, Version 25, except conditional kappa, which was calculated in Microsoft Excel (Microsoft Office Professional Plus 2013) (see Appendix A for equations).
3. Results
3.1. Descriptive statistics
Table 1 presents baseline demographics of the YMSM/TW in the RADAR cohort. Participants on average were emerging adults (M = 21.2, SD = 3.0, range = 16.0–29.9) and from higher SES neighborhoods (i.e., median hardship score is below the midrange; median = 37.76, range = 12.5–72.5), and the majority identified as gay (69.3%) and as cisgender men (92.0%). The cohort was racially/ethnically diverse, and about a quarter had ever experienced an arrest at the time of their baseline visit. Comparisons between baseline and subsequent waves (not shown) using McNemar tests indicated no significant differences in characteristics over time that would signify differential dropout.
Table 1.
Descriptive statistics of YMSM/TW at baseline in RADAR (N= 1029)
| Variable | Cases | M (SD; min, max) or n (%) |
|---|---|---|
| Age | 1029 | 21.22 (2.95; 16.01, 29.92) |
| Socioeconomic hardship | 943 | 38.09 (13.20; 12.49, 72.47) |
| Year of first research participation | 1029 | |
| 2008 | 67 (6.5%) | |
| 2011 | 162 (15.7%) | |
| 2015 | 800 (77.7%) | |
| Race/ethnicity | 1029 | |
| Non-Hispanic Black or African American | 351 (34.1%) | |
| Non-Hispanic White | 256 (24.9%) | |
| Hispanic/Latino | 307 (29.8%) | |
| Non-Hispanic multiracial/other | 115 (11.2%) | |
| Sexual orientation identity | 1028 | |
| Gay | 712 (69.3%) | |
| Bisexual | 221 (21.5%) | |
| Other | 95 (9.2%) | |
| Gender identity | 1028 | |
| Cisgender man | 946 (92.0%) | |
| Gender minority | 82 (8.0%) | |
| Ever arrested | 1026 | 260 (25.3%) |
No participants directly declined the urinalysis drug screen, though we were unable to obtain samples from 22 individuals at baseline. Of the 1007 samples screened, one participant did not receive the MDMA test, and another participant had an indeterminate result for cocaine, which was excluded from subsequent analyses; one indeterminate result for methamphetamine in Wave 2 was also dropped. Table 2 presents baseline prevalence estimates for each substance as well as for any non-marijuana substance, calculated using urinalysis and different recall periods of self-report. For methamphetamine and cocaine, the prevalence estimates based on urinalyses were significantly higher than those self-reported by participants within the detectable window period. In contrast, the urinalysis result for marijuana did not differ from self-reported use within the more conservative detection limit (3 days) and was significantly lower than self-reported use within the more liberal limit (10 days). Urinalysis for any non-marijuana drug similarly differed from only one of the detection limits. Urine-screened prevalence estimates for MDMA, amphetamines, opiates, and benzodiazepines were not significantly different from either detection limit.
Table 2.
Prevalence of self-reported and urinalysis-screened substance use at baseline among YMSM/TW in RADAR (N= 1029)
| Recall period | N | n | % | 95% CI | pa | N | n | % | 95% CI | pa | N | n | % | 95% CI | pa | N | n | % | 95% CI | pa |
|---|---|---|---|---|---|---|---|---|---|---|---|---|---|---|---|---|---|---|---|---|
| MDMA |
Amphetamines |
Methamphetamine |
Cocaine |
|||||||||||||||||
| Past 6 months | 1028 | 105 | 10.2 | [8.5, 12.2] | 1027 | 122 | 11.9 | [10.0, 13.9] | 1028 | 25 | 2.4 | [1.6, 3.5] | 1028 | 127 | 12.4 | [10.4, 14.3] | ||||
| Past 30 days | 1028 | 61 | 5.9 | [4.6, 7.5] | 1012 | 55 | 5.4 | [4.1, 6.9] | 1028 | 14 | 1.4 | [0.7, 2.1] | 1028 | 80 | 7.8 | [6.1, 9.4] | ||||
| Detectable period UL | 1028 | 8 | 0.8 | [0.3, 1.4] | 1.000 | 1012 | 29 | 2.9 | [1.9, 3.9] | .584 | 1028 | 7 | 0.7 | [0.2, 1.3] | .003 | 1028 | 21 | 2.0 | [1.3, 2.9] | .004 |
| Detectable period LL | 1028 | 2 | 0.2 | [0.0, 0.5] | .065 | 1012 | 23 | 2.3 | [1.5, 3.2] | .089 | 1028 | 6 | 0.6 | [0.2, 1.2] | .002 | 1028 | 13 | 1.3 | [0.6, 2.0] | <.001 |
| Positive urinalysis | 1006 | 9 | 0.9 | [0.4, 1.6] | 1007 | 33 | 3.3 | [2.2, 4.3] | 1007 | 18 | 1.8 | [1.0, 2.6] | 1007 | 38 | 3.8 | [2.6, 5.0] | ||||
| Marijuana |
Opiates |
Benzodiazepines |
Any non-marijuana drug |
|||||||||||||||||
| Past 6 months | 1028 | 726 | 70.6 | [67.7, 73.4] | 1025 | 147 | 14.3 | [12.3, 16.6] | 1028 | 105 | 10.2 | [8.5, 12.1] | 1024 | 356 | 34.8 | [31.9, 37.5] | ||||
| Past 30 days | 1028 | 607 | 59.0 | [56.1, 62.1] | 1025 | 51 | 5.0 | [3.6, 6.3] | 1026 | 56 | 5.5 | [4.2, 7.0] | 1012 | 212 | 20.9 | [18.3, 23.0] | ||||
| Detectable period UL | 1026 | 508 | 49.5 | [46.4, 52.4] | <.001 | 1025 | 14 | 1.4 | [0.8, 2.1] | .648 | 1026 | 41 | 4.0 | [2.9, 5.2] | .086 | 1009 | 93 | 9.2 | [7.3, 10.7] | .492 |
| Detectable period LL | 1026 | 375 | 36.5 | [33.4, 39.4] | .135 | 1025 | 9 | 0.9 | [0.4, 1.5] | .791 | 1026 | 30 | 2.9 | [2.0, 4.0] | .643 | 1009 | 66 | 6.5 | [5.0, 7.9] | .001 |
| Positive urinalysis | 1007 | 389 | 38.6 | [35.0, 40.7] | 1007 | 11 | 1.1 | [0.5, 1.7] | 1007 | 27 | 2.7 | [1.7, 3.7] | 1006 | 100 | 9.9 | [8.0, 11.5] | ||||
Note. Individuals who self-reported use may not constitute the same individuals who tested positive in urinalysis. N = number of valid cases for that drug per recall period. UL = self-reported drug use at the upper limit of urinalysis drug screening. LL = self-reported use at the lower limit of urinalysis drug screening.
Based on McNemar (amphetamines, cocaine, marijuana, benzodiazepines, any non-marijuana drug) or exact binomial (MDMA, methamphetamine, opiates) test comparing self-reported to urinalysis-screened prevalence.
3.2. Concordance between substance use self-report and urinalysis
Table 3 presents measures of correspondence between self-reporting drug use with different recall periods and having a reactive urinalysis screen at baseline. For drugs other than marijuana, self-report sensitivities (i.e., number of self-reported users divided by detected users) were <0.5 within the detection windows but increased with longer recall periods. For example, among urinalysis-screened users of benzodiazepines, methamphetamine, and cocaine, only about a quarter disclosed using those drugs in the more conservative window period, and those proportions rose to about half reporting use in the past 6 months. For drugs other than marijuana, self-report specificities (i.e., number of self-reported non-users divided by those with non-reactive drug screens) were >0.9, due in part to the low prevalence of those drugs in the sample and few false positive reports. For marijuana, however, the lower specificities suggest either over-reporting (by almost 25% using the upper detection limit) and/or imprecision in the urine drug screen leading to misclassification of users as non-users.
Table 3.
Concordance between self-reported and urinalysis-screened substance use at baseline among YMSM/TW in RADAR (N= 1029)
| Drug | Sensitivity | 95% CI | Specificitya | 95% CI | Conditional κ | 95% CI |
|---|---|---|---|---|---|---|
| Marijuana | ||||||
| Past 6 months | .941 | [.914, .961] | — | — | .800 | [.724, .875] |
| Past 30 days | .925 | [.896, .949] | — | — | .818 | [.758, .879] |
| Detectable window UL | .907 | [.875, .933] | .765 | [.731, .798] | .816 | [.762, .870] |
| Detectable window LL | .788 | [.745, .826] | .898 | [.873, .920] | .665 | [.608, .723] |
| MDMA | ||||||
| Past 6 months | .333 | [.095, .665] | — | — | .257 | [−.084, .598] |
| Past 30 days | .222 | [.041, .542] | — | — | .173 | [−.114, .460] |
| Detectable window UL | .000 | —b | .992 | [.986, .998] | -.008 | [−.014, −.002] |
| Detectable window LL | .000 | —b | .998 | [.995, 1.00] | -.002 | [−.005, .001] |
| Amphetamines | ||||||
| Past 6 months | .545 | [.377, .707] | — | — | .484 | [.295, .674] |
| Past 30 days | .515 | [.348, .680] | — | — | .487 | [.309, .664] |
| Detectable window UL | .485 | [.320, .652] | .986 | [.978, .993] | .469 | [.297, .642] |
| Detectable window LL | .424 | [.266, .594] | .991 | [.983, .995] | .411 | [.241, .580] |
| Methamphetamine | ||||||
| Past 6 months | .444 | [.234, .670] | — | — | .430 | [.197, .663] |
| Past 30 days | .389 | [.190, .618] | — | — | .380 | [.154, .606] |
| Detectable window UL | .333 | [.148, .563] | .999 | [.996, 1.00] | .329 | [.112, .545] |
| Detectable window LL | .278 | [.110, .505] | .999 | [.996, 1.00] | .273 | [.068, .479] |
| Cocaine | ||||||
| Past 6 months | .526 | [.370, .679] | — | — | .458 | [.280, .637] |
| Past 30 days | .500 | [.345, .655] | — | — | .457 | [.288, .627] |
| Detectable window UL | .368 | [.227, .527] | .993 | [.986, .997] | .355 | [.202, .508] |
| Detectable window LL | .237 | [.122, .386] | .996 | [.990, .999] | .227 | [.094, .360] |
| Benzodiazepines | ||||||
| Past 6 months | .519 | [.335, .699] | — | — | .464 | [.257, .671] |
| Past 30 days | .346 | [.184, .537] | — | — | .310 | [.120, .500] |
| Detectable window UL | .308 | [.154, .497] | .968 | [.956, .978] | .280 | [.098, .461] |
| Detectable window LL | .269 | [.126, .456] | .976 | [.966, .985] | .247 | [.074, .419] |
| Opiates | ||||||
| Past 6 months | .727 | [.435, .924] | — | — | .682 | [.375, .988] |
| Past 30 days | .636 | [.346, .870] | — | — | .618 | [.320, .915] |
| Detectable window UL | .273 | [.076, .565] | .989 | [.981, .994] | .262 | [−.002, .527] |
| Detectable window LL | .273 | [.076, .565] | .994 | [.988, .998] | .266 | [.003, .530] |
| Any non-marijuana illicit drug | ||||||
| Past 6 months | .690 | [.595, .775] | — | — | .524 | [.390, .658] |
| Past 30 days | .640 | [.543, .730] | — | — | .544 | [.430, .659] |
| Detectable window UL | .434 | [.339, .533] | .946 | [.930, .960] | .377 | [.276, .478] |
| Detectable window LL | .354 | [.264, .451] | .965 | [.952, .976] | .307 | [.213, .402] |
Specificity was not calculated for past-6-month and past-30-day use because of the potential for inflated false negatives.
Confidence interval could not be calculated because sensitivity was zero.
Conditional kappa, or the level of agreement between self-report and a reactive urine screen, indicated fair agreement for benzodiazepines, methamphetamine, cocaine, and opiates; moderate agreement for amphetamines; and substantial to almost perfect agreement for marijuana within the detection periods [39]. Of the 9 participants who tested positive for MDMA, none reported recently using it; conversely, none of the 8 people who self-reported use within the more liberal detection window tested positive. For all drugs, conditional kappa increased with longer recall periods.
3.3. Predictors of concordance
Variables selected to include in the preliminary multivariable GEE logistic regression model for both marijuana and non-marijuana drugs, based on improvement to model fit, were year of first participation, race/ethnicity, gender identity, and arrest history. Age and SES were retained as covariates despite non-significance. Because all White individuals who had a reactive marijuana drug screen self-reported use, which left a zero cell-count among White individuals who did not self-report, race/ethnicity was collapsed into a dichotomous variable (Non-Hispanic Black vs. Other) to estimate the marijuana model. Sexual orientation did not improve fit in either model and was excluded thereafter.
Table 4 presents the final multivariable GEE logistic regression models for marijuana and non-marijuana drugs. Both models achieved greatest fit with an exchangeable (compound symmetry) covariance structure. Although year of first participation was retained in the models based on the QICC, the parameter estimates were not statistically significant. Relative to Black participants, participants of other race/ethnicities had significantly greater odds of disclosing non-marijuana drug use but not marijuana use. Gender minority participants had significantly lower odds of disclosing marijuana use but not non-marijuana drug use, and participants with an arrest history had greater odds of disclosing both. Interactions between covariates were not significant.
Table 4.
Multivariable predictors of self-reporting substance use in the past 6 months among urinalysis-confirmed users in RADAR (Waves 1–3)
| Marijuana (n= 916) |
Any non-marijuana drug (n= 201) |
|||||
|---|---|---|---|---|---|---|
| Parameter | AOR | [95% CI] | p | AOR | [95% CI] | p |
| Year of first research participation (Ref = 2008) | ||||||
| 2011 | 0.725 | [0.211, 2.491] | .609 | 0.849 | [0.236, 3.054] | .802 |
| 2015 | 1.558 | [0.454, 5.344] | .481 | 2.957 | [0.910, 9.613] | .071 |
| Race/ethnicity (Ref = Non-Hispanic Black) | ||||||
| Non-Hispanic White | — | — | — | 6.258 | [2.396, 16.345] | <.001 |
| Hispanic/Latino | — | — | — | 4.854 | [1.803, 13.067] | .002 |
| Non-Hispanic multiracial/other | — | — | — | 4.528 | [1.531, 13.389] | .006 |
| All race/ethnicities except Blacka | 1.595 | [0.775, 3.284] | .205 | — | — | — |
| Gender minority | 0.324 | [0.145, 0.724] | .006 | — | — | — |
| Arrest history | 3.171 | [1.488, 6.758] | .003 | 2.466 | [1.118, 5.438] | .025 |
Note. For each model, only predictors that improved model fit at the bivariate level, assessed using the corrected quasi-likelihood criterion, were included in the multivariable model; dashes indicate non-inclusion. Baseline age and socioeconomic status were retained as covariates in both models but were not significant.
A dichotomous variable for race/ethnicity was included for marijuana in lieu of the multinomial variable because of a zero cell-count among White participants who did not report use.
4. Discussion
The current study examined correspondence between self-reported substance use and urine drug screening among a large sample of racially diverse YMSM/TW. Overall, use of drugs other than marijuana in RADAR appears lower than estimates found in other studies of urban YMSM [40–43] but still 2–3 times higher than those among population samples of young adult men [44], though exact comparisons are difficult because of differing age ranges, types of drugs assessed, and recall periods. Based on prevalence estimates, we found no significant difference between urinalysis results and self-reported use within at least one of the detection limits for MDMA, amphetamines, marijuana, opiates, benzodiazepines, and any non-marijuana drug, suggesting that self-reported prevalence may be a reasonable population-level estimate of these substances in this group. That self-reported methamphetamine and cocaine use were significantly lower than urinalyses may reflect greater stigmatization of these drugs relative to others among YMSM/TW [45].
Examining all forms of disagreement, however, may obscure the amount of underreporting at the individual level because McNemar’s test compares individuals who do not disclose use but have a positive urinalysis against those who do disclose use but have a negative urinalysis. Isolating analyses to only those who tested positive, we found substantial underreporting across all drugs except marijuana. Sensitivities below 0.5 within the detection windows mean that less than half of participants with detectable drug metabolites disclosed using those substances recently. For MDMA, the discrepancy may be due in part to the urinalysis cross-reacting with methamphetamine or amphetamines, which share some of the same metabolites [29]: Of the 9 participants with reactive MDMA screens, 5 were also positive for amphetamine and methamphetamine. For other drugs, however, our results indicate bias in self-reports. Because of how survey items were nested (e.g., someone who reported use in the past 30 days would have also reported use in the past 6 months), sensitivities across recall periods for a substance should have been equal. Instead, the monotonic increase with longer recall period, as observed in other studies [5, 46, 47], suggests participants may be more willing to disclose substance use if there is perceived distance from the behavior, possibly due to impression management [2, 3, 48]. Alternatively, there may be temporal recall errors, such as a telescoping effect [48]. Future research on recent substance use among YMSM/TW may need to specifically address mitigating such biases and should similarly use a combination of CASI and bioassays (e.g., urine, hair, nails) to get more valid estimates than self-report alone [47, 49].
There was excellent agreement between self-reported marijuana use and positive urinalysis, even within the upper limit of the detection window (the more conservative window period appears to have been too restrictive). The high prevalence of use, generally low stigma among youth [50], and recent decriminalization in Illinois [51] likely facilitated disclosure. Previous studies have similarly found over-reporting of marijuana use compared to drug screens [47, 52]. Although social desirability (e.g., over-reporting to appear more attractive) and errors in memory have been posited as potential causes of this phenomenon, given the placement within a longer survey and the short recall period of interest, our over-reporting was more likely the result of imprecision within the drug screen. Urinalysis detection windows are proxies for the average concentration of drug metabolites found in the body, which vary based on dosage, frequency of use, route of administration, and individual metabolisms [30]. Cannabis in particular has widely varying detectability dependent on chronicity; whereas we selected a window period of 3‒10 days, other sources have reported detectable metabolites in urine up to 90 days after use among heavy users [53]. It is possible that those RADAR participants who reported using marijuana within the drug detection period but had non-reactive tests could have used cannabis infrequently and at a dosage lower than the threshold of detectability.
Our estimates for sensitivity and conditional kappa of self-reported marijuana use were comparable to or higher than previous correspondence findings in equivalent time frames among general population adults [5], adult arrestees [46], MSM aged 18‒55 [6], and high-risk adolescents [47, 52, 54]. We found comparable or higher estimates for opiate and cocaine use concordance relative to general population adults and arrestees [5, 46] but had lower estimates for cocaine, MDMA, and methamphetamine use concordance relative to previous studies among MSM, with some differences by race [6, 25]. Differences in drug use patterns by age have been reported among MSM [55], but these discrepancies may also be artifacts of the low frequency of use. None of the studies identified examined benzodiazepines or amphetamines.
Across the 3 waves of data, race/ethnicity was a consistent predictor of positive concordance. In line with previous research, Black MSM/TW appear less likely to self-report non-marijuana substance use [1, 2, 8–10, 25, 56]. Empirical exploration into why this phenomenon exists has found limited support for cycles of poverty and cultural distrust due to discrimination as factors [4, 9, 10]. Sexual orientation was not associated with positive concordance, matching previous findings [25]. In contrast, gender minority status was associated with 68% lower odds of self-reporting marijuana use. This represents a novel finding in the literature, as no research to our knowledge exists on substance use concordance among this group. Potential explanations may mirror those of racial/ethnic minorities around reactions to discrimination or stigma [57]. Having a history of arrest was predictive of increased odds of disclosure among marijuana and non-marijuana drug users. Previous studies have documented underreporting of both among adult arrestees [1] and juvenile drug offenders [56, 58, 59], but research comparing arrestees versus non-arrestees is lacking. We speculate that YMSM/TW who have been arrested may be more willing to tell the truth to avoid getting into more trouble. However, our results differ from those of White et al. [25] among MSM aged 18‒40, in which the effect of arrest history attenuated to non-significance after controlling for race. Further research is needed on all of these factors.
Lastly, wave and year of first participation were not significant predictors of positive concordance. Framed differently, self-reported substance use data appeared as valid at baseline as they were after multiple waves of follow-up and multiple years of research participation, respectively, though a marginal finding toward greater disclosure of non-marijuana drug use among those recruited in 2015 may hint at possible generational differences. Survey methodologists have long been concerned about threats to construct validity due to the research process itself, such as altered behavior in response to self-evaluation, reduced social desirability bias due to familiarity with the researchers and no observed consequences from reporting illegal or stigmatized behaviors, and practice effects [2, 3, 48, 60]. Our study, however, demonstrated that impression management, the main component of social desirability bias, was sustained despite participants’ becoming more comfortable with study procedures and staff. This finding has widespread positive implications for both cross-sectional and longitudinal epidemiological research in that it implies that no systematic bias is being introduced as trust is built with researchers.
Our results should be interpreted with some caveats. As previously noted, the validity of urinalysis drug screening is impacted by several individual and contextual factors, and the lower- and upper-limit detection windows were proxies for that variability. Future studies could incorporate additional biomarkers from hair or nails to increase the sensitivity and detection period of the screening data. Urinalyses may be limited by similarities in drug metabolites; they may not be able to distinguish between drugs, such as prescription opioids and heroin, or may falsely detect a substance due to cross-reactivity, such as with MDMA, amphetamines, and methamphetamine. Relatedly, illicit tablets may contain or be laced with other substances unknown to the users, which may adversely affect the accuracy of self-reports. This point is particularly relevant to the growing Fentanyl crisis, in which the drug is increasingly being mixed into other illicit substances without the knowledge of the user [61, 62]. In contrast, participants were aware that they would provide a urine sample for drug screening, which may have improved self-reports compared to a non-tested sample. It is important to note that urine and other biomarker screens are considered preliminary tests; gas chromatography/mass spectrometry confirmation should be used if higher accuracy is needed. The RADAR cohort is a non-probabilistic sample drawn from the Chicagoland area, which may limit generalizability outside of the region. Although the inclusion of participants first recruited in 2008 and 2011 is a unique strength of the design, the relatively small number of them (7% and 16%, respectively) may have limited the ability to detect subsample effects. Finally, the low prevalence of most drugs reduced power to detect nuanced differences for specific substances.
4.1. Conclusions
Despite these limitations, this study contributes to a small body of research on the validity of self-reported substance use and joins only a handful of other studies examining this issue among MSM/TW. The longitudinal design allows for preliminary inferences of causality and elevates the robustness of our findings, the implications of which are substantial for public health research and practice: The impact of illicit substances on YMSM/TW may be larger than previously thought, and policies and programs that rely on self-report may be missing a substantial portion of the drug-using population. Epidemiological studies interested in recent substance use may need to spend additional effort bolstering against social desirability biases and include biomarker drug screening into their protocols. Future research should continue to identify mechanisms behind racial differences in self-report reliability and other predictors of concordance and also expand on the effects for transgender and other gender minority individuals and individuals with a history of arrest.
Acknowledgments
Acknowledgements
The authors would like to thank the entire RADAR research team, particularly Dr. Thomas Remble and Antonia Clifford for overseeing the project, Daniel T. Ryan for data management, and Kevin Moran for calculating the Urban Hardship Index. We also thank the RADAR participants for sharing their experiences with us.
Appendix A.
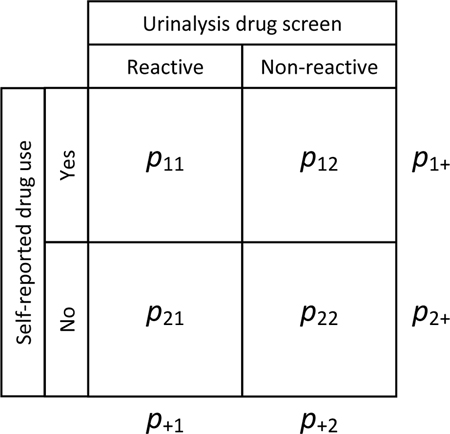
Given pij, the proportion of participants in row i and column j, the chance-adjusted conditional measure of agreement between self-reported substance use and a reactive urinalysis drug screen, κ+1, was calculated using the following equation:
As described by Rossiter [37], the standard deviation, s, of κ+1 was calculated with the following:
Finally, the 95% confidence interval for κ was approximated as follows:
References
- 1.Hunt DE, Kling R, Almozlino Y, Jalbert S, Chapman MT, Rhodes W. Telling the Truth About Drug Use: How Much Does It Matter? J Drug Iss 2015;45(3):314–29. doi: 10.1177/0022042615589406. PubMed PMID: WOS:000356806700006. [Google Scholar]
- 2.Johnson TP. Sources of Error in Substance Use Prevalence Surveys. Int Sch Res Notices 2014;2014:923290. doi: 10.1155/2014/923290. PubMed PMID: 27437511; PMCID: PMC4897110. [DOI] [PMC free article] [PubMed] [Google Scholar]
- 3.Brener ND, Billy JO, Grady WR. Assessment of factors affecting the validity of self-reported health-risk behavior among adolescents: evidence from the scientific literature. J Adolesc Health 2003;33(6):436–57. PubMed PMID: 14642706. [DOI] [PubMed] [Google Scholar]
- 4.Johnson TP, Fendrich M. Modeling sources of self-report bias in a survey of drug use epidemiology. Ann Epidemiol 2005;15(5):381–9. doi: 10.1016/j.annepidem.2004.09.004. PubMed PMID: 15840552. [DOI] [PubMed] [Google Scholar]
- 5.Fendrich M, Johnson TP, Wislar JS, Hubbell A, Spiehler V. The utility of drug testing in epidemiological research: results from a general population survey. Addiction 2004;99(2):197–208. PubMed PMID: 14756712. [DOI] [PubMed] [Google Scholar]
- 6.Fendrich M, Mackesy-Amiti ME, Johnson TP. Validity of self-reported substance use in men who have sex with men: comparisons with a general population sample. Ann Epidemiol 2008;18(10):752–9. doi: 10.1016/j.annepidem.2008.06.001. PubMed PMID: 18693041; PMCID: PMC2586999. [DOI] [PMC free article] [PubMed] [Google Scholar]
- 7.Mackesy-Amiti ME, Fendrich M, Johnson TR. Prevalence of recent illicit substance use and reporting bias among MSM and other urban males. Addict Behav 2008;33(8):1055–60. PubMed PMID: ISI:000257520200010. [DOI] [PMC free article] [PubMed] [Google Scholar]
- 8.Johnson TP, Bowman PJ. Cross-cultural sources of measurement error in substance use surveys. Subst Use Misuse 2003;38(10):1447–90. PubMed PMID: 14509547. [DOI] [PubMed] [Google Scholar]
- 9.Richardson J, Fendrich M, Johnson TP. Neighborhood effects on drug reporting. Addiction 2003;98(12):1705–11. doi: DOI 10.1111/j.1360-0443.2003.00561.x. PubMed PMID: WOS:000187366000013. [DOI] [PubMed] [Google Scholar]
- 10.Fendrich M, Johnson TP. Race/ethnicity differences in the validity of self-reported drug use: results from a household survey. J Urban Health 2005;82(2 Suppl 3):iii67–81. doi: 10.1093/jurban/jti065. PubMed PMID: 15933333; PMCID: PMC3455900. [DOI] [PMC free article] [PubMed] [Google Scholar]
- 11.Harrison LD, Martin SS, Enev T, Harrington D. Comparing drug testing and self-report of drug use among youths and young adults in the general population Rockville, MD: Substance Abuse and Mental Health Services Administration, Office of Applied Studies, 2007. Contract No.: DHHS Publication No. SMA 07–4249. [Google Scholar]
- 12.Mohr JM. Oppression by scientific method: The use of science to “other” sexual minorities Journal of Hate Studies 2009;7(1):21–45. [Google Scholar]
- 13.Burke SE, Dovidio JF, Przedworski JM, Hardeman RR, Perry SP, Phelan SM, Nelson DB, Burgess DJ, W. YM, van Ryn M. Do Contact and Empathy Mitigate Bias Against Gay and Lesbian People Among Heterosexual First-Year Medical Students? A Report From the Medical Student CHANGE Study. Acad Med 2015;90(5):645–51. doi: 10.1097/ACM.0000000000000661. [DOI] [PMC free article] [PubMed] [Google Scholar]
- 14.Bauer GR, Wayne LD. Cultural sensitivity and research involving sexual minorities. Perspect Sex Reprod Health 2005;37(1):45–7. Epub 2005/05/13. doi: 10.1363/psrh.37.45.05. PubMed PMID: 15888403. [DOI] [PubMed] [Google Scholar]
- 15.Magura S, Kang SY. Validity of self-reported drug use in high risk populations: a meta-analytical review. Subst Use Misuse 1996;31(9):1131–53. PubMed PMID: 8853234. [DOI] [PubMed] [Google Scholar]
- 16.McKay TA, McDavitt B, George S, Mutchler MG. ‘Their type of drugs’: perceptions of substance use, sex and social boundaries among young African American and Latino gay and bisexual men. Cult Health Sex 2012;14(10):1183–96. doi: 10.1080/13691058.2012.720033. PubMed PMID: 23013278; PMCID: PMC3507549. [DOI] [PMC free article] [PubMed] [Google Scholar]
- 17.Tobin K, Davey-Rothwell M, Yang C, Siconolfi D, Latkin C. An examination of associations between social norms and risky alcohol use among African American men who have sex with men. Drug Alcohol Depend 2014;134:218–21. Epub 2013/11/12. doi: 10.1016/j.drugalcdep.2013.10.002. PubMed PMID: 24210770; PMCID: PMC4499778. [DOI] [PMC free article] [PubMed] [Google Scholar]
- 18.Kecojevic A, Corliss HL, Lankenau SE. Motivations for prescription drug misuse among young men who have sex with men (YMSM) in Philadelphia. Int J Drug Policy 2015;26(8):764–71. doi: 10.1016/j.drugpo.2015.03.010. PubMed PMID: 25936445; PMCID: PMC4499499. [DOI] [PMC free article] [PubMed] [Google Scholar]
- 19.Mustanski B Ethical and regulatory issues with conducting sexuality research with LGBT adolescents: a call to action for a scientifically informed approach. Arch Sex Behav 2011;40:673–86. doi: 10.1007/s10508-011-9745-1. PubMed PMID: 21528402; PMCID: Not relevant to NIH public access policy. [DOI] [PubMed] [Google Scholar]
- 20.Marshal MP, Friedman MS, Stall R, Thompson AL. Individual trajectories of substance use in lesbian, gay and bisexual youth and heterosexual youth. Addiction 2009;104(6):974–81. PubMed PMID: 19344440. [DOI] [PMC free article] [PubMed] [Google Scholar]
- 21.Newcomb ME, Birkett M, Corliss HL, Mustanski B. Sexual orientation, gender, and racial differences in illicit drug use in a sample of US high school students. Am J Public Health 2014;104(2):304–10. doi: 10.2105/AJPH.2013.301702. PubMed PMID: 24328653; PMCID: PMC3935691. [DOI] [PMC free article] [PubMed] [Google Scholar]
- 22.Mustanski B, Andrews R, Herrick A, Stall R, Schnarrs PW. A syndemic of psychosocial health disparities and associations with risk for attempting suicide among young sexual minority men. Am J Public Health 2014;104(2):287–94. doi: 10.2105/AJPH.2013.301744. PubMed PMID: 24328641; PMCID: PMC3935701. [DOI] [PMC free article] [PubMed] [Google Scholar]
- 23.Mustanski B, Garofalo R, Donenberg GR. A syndemic of psychosocial health problems increase risk for HIV among urban young men who have sex with men American Public Health Association; Washington, D.C.2007. [DOI] [PMC free article] [PubMed] [Google Scholar]
- 24.Eaton LA, Driffin DD, Kegler C, Smith H, Conway-Washington C, White D, Cherry C. The role of stigma and medical mistrust in the routine health care engagement of black men who have sex with men. Am J Public Health 2015;105(2):e75–82. Epub 2014/12/19. doi: 10.2105/AJPH.2014.302322. PubMed PMID: 25521875; PMCID: PMC4318301. [DOI] [PMC free article] [PubMed] [Google Scholar]
- 25.White D, Rosenberg ES, Cooper HL, del Rio C, Sanchez TH, Salazar LF, Sullivan PS. Racial differences in the validity of self-reported drug use among men who have sex with men in Atlanta, GA. Drug Alcohol Depend 2014;138:146–53. doi: 10.1016/j.drugalcdep.2014.02.025. PubMed PMID: 24629628; PMCID: PMC4104302. [DOI] [PMC free article] [PubMed] [Google Scholar]
- 26.Miyazaki Y, Raudenbush SW. Tests for linkage of multiple cohorts in an accelerated longitudinal design. Psychol Methods 2000;5(1):44–63. PubMed PMID: 10937322. [DOI] [PubMed] [Google Scholar]
- 27.Mustanski B, Swann G, Newcomb ME, Prachand N. Effects of parental monitoring and knowledge on substance use and HIV risk behaviors among young men who have sex with men: Results from three studies. AIDS Behav 2017;21(7):2046–58. Epub 2017/04/19. doi: 10.1007/s10461-017-1761-2. PubMed PMID: 28417252. [DOI] [PMC free article] [PubMed] [Google Scholar]
- 28.Newcomb ME, Moran K, Feinstein BA, Forscher E, Mustanski B. Pre-Exposure Prophylaxis (PrEP) Use and Condomless Anal Sex: Evidence of Risk Compensation in a Cohort of Young Men Who Have Sex with Men. J Acquir Immune Defic Syndr 2017. Epub 2017/12/07. doi: 10.1097/QAI.0000000000001604. PubMed PMID: 29210834. [DOI] [PMC free article] [PubMed] [Google Scholar]
- 29.Innovacon Inc. Drugs of Abuse: One Step Drug Screen Test Card: Instruction sheet for single and multi drug screen test cards for any combinatino of the following drugs: AMP/BAR/BZO/COC/THC/MTD/mAMP/MDMA/MOP/OPI/OXY/PCP/PPX/TCA San Diego, CA: CLIAwaived.com; n.d. [Google Scholar]
- 30.Substance Abuse and Mental Health Services Administration. Clinical drug testing in primary care. 32 ed. Rockville, MD: Substance Abuse and Mental Health Services Administration; 2012. [Google Scholar]
- 31.Montiel LM, Nathan RP, Wright DJ. An update on urban hardship Albany, NY: Nelson A. Rockefeller Institute of Government, State University of New York, 2004. [Google Scholar]
- 32.Nathan RP, Adams CF. Four perspectives on urban hardship. Political Science Quarterly 1989;104(3):483–508. doi: 10.2307/2151275. [Google Scholar]
- 33.Li DH, Mustanski B. Prevalence and Correlates of Prescription Drug Misuse Among a Racially Diverse Sample of Young Sexual Minority Men. LGBT Health 2018. doi: 10.1089/lgbt.2017.0125. PubMed PMID: 29360421. [DOI] [PMC free article] [PubMed] [Google Scholar]
- 34.National Center on Addiction and Substance Abuse at Columbia University. Criminal neglect: Substance abuse, juvenile justice and the children left behind New York, NY: Columbia University, 2004. October 2004. Report No. [Google Scholar]
- 35.Light RJ. Measures of Response Agreement for Qualitative Data - Some Generalizations and Alternatives. Psychol Bull 1971;76(5):365–77. doi: DOI 10.1037/h0031643. PubMed PMID: WOS:A1971Y129400005. [Google Scholar]
- 36.Broemeling LD. Bayesian Methods for Measures of Agreement. Bayesian Methods for Measures of Agreement 2009;29:1–332. doi: 10.1201/9781420083439. PubMed PMID: WOS:000267391300010. [Google Scholar]
- 37.Rossiter DG. Technical note: Statistical methods for accuracy assesment of classified Enschede, Netherlands: University of Twente, 2014. [Google Scholar]
- 38.Ballinger GA. Using generalized estimating equations for longitudinal data anlysis. Organizational Research Methods 2004;7(2):127–50. doi: 10.1177/1094428104263672. [Google Scholar]
- 39.Landis JR, Koch GG. The measurement of observer agreement for categorical data. Biometrics 1977;33(1):159–74. PubMed PMID: 843571. [PubMed] [Google Scholar]
- 40.Kipke MD, Weiss G, Ramirez M, Dorey F, Ritt-Olson A, Iverson E, Ford W. Club drug use in los angeles among young men who have sex with men. Subst Use Misuse 2007;42(11):1723–43. PubMed PMID: 17934992. [DOI] [PMC free article] [PubMed] [Google Scholar]
- 41.Freeman P, Walker BC, Harris DR, Garofalo R, Willard N, Ellen JM. Methamphetamine Use and Risk for HIV Among Young Men Who Have Sex With Men in 8 US Cities. Arch Pediatr Adolesc Med 2011;165(8):736–40. Epub 2011/08/04. doi: 10.1001/archpediatrics.2011.118. PubMed PMID: 21810635. [DOI] [PMC free article] [PubMed] [Google Scholar]
- 42.Thiede H, Valleroy LA, MacKellar DA, Celentano DD, Ford WL, Hagan H, Koblin BA, LaLota M, McFarland W, Shehan DA, Torian LV. Regional patterns and correlates of substance use among young men who have sex with men in 7 US urban areas. Am J Public Health 2003;93(11):1915–21. PubMed PMID: 14600066. [DOI] [PMC free article] [PubMed] [Google Scholar]
- 43.Clatts MC, Goldsamt L, Yi H, Gwadz MV. Homelessness and drug abuse among young men who have sex with men in New York city: a preliminary epidemiological trajectory. J Adolesc 2005;28(2):201–14. doi: 10.1016/j.adolescence.2005.02.003. PubMed PMID: 15878043; PMCID: PMC2755549. [DOI] [PMC free article] [PubMed] [Google Scholar]
- 44.Schulenberg JE, Johnston LD, O’Malley PM, Bachman JG, Miech RA, Patrick ME. Monitoring the Future national survey results on drug use, 1975–2016: Volume II, college students & adults ages 19–55 Ann Arbor, MI: Institute for Social Research, The University of Michigan, 2017. [Google Scholar]
- 45.Kubicek K, McDavitt B, Carpineto J, Weiss G, Iverson EF, Kipke MD. Making Informed Decisions: How Attitudes and Perceptions Affect the Use of Crystal, Cocaine and Ecstasy among Young Men who Have Sex with Men. J Drug Issues 2007;37(3):643–74. Epub 2008/10/15. PubMed PMID: 18852843; PMCID: PMC2565571. [DOI] [PMC free article] [PubMed] [Google Scholar]
- 46.Gray TA, Wish ED. Substance Abuse Need for Treatment among Arrestees (SANTA) in Maryland College Park, MD: University of Maryland, Center for Substance Abuse Research, 1998. [Google Scholar]
- 47.Murphy DA, Durako S, Muenz LR, Wilson CM. Marijuana use among HIV-positive and high-risk adolescents: a comparison of self-report through audio computer-assisted self-administered interviewing and urinalysis. Am J Epidemiol 2000;152(9):805–13. PubMed PMID: 11085391. [DOI] [PubMed] [Google Scholar]
- 48.Tourangeau R, Yan T. Sensitive questions in surveys. Psychol Bull 2007;133(5):859–83. Epub 2007/08/29. doi: 2007–12463-007 [pii] 10.1037/0033–2909.133.5.859. PubMed PMID: 17723033. [DOI] [PubMed] [Google Scholar]
- 49.Harrison L The validity of self-reported drug use in survey research: An overview and critique of research methods. In: Harrison L, Hughes A, editors. The Validity of Self-Reported Drug Use: Improving the Accuracy of Survey Estimates Rockville, MD: National Institute on Drug Abuse; 1997. p. 17–36. [PubMed] [Google Scholar]
- 50.Johnston LD, O’Malley PM, Bachman JG, Schulenberg JE, Miech RA. Monitoring the Future national survey results on drug use, 1975–2015: Volume II, college students & adults ages 19–55 Ann Arbor, MI: Institute for Social Research, The University of Michigan, 2016. [Google Scholar]
- 51.Cannabis Control Act, Illinois State Senate, 99th General Assembly Sess. (2016).
- 52.Buchan BJ M LD, Tims FM, Diamond GS Cannabis use: consistency and validity of self-report, on-site urine testing and laboratory testing. Addiction 2002;97 Suppl 1:98–108. PubMed PMID: 12460132. [DOI] [PubMed] [Google Scholar]
- 53.Medical Disposables Corp. How long does marijuana stay in your system? Drug detection periods in drug tests 2017. Available from: http://www.medicaldisposables.us/Drug_Detection_Periods_s/1835.htm.
- 54.Dillon FR, Turner CW, Robbins MS, Szapocznik J. Concordance among biological, interview, and self-report measures of drug use among African American and Hispanic adolescents referred for drug abuse treatment. Psychol Addict Behav 2005;19(4):404–13. doi: 10.1037/0893-164X.19.4.404. PubMed PMID: 16366812; PMCID: PMC1488879. [DOI] [PMC free article] [PubMed] [Google Scholar]
- 55.Heath J, Lanoye A, Maisto SA. The role of alcohol and substance use in risky sexual behavior among older men who have sex with men: a review and critique of the current literature. AIDS Behav 2012;16(3):578–89. doi: 10.1007/s10461-011-9921-2. PubMed PMID: 21390534; PMCID: 3743230. [DOI] [PMC free article] [PubMed] [Google Scholar]
- 56.Kim JY, Fendrich M, Wislar JS. The validity of juvenile arrestees’ drug use reporting: A gender comparison. Journal of Research in Crime and Delinquency 2000;37(4):419–32. doi: Doi10.1177/0022427800037004004. PubMed PMID: WOS:000089705700004. [Google Scholar]
- 57.White Hughto JM, Reisner SL, Pachankis JE. Transgender stigma and health: A critical review of stigma determinants, mechanisms, and interventions. Soc Sci Med 2015;147:222–31. doi: 10.1016/j.socscimed.2015.11.010. PubMed PMID: 26599625; PMCID: PMC4689648. [DOI] [PMC free article] [PubMed] [Google Scholar]
- 58.Feucht TE, Stephens RC, Walker ML. Drug-Use among Juvenile Arrestees - a Comparison of Self-Report, Urinalysis and Hair Assay. J Drug Iss 1994;24(1–2):99–116. doi: Doi 10.1177/002204269402400106. PubMed PMID: WOS:A1994MV43600006. [Google Scholar]
- 59.Mieczkowski T, Newel R, Wraight B. Using hair analysis, urinalysis, and self-reports to estimate drug use in a sample of detained juveniles. Subst Use Misuse 1998;33(7):1547–67. doi: Doi10.3109/10826089809069812. PubMed PMID: WOS:000074351700006. [DOI] [PubMed] [Google Scholar]
- 60.Newcomb ME, Swann G, Mohr D, Mustanski B. Do Diary Studies Cause Behavior Change? An Examination of Reactivity in Sexual Risk and Substance Use in Young Men Who Have Sex with Men. AIDS Behav 2018. Epub 2018/01/15. doi: 10.1007/s10461-018-2027-3. PubMed PMID: 29332235. [DOI] [PMC free article] [PubMed] [Google Scholar]
- 61.Amlani A, McKee G, Khamis N, Raghukumar G, Tsang E, Buxton JA. Why the FUSS (Fentanyl Urine Screen Study)? A cross-sectional survey to characterize an emerging threat to people who use drugs in British Columbia, Canada. Harm Reduct J 2015;12:54 Epub 2015/11/19. doi: 10.1186/s12954-015-0088-4. PubMed PMID: 26577516; PMCID: PMC4650899. [DOI] [PMC free article] [PubMed] [Google Scholar]
- 62.Hayashi K, Milloy MJ, Lysyshyn M, DeBeck K, Nosova E, Wood E, Kerr T. Substance use patterns associated with recent exposure to fentanyl among people who inject drugs in Vancouver, Canada: A cross-sectional urine toxicology screening study. Drug Alcohol Depend 2018;183:1–6. doi: 10.1016/j.drugalcdep.2017.10.020. PubMed PMID: WOS:000424725000001. [DOI] [PMC free article] [PubMed] [Google Scholar]