

Supplemental digital content is available in the text.
Key Words: multidetector computed tomography, spectral CT, dual-contrast imaging, K-edge imaging, photon-counting detectors, peritoneal imaging
Abstract
Objectives
To validate in vitro the capability of a high-spatial-resolution prototype spectral photon-counting computed tomography (SPCCT) scanner to differentiate between 2 contrast agents and to assess in vivo the image quality and the feasibility to image the peritoneal cavity in rats using the 2 contrast agents simultaneously within the vascular and peritoneal compartments.
Materials and Methods
The authors performed SPCCT imaging (100 mAs, 120 kVp) with energy bin thresholds set to 30, 51, 64, 72, and 85 keV in vitro on a custom-made polyoxymethylene cylindrical phantom consisting of tubes with dilutions of both contrast agents and in vivo on 2 groups of adult rats using 2 injection protocols. Approval from the institutional animal ethics committee was obtained. One group received macrocylic gadolinium chelate intraperitoneal (IP) and iodine intravenous (IV) injections (protocol A, n = 3), whereas the second group received iodine IP and gadolinium IV (protocol B, n = 3). Helical scans were performed 35 minutes after IP injection and 20 seconds after IV injection. The SPCCT and contrast material images, that is, iodine and gadolinium maps, were reconstructed with a field of view of 160 mm, an isotropic voxel size of 250 μm, and a matrix size of 640 × 640 pixels using a soft reconstruction kernel. The SPCCT images were reconstructed with 2 different spatial resolutions to compare the image quality (sharpness, diagnostic quality, and organ visualization) of SPCCT (250 μm) with single-energy computed tomography (CT) (600 μm). Two radiologists evaluated the peritoneal opacification index in 13 regions (score = 0–3 per region) on each type of image. Concentrations of contrast agents were measured in the organs of interest.
Results
In vitro, the concentration measurements correlated well with the expected concentrations. The linear regressions both had R2 values of 0.99, slopes of 0.84 and 0.87, and offsets at −0.52 and −0.38 mg/mL for iodine and gadolinium, respectively. In vivo, the SPCCT images were of better diagnostic quality, with increased sharpness compared with the CT-like images (P < 0.0001). Intraperitoneal diffusion was excellent, with similar peritoneal opacification index on SPCCT images and overlay of contrast material maps (P = 1) without a significant difference between protocol A (37.0 ± 1.7) and protocol B (35.3 ± 1.5) (P = 0.34). Only the contrast material maps demonstrated clear visual separation of the contrast agents, allowing specific quantification of the physiological enhancement in the liver, spleen, and kidney and the urinary clearance in the renal pelvis and bladder. Renal excretion of the contrast agents injected IP was observed and was consistent with blood diffusion.
Conclusions
Spectral photon-counting CT can be used to perform a complete peritoneal dual-contrast protocol, enabling a good assessment of the peritoneal cavity and abdominal organs in rats.
Spectral photon-counting computed tomography (SPCCT) technology is emerging as a new and promising imaging modality in the field of computed tomography (CT) x-ray imaging, owing to its energy resolving detectors, known as photon counting detectors.1–4 They allow the analysis of the energy of each photon of the transmitted spectrum, with the capability of dividing them between multiple energy windows, leading to improved information on the interaction between the x-ray beam and the matter. One of the main advantages of SPCCT is the possibility to map K-edge materials by using specific reconstructed images. This approach, called K-edge imaging, is based on the detection of the strong attenuation variation owing to the photoelectric effect at the specific binding energy of the K shell electron of an atom.1,4–6 This feature provides specific information on elements that have a K-edge in the energy range of clinical imaging where there is high photon flux (≈40–100 keV), such as gadolinium (50.2 keV).7,8 Therefore, SPCCT systems can differentiate 2 contrast agents in the same compartment, as demonstrated in animal models by Symons et al9 via intravenous (IV) use of gadolinium and iodine based contrast agents and abdominal imaging or by Cormode et al10 with the IV use of gold nanoparticles and an iodine-based contrast agent and kidney imaging. In addition, K-edge imaging allows measuring the absolute concentration of the targeted material used, as demonstrated by Dangelmaier et al,11 de Vries et al,5 and Si-mohamed et al12 with the use of gadolinium, iodine, and gold nanoparticle-based contrast agents, respectively. Indeed, photon-counting detectors (PCDs) allow an exact physical representation of pixel values, with quantitative information processed by the SPCCT system from the spectrum transmitted through the subject.2 Moreover, PCDs have higher spatial resolution that allows differentiation of smaller structures, such as parenchymal arteries, or very small lesions with a size below the detection limit of standard CT.2,13
Peritoneal imaging is crucial for the evaluation of invasive tumors that can spread to the peritoneal cavity, such as ovarian, colorectal, gastric, appendix tumors, or primary peritoneal tumors such as mesothelioma.14 Delay in diagnosis with high tumoral volume of synchronous or metachronous peritoneal metastases (PMs) may alter the surgical treatment management, resulting in a poor prognosis.15 Indeed, survival of patients with PM has been dramatically improved, thanks to the development of surgical curative intent procedures with cytoreductive surgery that aim to perform a complete visual removal of all lesions, completed by hyperthermic intraperitoneal (IP) chemotherapy to treat residual microscopic disease.16–18 Such procedures are very demanding, with high potential for morbidity, and therefore require careful selection of patients via accurate preoperative quantitative and qualitative cartography of PM to identify the tumor volume and distribution, as well as potentially unresectable lesions.19,20 In oncological clinical practice, CT is the first-line examination, but magnetic resonance imaging (MRI) and positron emission tomography-CT are also routinely performed to complete the PM staging.21–23 Unfortunately, each technique has some intrinsic limitations, such as low contrast resolution for CT and low spatial resolution for MRI and positron emission tomography-CT, resulting in a consistent underestimation of the PM spread mostly because of false-negatives of thin or small lesions less than 1 cm.24–28 In addition, none of these 3 techniques allows spectral capabilities such as differentiation of 2 contrast agents.
Over the past 10 years, dual-energy CT approaches have been developed, presenting the capability of base material decomposition. However, dual-energy CT cannot use the K-edge effect described previously, which allows specific discrimination of a K-edge contrast agent such as gadolinium from another contrast agent. Hence, it seems that SPCCT has promise to address the limitations mentioned above, owing to its increased spatial resolution, as well as contrast resolution, thanks to specific material discrimination with all the advantages of x-ray imaging, that is, rapid image acquisition, large volume coverage, and convenience. These advantages would be suitable for a complete exploration of the peritoneal cavity and organ using a dual-contrast imaging protocol targeted to 2 different compartments, for example, the peritoneal cavity and abdominal and pelvic organs.
The purpose of this study was to validate in vitro the capability of a high-spatial-resolution prototype SPCCT scanner to differentiate between 2 contrast agents and to assess in vivo the image quality and the feasibility to image the peritoneal cavity in rats using the 2 contrast agents simultaneously within the vascular and peritoneal compartments.
MATERIALS AND METHODS
Spectral Photon-Counting Computed Tomography
An SPCCT prototype system (Philips Healthcare, Haifa, Israel) was used for this study. It is a modified base clinical system equipped with a conventional x-ray tube that can be set with a tube voltage at 80, 100, or 120 kVp and tube current values between 10 and 100 mA. The filters between the tube and the subject absorb low-energy x-ray so the subject is exposed to a spectrum that ranges from 30 to 120 keV. The focal spot is 0.6 × 0.7 mm in size. The in-plane resolutions that were determined from the modulation transfer function (MTF) are 11.4 lp/cm at 50% MTF and 22.4 lp/cm at 10% MTF, at a distance of 15 mm to the rotation center. The MTFs were determined using the approach reported by Yu et al.29 The system is based on hybrid photon counting detectors of 2-mm-thick cadmium zinc telluride with a pixel pitch of 500 μm × 500 μm, ChromAIX2 application-specific integrated circuits combined with cadmiun zinc telluride as sensor material, and operates in single photon-counting mode with energy discrimination.30–32 The PCD allows up to 5 consecutive energy bins between 30 and 120 keV. The scan field of view is 168 mm in-plane, with a z-coverage of 2.5 mm in the scanner isocenter. Axial and helical scans over 360° are performed at 100 mA tube current and 120 kVp tube voltage with a scanner rotation time of 1 second and 2400 projections per rotation.
For the scans of the iodine and gadolinium contrast agents, energy thresholds are set to differentiate their attenuation profiles and to coincide with the K-edge of gadolinium at 50.2 keV (30, 51, 64, 72, and 85 keV).33 Of note, thresholds were not placed to coincide with the K-edge of iodine. This is because there are too few photons between the start of the spectrum at 30 keV and iodine's K-edge energy (33.2 keV) to yield data of useful quality.34 Such an approach would likely be used for most clinical-scale photon-counting CT systems, because transmitted spectra almost always have few photons at 33.2 keV and a large number at 50.2 keV.
Phantom Preparation
For the purpose of evaluating in vitro, the capability of the SPCCT system to differentiate between the contrast agents, a phantom imaging study was performed. A custom-made polyoxymethylene cylindrical phantom with a diameter of 13 cm and 10 holes of 1.5 cm in diameter was used. Samples were loaded into the phantom using 1.5-mL polypropylene centrifuge tubes (Dominique Dutscher SAS, Brumath, France). A set of 10 tubes was prepared, consisting of contrast agents of a wide range of concentrations and diluted in phosphate buffered saline (PBS),9,12 a tube of calcium phosphate (used as a bone simulant), and one of PBS. The contrast agents were gadolinium (Dotarem [gadoterate meglumine], 0.5 mmol/mL; Guerbet, Villepinte, France) and iodine (Xenetix [iobitridol], 350 mg/mL; Guerbet, Aulnay-sous-Bois, France) at concentrations of 2, 5, 8, and 12 mg/mL. The concentration ranges for the 2 clinically available contrast agents was based on current practice.
Animal Preparation
Approval from the animal ethics committee was obtained before the start of this study. Two groups of 3 Sprague-Dawley adult rats (Charles River, France; 14–16 weeks old; 510 ± 64 g [mean ± SD]) were used for the experiments. Animals were housed in a colony room with a 12/12-hour light/dark cycle; temperature range was set between 20°C and 24°C. An acclimation period of 7 full days was respected before the first experiment. An infrared lamp was used as an artificial heat source to keep the rat warm. Rats were monitored with a pulse oximeter and a heart rate sensor during anesthesia and blood glucose level was also checked both before glucagon injection and after the experiment. The first group of rats was imaged with IP gadolinium and IV iodine (protocol A, n = 3). The second group was imaged with IP iodine and IV gadolinium (protocol B, n = 3). The 2 contrast agents used were a macrocyclic gadolinium chelate (Dotarem [gadoterate meglumine], 0.5 mmol/mL; Guerbet, Villepinte, France) 5 mL/kg for IV injections and 18 mL/kg of a 20% dilute solution for IP injections, iodine (Xenetix [iobitridol], 350 mg/mL; Guerbet, Aulnay-sous-Bois, France) 2.1 ml/kg for IV injections, and 18 mL/kg of a 5% solution diluted with PBS for IP injections. The IP injections were of lower concentrations because of the lack of dilution through the pulmonary vasculature.
Animals were fasted for 3 hours and then gavage-fed with a hyperosmolar agent (2.5 mL of 20% mannitol; B-Braun Medical, Boulogne-Biliancourt, France) commonly used for CT or magnetic resonance enterography to minimize peristaltism and enhance small bowel analysis.35 During preparation and acquisitions, rats were anaesthetized with isoflurane (4% for induction, 1.5-2.5% for maintenance) in oxygen (1.5 L/min for induction, 0.6 L/min for maintenance). A tail vein (22 G catheter) and an IP (20 G catheter) were inserted for contrast injections. Pulling the skin, the peritoneum was accessed in the right iliac fossa to avoid the caecum and the abdominal organs. The IP catheter was removed after injection. A bed was fabricated via 3-dimensional printing that allowed the rat to be positioned ventrally during the imaging session to reduce motion artifacts caused by respiration and bowel peristalsis. In addition, a polymethyl methacrylate custom-made cylindrical holder with 160 mm outer diameter and 70 mm inner diameter surrounded the rats, to create similar attenuation to the in vitro study. An IV injection of an antiperistaltic (0.1 mL of GlucaGen [glucagon], 1 mg/mL; Novo Nordisk, Chartres, France) was performed before the acquisition to reduce bowel peristalsis. Additional details of the animal care and imaging protocol are provided as Supplemental Digital Content, http://links.lww.com/RLI/A383.
Image Acquisition and Reconstruction
The z-coverage length acquisition was evaluated using anatomical marks for imaging the abdomen and pelvic areas. First, 6 axial slices of 2-mm z-coverage were performed to confirm successful IP injection and to localize the organs of interest (liver, spleen, kidney, and bladder). Thirty-five minutes were allowed to elapse before performing the IV injection, to allow the IP agent to fully diffuse through the cavity. This acquisition therefore captures the early IV and IP phase. In addition, the same 6 axial slices that were imaged earlier were again imaged 3 minutes after IV injection, representing the late IV and IP phase, over the organs of interest. The timeline for the in vivo experiment is shown in Figure 1. After the completion of the experiment, the rats showed no adverse effects from the procedure.
FIGURE 1.
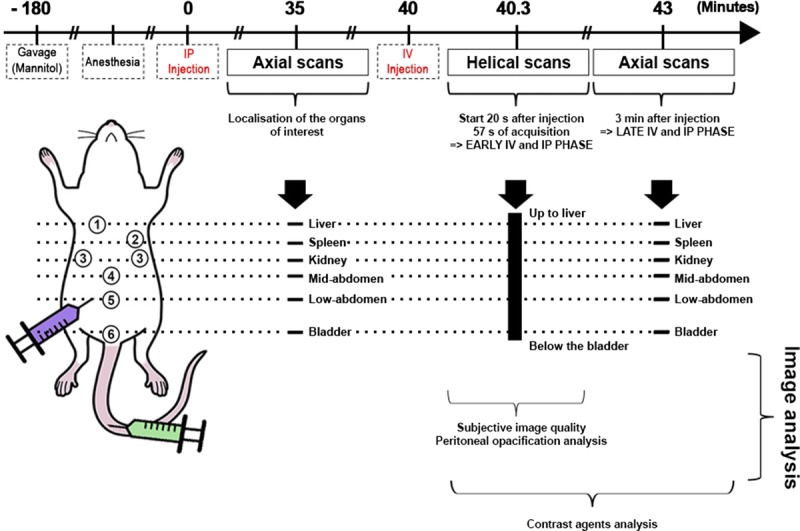
Timeline of the in vivo imaging protocol.
The SPCCT images and contrast material images, that is, iodine, water, and gadolinium maps, were reconstructed with a field of view of 160 mm, an isotropic voxel size of 250 μm, and a matrix size of 640 × 640 pixels using a soft reconstruction kernel. For each pixel, a maximum likelihood estimator was used to derive an equivalent water-thickness per pixel from the photon counts in the 5 energy bins. Synthetic SPCCT images were then reconstructed from the water-thickness equivalent sinograms using a filtered back-projection algorithm. The SPCCT images are generated by best fit of the measured count rates to calibration data based on a phantom with various path lengths. Contrast material maps are based on projection space decomposition per detector. Their solutions are based on maximum likelihood of forward projection models using literature data of the attenuations of the target materials. For example, for water, iodine, and gadolinium, the forward model includes the tube spectrum; the attenuation through path lengths of LW, LIo, and LGd of water, iodine, and gadolinium, respectively; and the detector response. A maximum likelihood function is used to properly take into account the quantum Poisson noise that impacts the different energy bins.8,32 Filtered back-projection reconstructions were used without further postprocessing apart from deringing, as well as smoothing of the contrast material images with a Gaussian kernel of 2-pixel width that would decrease the noise (standard deviation of the mean) by a factor between 2 and 4 without significantly changing the mean values. Overlay images of the SPCCT and contrast material maps images were formed using Image J software.36 To evaluate the added value of the SPCCT system in image quality compared with single-energy CT images, we performed a second reconstruction of the SPCCT images with a similar voxel size as with a standard CT system to obtain so-called CT-like images, that is, with isotropic voxels of 600 μm, resulting in a matrix size of 266 × 266.24
In Vitro Image Analysis
Image analysis was performed using Image J software. Circular regions of interest (ROIs) were manually placed in the middle of each tube on SPCCT images. The same ROIs were used on the contrast material images generated and mean concentrations were measured for each ROI. Linear regression was used to assess the correlation between the measured and the expected concentrations.
In Vivo Image Analysis
Subjective Image Quality Analysis of SPCCT Versus CT-Like Images
The subjective image quality of the SPCCT and CT-like images was rated independently by 3 radiologists who were blinded in regards to the spatial resolution chosen, 2 being experienced in SPCCT imaging (SSM, AT, 8 and 3 years of experience in abdominal imaging, respectively) and 1 without any experience in SPCCT imaging (PR), 14 years of experience in abdominal imaging). The dataset with images from helical acquisitions (the early IV and IP phase) was prepared a month before the analysis by the senior radiologist experienced in SPCCT imaging (SSM) and included 5 slices for each rat that were chosen for the visualization of small structures at the abdominopelvic levels, that is, the portal vein, the mesenteric vessels, the ureters, the wall of the last ileal loop, and the pouch of Douglas. The analysis was based on a 4-point Likert-scale37 (1: poor, 2: acceptable, 3: good, 4: excellent) for image noise defined by the grainy appearance of images (poor being when the image noise altered the identification of normal and/or abnormal structures), image sharpness (poor being when image sharpness altered the identification of borders of structures), diagnostic quality (poor being when diagnosis evaluation is not possible). An additional subjective analysis based on score of image criteria38 (1: visualization just possible, 2: unsharp borders but different structures already visible, 3: very good visualization, well-defined anatomy, 4: perfect delineation well-defined anatomy) was performed for identification of the aforementioned 5 small structures.
Image Analysis for the 2 Injection Protocols
Peritoneal Opacification Analysis
The SPCCT images and contrast material maps overlay images reconstructed from the helical acquisitions (early IV and IP phase) were analyzed by 2 radiologists PR, AT, 14 and 3 years of experience in abdominal imaging, respectively) in consensus using a standardized grid based on a modified peritoneal cancer index of the Sugarbaker model for animal experiments to evaluate the peritoneal opacification throughout the 13 regions from 0 to 3, depending on the degree of opacification (0 = none; 1 = few; 2 = correct; 3 = good), producing a peritoneal opacification index (POI) rating from 0 to 39 (Fig. 2).39 In this procedure, regions 10 (the distal portion of the jejunum) and 11 (the proximal portion of the ileum) were rated the same score, owing to the difficulty of differentiating between them.
FIGURE 2.
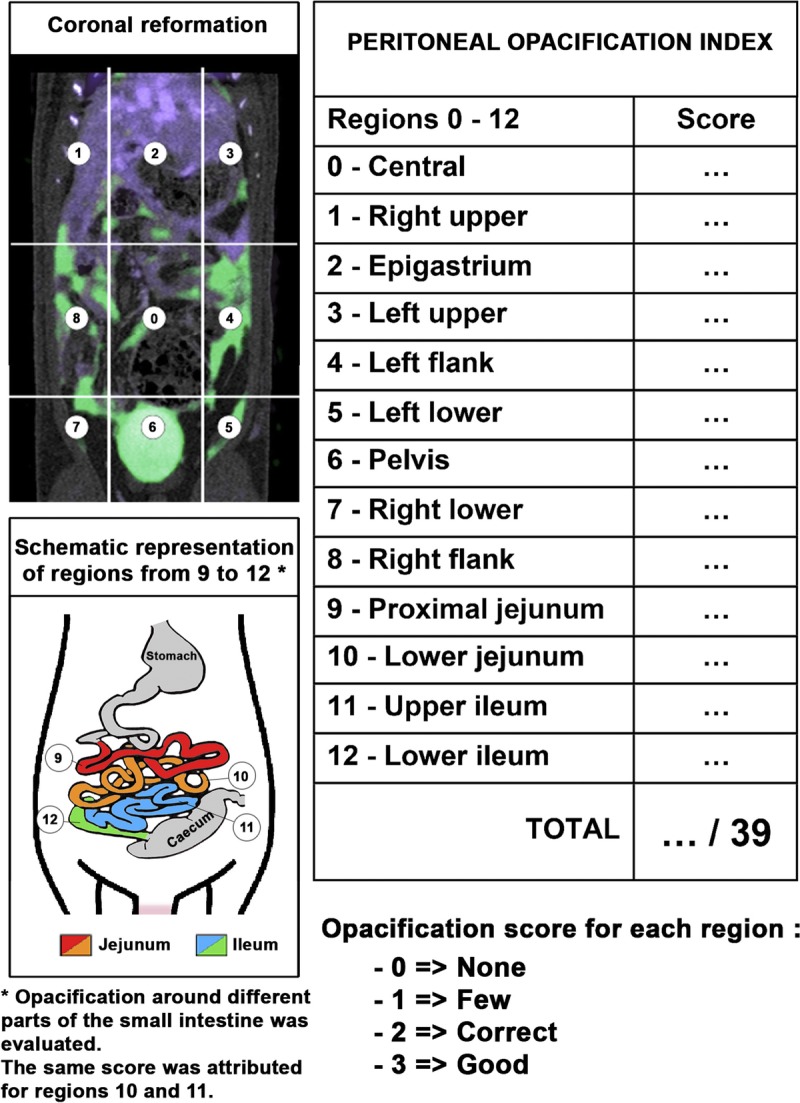
Schematic representation of the POI.
Contrast Agents Analysis
Iodine and gadolinium concentrations in the organs of interest (liver, spleen, kidney, renal pelvis, and bladder) and in the peritoneal cavity were obtained by manually drawing ROIs of at least 50 pixels by using Image J software for each rat on helical scans (early IV and IP phase) and the second axial scans (late IV and IP phase). The ROIs were defined on SPCCT images before retrieval of the gadolinium and iodine concentrations per organ to avoid operator bias. After obtaining the concentrations, no adjustments of the ROIs were made. The ROIs were manually placed by a senior radiologist (SSM, 8 years of experience) in the organs of interest and were automatically copied onto the contrast material maps by the image analysis software. The data obtained are the absolute mean concentration of gadolinium and iodine in mg/mL (mean ± standard deviation).
Contrast-to-noise ratios (CNRs) among the 3 rats in each protocol were measured by manually drawing the ROIs of at least 50 pixels on the SPCCT images within the peritoneal cavity, the bone, and a representative abdominal organ such as the kidney. The ROIs were then automatically copied-pasted on the contrast material maps that were smoothed with a Gaussian kernel of 2 pixel width. The CNR were then calculated as follows:
Formula.
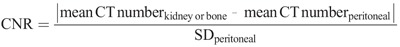
The choice of analyzing the kidney cortex was made because it does not suffer from bowel or respiratory motion artifacts owing to its retroperitoneal localization and because it has a simpler model of enhancement compared with either the liver, which has a complex double vascularisation (portal and arterial), or the spleen, which has a terminal capillary vascularization.40 The choice of analyzing the bone was made to investigate the specificity of the gadolinium images versus the iodine images.
Statistical Analysis
Statistical analysis was performed using the software StataSE (StataCorp, 2011, Stata Statistical Software: Release 12, StataCorp LP, College Station, TX). To evaluate differences in POI between the 2 protocols and differences in ordinal qualitative data of the image quality analysis between the images with different spatial resolutions, the Wilcoxon signed-rank test for paired samples was applied. A P value < 0.05 was considered statistically significant. The interrater reliability between the senior radiologist experienced in SPCCT imaging and the 2 other radiologists was calculated by the linearly weighted Cohen κ values (poor, κ = 0.00–0.20; fair, κ = 0.21–0.40; moderate, κ = 0.41–0.60; good, κ = 0.61–0.80; or excellent, κ = 0.81–1.00).41
RESULTS
In Vitro Imaging
As expected from the experimental design, the solutions of contrast agents could not be differentiated on SPCCT images without previous knowledge, revealing higher attenuation for the tubes containing higher concentrations of contrast media and for the calcium phosphate tubes. However, we found that gadolinium and iodine contrast agents were accurately separated from each other in their respective material images (Fig. 3A). In addition, a strong signal arising from the calcium phosphate tube was observed in the iodine map, but not in the gadolinium map. No signal of the polyoxymethylene phantom or tubes was found in these images, but signal from these objects was observed in the water images because of their composition, having an effective atomic number slightly below that of water. We observed a linear correlation between the signal in the contrast material maps and contrast agent concentration with good accuracy (all R2 values = 0.99) (Fig. 3B).
FIGURE 3.
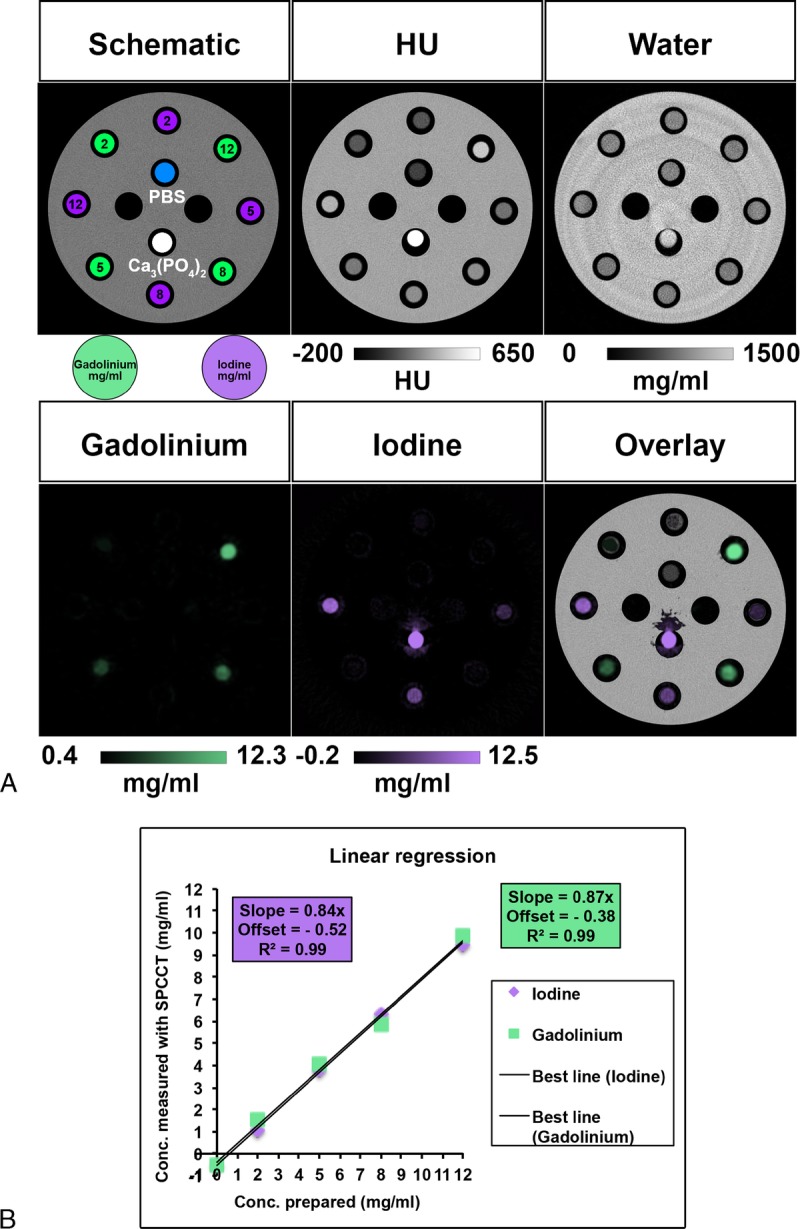
A, Schematic drawing, SPCCT images and contrast material maps (water, gadolinium, and iodine maps) of the phantom containing tubes with increasing concentrations of contrast agents (2, 5, 8, and 12 mg/mL), with calcium phosphate and PBS tubes. B, Comparison of actual and SPCCT measured contrast agent concentrations, showing a linear correlation.
In Vivo Imaging
Subjective Image Quality Analysis of SPCCT Versus CT-Like Images
Given the ability of the SPCCT system to distinguish the contrast agents in the phantom, we then performed in vivo experiments with rats. On SPCCT images acquired 20 seconds after IV injection of contrast agent, with both protocols, organs and vessels were well delineated (Fig. 4). Small to very small structures were also observable all along their way, such as the mesenteric vessels, the hepatic veins, as well as the retroperitoneal space with the urinary tract.
FIGURE 4.
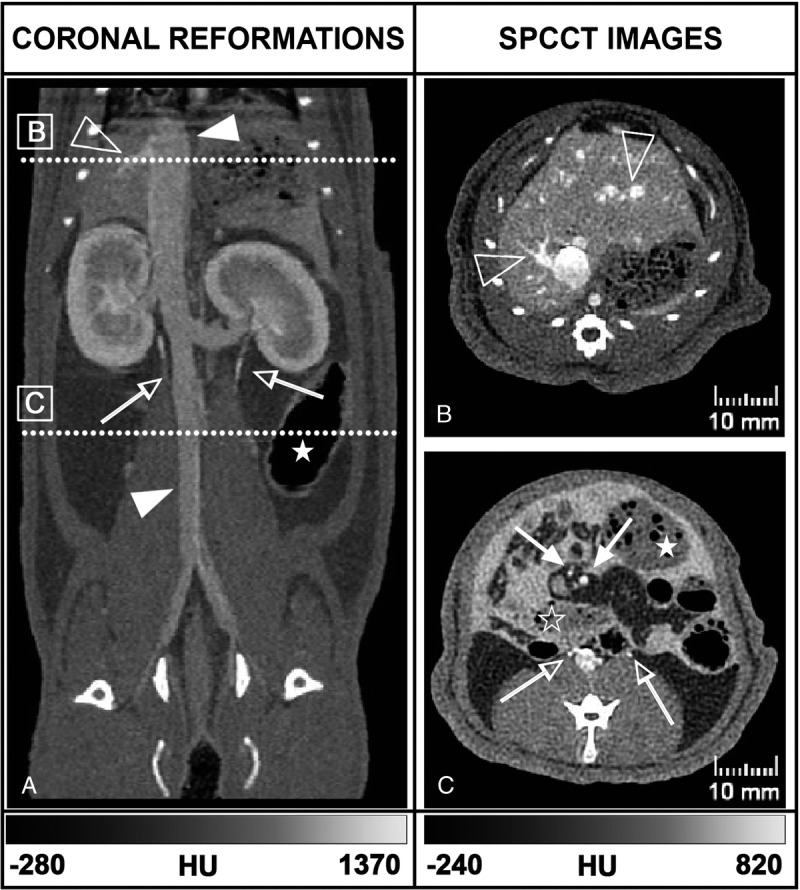
Coronal (A) and axial (B, C) SPCCT images of a rat from the injection protocol B show exploration of the abdominal organs and vessels (full arrowhead: inferior vena cava, empty arrowhead: right hepatic veins, full arrow: mesenteric vessels), the digestive tract (empty star: small bowel, full star: large bowel), the urinary tract (empty arrow: ureters) and the opacified peritoneal cavity with hyperdense content surrounding the abdominal structures. The positions of panels B and C are denoted on panel A by the annotated white dotted lines.
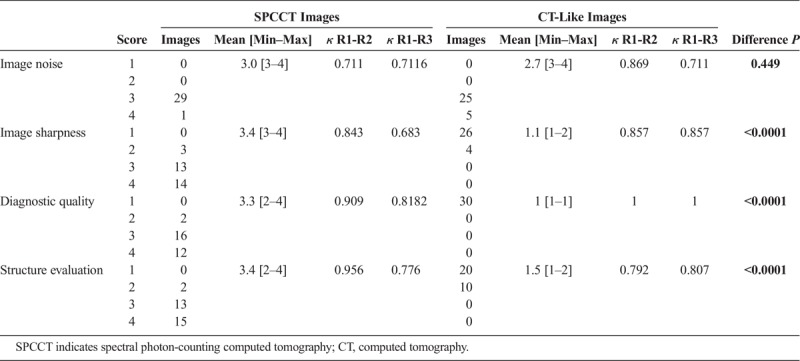
The SPCCT images were of better diagnostic quality, with increased sharpness compared with CT-like images (Fig. 5 and Table 1). The image sharpness, diagnostic quality, and organs of interest were given low scores for the CT-like images of 1.1 [1–2], 1 [1–1], and 1.5 [1–2] respectively, compared with high scores for the SPCCT images (3.4 [3–4], 3.3 [2–4], and 3.4 [2–4], respectively) (all P values < 0.0001). The image noise was not statistically significantly different between both protocols, with very good scores for both images (2.7 [3–4] vs. 3.0 [3–4] for CT-like and SPCCT images, P = 0.449). The interrater reliabilities were all scored at good or excellent, with κ > 0.6.
FIGURE 5.
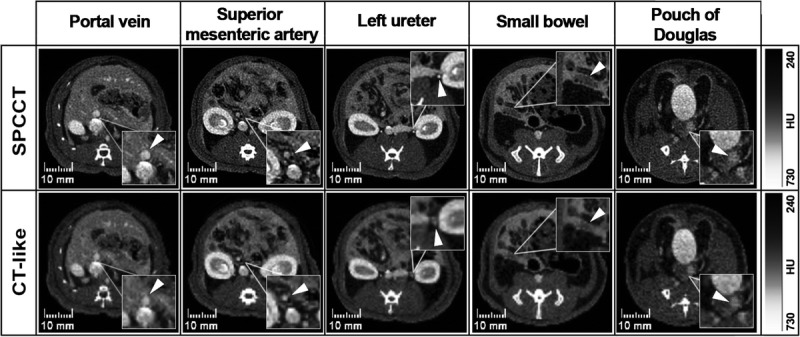
Comparison between 2 different pixel sizes reconstructions of the SPCCT images, that is, the photon-counting CT (250 μm) and single energy CT-like (600 μm). Images displayed are (from left to right) at the level of the portal vein, mesenteric vessels, ureters, wall of the last ileal loop, and pouch of Douglas. Magnification boxes highlight the structures listed in the headings (arrowheads).
TABLE 1.
Values of Ratings Over All Examined Regions Reported Separately for the Senior Radiologist (R1) Experienced in SPCCT Imaging, With Mean [Min–Max] Values, κ Values of the Interrater Reliability Between R1 and the Junior Radiologist Experienced in SPCCT Imaging (R2) and the Senior Radiologist Not Experienced in SPCCT Imaging (R3), and P Values of the Difference of the SPCCT and CT-Like Values
Imaging Analysis for the 2 Protocols of Injection
Peritoneal Opacification Analysis
Peritoneal opacification was observed in all the 6 rats with high POI of 37.0 ± 1.7 and 35.3 ± 1.5 on protocol A and B, respectively, without any significant difference (P = 0.34). Intraperitoneal diffusion detection of both contrast agents on the overlay of contrast material maps was similar compared with SPCCT images with the same POI (P = 1) (Fig. 6). All regions were opacified, with no scores of 0. Almost all the regions were scored 3, except the sub-diaphragmatic areas (area 1, 2, and 3) in both protocols that were scored from 1.7 ± 0.6 [1–2] to 2.7 ± 0.6 [2–3]. The peritoneal opacification enhanced the contrast between structures such as liver and diaphragm, or spleen and pancreas, provided a good visualization of the bowel structures including the mesenteric attachments, and a sharp demarcation between the IP organs and the retroperitoneal space.
FIGURE 6.
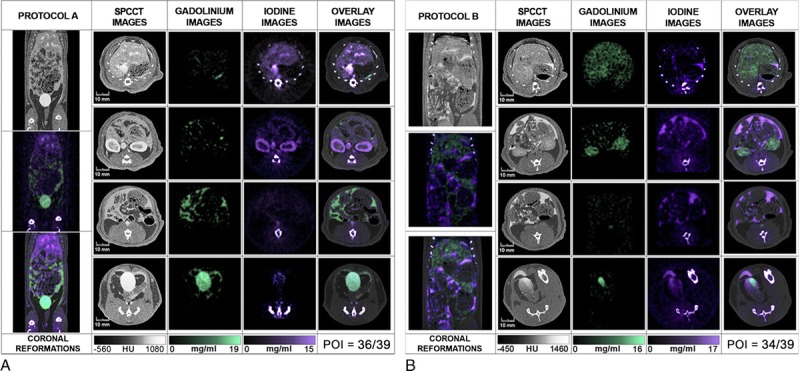
Abdominopelvic spectral photon-counting CT images and contrast material maps acquired at 20 seconds post-IV injections for both protocols (100 mA, 120 kVp, 0.25 mm isotropic voxel size). Protocol A used a combination of IP gadolinium and IV iodine based contrast agents. Protocol B used a combination of IP iodine and IV gadolinium contrast agents (POI: iodine: purple, gadolinium: green, bone: white). The bone structures that appear in the iodine images were segmented on the SPCCT images based on a windowing threshold and a specific white overlay was applied.
Contrast Agents Analysis
Whereas 1 contrast agent could be differentiated from another in SPCCT images, the element-specific maps provided clear visual separation of the contrast agents, allowing assessment of specific peritoneal opacification and organ enhancement (Fig. 6). On the iodine map, the signal was preserved in the structures enhanced, either the peritoneal cavity or the organs of interest, without discrimination from the bone signal, as was seen for the phantom. On the gadolinium map, only the signal arising from gadolinium was seen with the benefit of removal of all the other structures, such as bone and soft tissue. The specific discrimination of the contrast agent was seen in both protocols, with the additional value to be absolutely quantitative, as confirmed by the phantom study.
In addition, the material maps allowed the quantification of the concentrations of contrast agents in the organs of interest and the peritoneal cavity and showed physiological enhancement within the organs of interest (Fig. 7). Moreover, material maps highlighted late renal excretion of the IP agent with accumulation within the bladder (Fig. 8) and inconsistent concentrations of contrast agents within the bladder due to the frequent urination of the rats during imaging protocol (Fig. 7).
FIGURE 7.
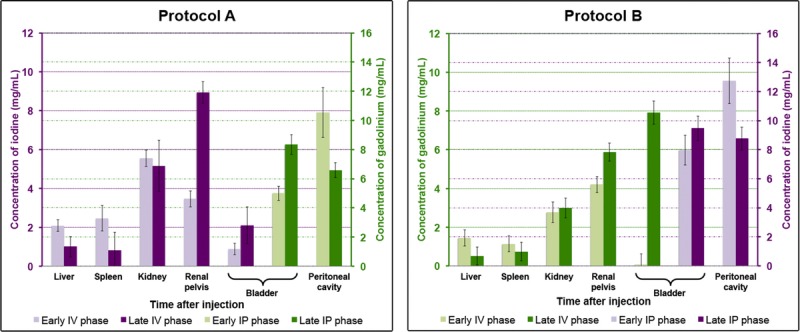
Concentrations of the contrast agents in the peritoneal cavity and the organs of interest (liver, spleen, kidney, renal pelvis, bladder). Data are presented as mean ± standard deviation of the absolute concentrations among each group. Iodine concentrations are given in purple and gadolinium concentrations in green.
FIGURE 8.
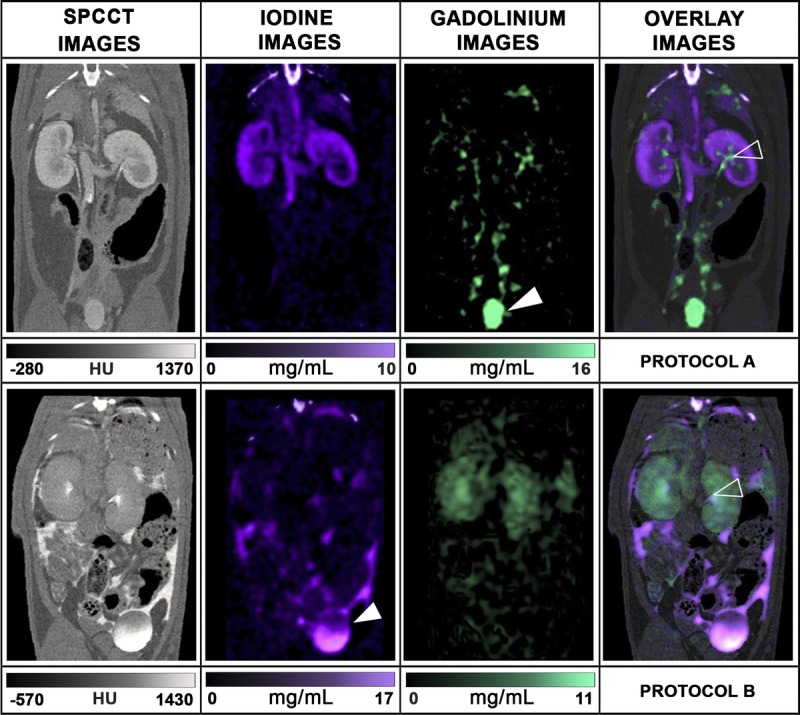
Coronal oblique SPCCT images and material contrast maps show the excretion in the urinary tract of the IP agent, which can be observed only in the contrast maps from each protocol. The upper row shows the renal excretion of the IP agent (renal pelvis = empty head arrow, green = gadolinium, protocol A), whereas the kidney presents a good cortical enhancement with the IV agent (purple = iodine, protocol A). The lower row shows a faster renal excretion of both agents (renal pelvis = empty head arrow), with a higher proportion of the IP agents in the bladder (bladder = full head arrow, purple = iodine, protocol B).
The CNR values between the renal cortex during the enhancement phase and the peritoneal cavity were higher on the material maps (14.2 ± 1.0 and 12.1 ± 0.4 on iodine and gadolinium maps, respectively) for protocol A compared to the SPCCT images (5.0 ± 2.5) (Fig. 9A). The CNR values between the peritoneal cavity and the bone were also higher on the gadolinium map (23.0 ± 1.0) for protocol A (Fig. 9B) than on the SPCCT images (18.8 ± 1.3) because the gadolinium map has no signal arising from the bone. Protocol B resulted in lower CNR than protocol A for the evaluation of the renal cortex enhancement (7.4 ± 1.2 vs 14.2 ± 1.0 on gadolinium and iodine maps, respectively; P = 0.0495) (Fig. 9, A and C) and for the CNR between the bone and peritoneal cavity since the signal arising from the bone is present on the iodine maps (1.9 ± 2.0 vs 23.0 ± 1.0 on iodine and gadolinium maps, respectively, P = 0.0495) (Fig. 9, B and D).
FIGURE 9.
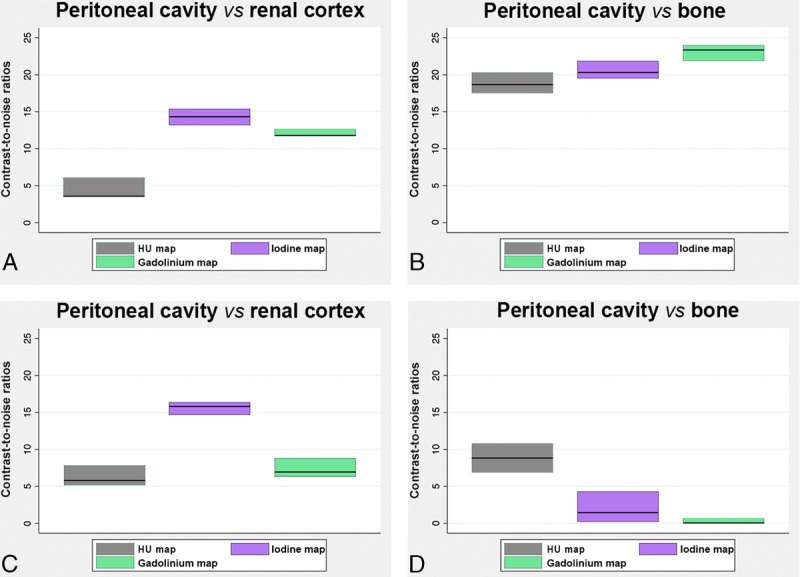
Graphs showing the mean CNRs (mean values among rats in the same protocol of 2 ROIs divided by the noise), in the SPCCT images and contrast material maps within the protocol A (A, B) and protocol B (C, D).
DISCUSSION
Peritoneal diseases are common, but their diagnostic still represents a challenge for general radiologists because of the overlap in radiologic imaging appearances. Indeed, even CT, which is the first choice imaging modality in these diseases, is limited by its low sensitivity for the detection of small structures (eg, metastases <1 cm) and mesenteric landmark.27
In this study, we demonstrated the ability of a prototype SPCCT system, adapted from a clinical CT base, to perform in vivo high spatial resolution and multicolor dynamic peritoneal imaging in rats. We used 2 clinically approved contrast agents, gadolinium, a K-edge contrast material, and iodine, a non-K-edge contrast agent, which were administered simultaneously, one of them IP and the other IV. Taking advantage of the spectral capabilities of the SPCCT system, we could collect both qualitative and quantitative information and obtain complete peritoneal dual-contrast imaging.
Our protocol led to peritoneal opacification that enhanced the contrast resolution on both SPCCT and contrast material overlay images and permitted a good delineation of the organs, digestive and small structures, as well as a complete and specific visualization of the peritoneal cavity. This was confirmed by the excellent POI in each protocol. Moreover, using the material decomposition of the attenuation into the iodine and the gadolinium material maps, it was possible to differentiate the peritoneal cavity from the abdominal and pelvic organs with good CNR. A good CNR was somewhat expected with gadolinium, as although calcium-rich structures appear in the iodine maps using our material decomposition approach, their attenuation profile is far from the gadolinium, and so no signal from calcium contaminates the gadolinium maps. Interestingly, despite the calcium attenuation profile being close to that of iodine,3 we also observed high CNR for the visualization of renal cortex using the IV iodine injection. Moreover, we observed higher CNR between the renal cortex and the peritoneal cavity using IV iodine injection on the appropriate material maps. This was probably due to the higher load of iodine atoms injected compared to gadolinium. However, we were limited in the visualization of the regions nearby the diaphragm, likely because of motion from breathing. Furthermore, the acquisition of the peritoneal cavity images needed temporary inhibition of gastroduodenal movements induced by glucagon to allow visualization of digestive structures. Fasting and gavage feeding the animals with hyperosmotic solution were also necessary to improve the bowel structure visualization, by filling the lumen with liquid that replaced the high attenuating feces and air present in the rat digestive system. Hence, this indicates the potential of dual-contrast enhanced SPCCT for peritoneal opacification, which can be performed in patients for preoperative imaging.42–45 In addition, to the best of our knowledge, this study is the first to use a clinical-scale prototype SPCCT for peritoneal opacification imaging in a small animal model. Previous studies in small animals used a micro-CT with the drawback of long time acquisitions, limiting the use of IV contrast media.46,47
As mentioned above, a major limitation of peritoneal imaging today is its low sensitivity for the detection of small structures, including small PMs. In the present study, we could clearly visualize, on the generated SPCCT images, the superior mesenteric artery collaterals and the mesenteric attachments, which are structures measuring less than 1 mm. This finding can be explained by the high intrinsic spatial resolution confirmed by the MTF (22.4 lp/cm at 10% MTF at a distance of 15 mm to the rotation center). This is mostly because of the smaller pixel size of PCDs compared with that of energy integrating detectors, which are used in typical CT scanners.2,13 Altogether, these results suggest that SPCCT should have a tumor identification potential beyond current detection.27 This will have to be tested in an animal model of peritoneal carcinomatosis by simultaneously injecting gadolinium IP to highlight PMs via negative contrast and iodine IV to improve the contrast resolution between normal tissue and PM enhancement. We would then quantify the 2 different contrast agents on overlay maps.
Interestingly, in the present study, we show that SPCCT allows the quantification of material concentration, both in vitro and in vivo. Indeed, we measured a very accurate response of the material decomposition process, with a quantifiable offset. However, the system underestimated the iodine and gadolinium concentrations, similar to previously published results.9,11 This underestimation can partly be explained by pulse pile-up at high flux levels and maybe an indication of a suboptimal spectral model. The contribution of scatter to the detector signal is another potential source for systematic quantification errors. Hence, the observed imperfections in the spectral decomposition limit the spectral performance at high flux levels, and improvements of the spectral model of the detection chain should be considered. Nevertheless, we observed an expected enhancement in the organs immediately after IV injection, which had largely dissipated at the late IV phase except for in the renal cortex in the case of the gadolinium contrast agent. This outcome can be explained by the fact that the iodinated compounds are known to have a faster renal clearance, compared with the gadolinated ones.48,49 We also observed a high concentration of the IP contrast agents in the bladder at the late IP phase in favor of a blood diffusion, which is explained by the absorption by the vascular system and terminal lymphatics within the peritoneal cavity.50
Altogether, the peritoneal imaging methodology we present here seems particularly suitable for clinical research, although there are some limitations to our study. First, as it was not possible to select a softer reconstruction kernel, which would yield similar image resolution as a typical reconstruction kernel on a clinical CT scanner, we tried to simulate the image resolution of such a system by reconstructing larger pixels. The accuracy of this simulation will not be perfect. Second, some adjustment would have to be made to translate it to humans (eg, the beam hardening in small animal is low and may result in some differences in patients). Moreover, the concentrations of gadolinium used in the present study were higher than the clinical concentrations used in MRI owing to the low sensitivity of SPCCT. However, applying more advanced reconstruction methods or postprocessing treatments either in the image or the raw data domains would likely result in improved sensitivity and decrease the dose of contrast agent needed.
CONCLUSION
Spectral photon counting CT is feasible using dual-contrast agents within peritoneal and blood compartments, allowing a good assessment of the peritoneal cavity and abdominal organs in rats. The advantages of SPCCT for this application are a result of its high spatial resolution and higher CNR in element-specific images than in standard CT. An application of SPCCT may therefore be improved detection of PMs.
Supplementary Material
ACKNOWLEDGMENT
We thank Dr Valérie Tatard-Leitman, Dr Cyril Mory, Pr Loic Boussel, Dr Monica Sigovan, Dr Luisa Poggi, Dr Yoad Yagil, and Dr Michal Rokni for their help in writing the manuscript. We thank Caroline Bouillot for helping with the experiment and the animal care.
Footnotes
Conflicts of interest and sources of funding: This work was supported by the European Union Horizon 2020 (grant no. 643694) and France Life Imaging (FLI).
The authors report no conflicts of interest.
Supplemental digital contents are available for this article. Direct URL citations appear in the printed text and are provided in the HTML and PDF versions of this article on the journal’s Web site (www.investigativeradiology.com).
REFERENCES
- 1.Si-mohamed S, Bar-Ness D, Sigovan M, et al. Review of an initial experience with an experimental spectral photon-counting computed tomography system. Nucl Instrum Methods Phys Res. 2017;873:27–35. [Google Scholar]
- 2.Taguchi K, Iwanczyk JS. Vision 20/20: single photon counting x-ray detectors in medical imaging. Med Phys. 2013;40:100901. [DOI] [PMC free article] [PubMed] [Google Scholar]
- 3.McCollough CH, Leng S, Yu L, et al. Dual- and multi-energy CT: principles, technical approaches, and clinical applications. Radiology. 2015;276:637–653. [DOI] [PMC free article] [PubMed] [Google Scholar]
- 4.Pourmorteza A, Symons R, Sandfort V, et al. Abdominal imaging with contrast-enhanced photon-counting CT: first human experience. Radiology. 2016;279:239–245. [DOI] [PMC free article] [PubMed] [Google Scholar]
- 5.de Vries A, Roessl E, Kneepkens E, et al. Quantitative spectral K-edge imaging in preclinical photon-counting x-ray computed tomography. Invest Radiol. 2015;50:297–304. [DOI] [PubMed] [Google Scholar]
- 6.Schlomka JP, Roessl E, Dorscheid R, et al. Experimental feasibility of multi-energy photon-counting K-edge imaging in pre-clinical computed tomography. Phys Med Biol. 2008;53:4031–4047. [DOI] [PubMed] [Google Scholar]
- 7.Roessl E, Brendel B, Engel KJ, et al. Sensitivity of photon-counting based K-edge imaging in x-ray computed tomography. IEEE Trans Med Imaging. 2011;30:1678–1690. [DOI] [PubMed] [Google Scholar]
- 8.Roessl E, Proksa R. K-edge imaging in x-ray computed tomography using multi-bin photon counting detectors. Phys Med Biol. 2007;52:4679. [DOI] [PubMed] [Google Scholar]
- 9.Cormode DP, Si-mohamed S, Bar-Ness D, et al. Multicolor spectral photon-counting computed tomography: in vivo dual contrast imaging with a high count rate scanner. Sci Rep. 2017;7:4784. [DOI] [PMC free article] [PubMed] [Google Scholar]
- 10.Symons R, Krauss B, Sahbaee P, et al. Photon-counting CT for simultaneous imaging of multiple contrast agents in the abdomen: an in vivo study. Med Phys. 2017;44:5120–5127. [DOI] [PMC free article] [PubMed] [Google Scholar]
- 11.Dangelmaier J, Bar-Ness D, Daerr H, et al. Experimental feasibility of spectral photon-counting computed tomography with two contrast agents for the detection of endoleaks following endovascular aortic repair. Eur Radiol. 2018;33:497–504. [DOI] [PMC free article] [PubMed] [Google Scholar]
- 12.Si-mohamed S, Cormode DP, Bar-Ness D, et al. Evaluation of spectral photon counting computed tomography K-edge imaging for determination of gold nanoparticle biodistribution in vivo. Nanoscale. 2017;9:18246–18257. [DOI] [PMC free article] [PubMed] [Google Scholar]
- 13.Mannil M, Hickethier T, von Spiczak J, et al. Photon-counting CT: high-resolution imaging of coronary stents. Invest Radiol. 2018;53:143–149. [DOI] [PubMed] [Google Scholar]
- 14.Patel CM, Sahdev A, Reznek RH. CT, MRI and PET imaging in peritoneal malignancy. Cancer Imaging. 2011;11:123–139. [DOI] [PMC free article] [PubMed] [Google Scholar]
- 15.Jayne DG, Fook S, Loi C, et al. Peritoneal carcinomatosis from colorectal cancer. Br J Surg. 2002;89:1545–1550. [DOI] [PubMed] [Google Scholar]
- 16.Glehen O, Kwiatkowski F, Sugarbaker PH, et al. Cytoreductive surgery combined with perioperative intraperitoneal chemotherapy for the management of peritoneal carcinomatosis from colorectal cancer: a multi-institutional study. J Clin Oncol. 2004;22:3284–3292. [DOI] [PubMed] [Google Scholar]
- 17.Elias D, Goéré D, Dumont F, et al. Role of hyperthermic intraoperative peritoneal chemotherapy in the management of peritoneal metastases. Eur J Cancer. 2014;50:332–340. [DOI] [PubMed] [Google Scholar]
- 18.Verwaal VJ, Bruin S, Boot H, et al. 8-year follow-up of randomized trial: cytoreduction and hyperthermic intraperitoneal chemotherapy versus systemic chemotherapy in patients with peritoneal carcinomatosis of colorectal cancer. Ann Surg Oncol. 2008;15:2426–2432. [DOI] [PubMed] [Google Scholar]
- 19.Sugarbaker PH, Sardi A, Brown G, et al. Concerning CT features used to select patients for treatment of peritoneal metastases, a pictoral essay. Int J Hyperthermia. 2017;33:497–504. [DOI] [PubMed] [Google Scholar]
- 20.Mohkam K, Passot G, Cotte E, et al. Resectability of peritoneal carcinomatosis: learnings from a prospective cohort of 533 consecutive patients selected for cytoreductive surgery. Ann Surg Oncol. 2016;23:1261–1270. [DOI] [PubMed] [Google Scholar]
- 21.Pfannenberg C, Königsrainer I, Aschoff P, et al. (18)F-FDG-PET/CT to select patients with peritoneal carcinomatosis for cytoreductive surgery and hyperthermic intraperitoneal chemotherapy. Ann Surg Oncol. 2009;16:1295–1303. [DOI] [PubMed] [Google Scholar]
- 22.Low RN, Barone RM. Combined diffusion-weighted and gadolinium-enhanced MRI can accurately predict the peritoneal cancer index preoperatively in patients being considered for cytoreductive surgical procedures. Ann Surg Oncol. 2012;19:1394–1401. [DOI] [PubMed] [Google Scholar]
- 23.Yan TD, Morris DL, Shigeki K, et al. Preoperative investigations in the management of peritoneal surface malignancy with cytoreductive surgery and perioperative intraperitoneal chemotherapy: expert consensus statement. J Surg Oncol. 2008;98:224–227. [DOI] [PubMed] [Google Scholar]
- 24.Dohan A, Hoeffel C, Soyer P, et al. Evaluation of the peritoneal carcinomatosis index with CT and MRI. Br J Surg. 2017;104:1244–1249. [DOI] [PubMed] [Google Scholar]
- 25.Dromain C, Leboulleux S, Auperin A, et al. Staging of peritoneal carcinomatosis: enhanced CT vs. PET/CT. Abdom Imaging. 2008;33:87–93. [DOI] [PubMed] [Google Scholar]
- 26.de Bree E, Koops W, Kröger R, et al. Preoperative computed tomography and selection of patients with colorectal peritoneal carcinomatosis for cytoreductive surgery and hyperthermic intraperitoneal chemotherapy. Eur J Surg Oncol. 2006;32:65–71. [DOI] [PubMed] [Google Scholar]
- 27.Coakley FV, Choi PH, Gougoutas CA, et al. Peritoneal metastases: detection with spiral CT in patients with ovarian cancer. Radiology. 2002;223:495–499. [DOI] [PubMed] [Google Scholar]
- 28.de Bree E, Koops W, Kröger R, et al. Peritoneal carcinomatosis from colorectal or appendiceal origin: correlation of preoperative CT with intraoperative findings and evaluation of interobserver agreement. J Surg Oncol. 2004;86:64–73. [DOI] [PubMed] [Google Scholar]
- 29.Yu Z, Leng S, Jorgensen SM, et al. Evaluation of conventional imaging performance in a research whole-body CT system with a photon-counting detector array. Phys Med Biol. 2016;61:1572–1595. [DOI] [PMC free article] [PubMed] [Google Scholar]
- 30.Steadman R, Herrmann C, Livne A. ChromAIX2: A large area, high count-rate energy-resolving photon counting ASIC for a spectral CT prototype. Nucl Instrum Methods Phys Res. 2017;862:18–24. [Google Scholar]
- 31.Blevis IM, Altman A, Berman Y, et al. Introduction of Philips preclinical photon counting scanner and detector technology development. IEEE Med Imaging Conf. 2015. [Google Scholar]
- 32.Roessl EE. Imaging performance of a photon-counting computed tomography prototype. Geneva, Switzerland: CERN; 2015. [Google Scholar]
- 33.Roessl E, Herrmann C. Cramér-Rao lower bound of basis image noise in multiple-energy x-ray imaging. Phys Med Biol. 2009;54:1307–1318. [DOI] [PubMed] [Google Scholar]
- 34.Cormode DP, Roessl E, Thran A, et al. Atherosclerotic plaque composition: analysis with multicolor CT and targeted gold nanoparticles. Radiology. 2010;256:774–782. [DOI] [PMC free article] [PubMed] [Google Scholar]
- 35.Hahnemann ML, Nensa F, Kinner S, et al. Improved detection of inflammatory bowel disease by additional automated motility analysis in magnetic resonance imaging. Invest Radiol. 2015;50:67–72. [DOI] [PubMed] [Google Scholar]
- 36.Schneider CA, Rasband WS, Eliceiri KW. NIH image to ImageJ: 25 years of image analysis. Nat Methods. 2012;9:671–675. [DOI] [PMC free article] [PubMed] [Google Scholar]
- 37.Wenz H, Maros ME, Meyer M, et al. Image quality of 3rd generation spiral cranial dual-source CT in combination with an advanced model iterative reconstruction technique: a prospective intra-individual comparison study to standard sequential cranial CT using identical radiation dose. PLoS One. 2015;10:e0136054. [DOI] [PMC free article] [PubMed] [Google Scholar]
- 38.Wenz H, Maros ME, Meyer M, et al. Intra-individual diagnostic image quality and organ-specific-radiation dose comparison between spiral cCT with iterative image reconstruction and z-axis automated tube current modulation and sequential cCT. Eur J Radiol Open. 2016;3:182–190. [DOI] [PMC free article] [PubMed] [Google Scholar]
- 39.Jacquet P, Sugarbaker PH. Clinical research methodologies in diagnosis and staging of patients with peritoneal carcinomatosis. Cancer Treat Res. 1996;82:359–374. [DOI] [PubMed] [Google Scholar]
- 40.Lemoine S, Papillard M, Belloi A, et al. Renal perfusion: noninvasive measurement with multidetector CT versus fluorescent microspheres in a pig model. Radiology. 2011;260:414–420. [DOI] [PubMed] [Google Scholar]
- 41.Hallgren KA. Computing inter-rater reliability for observational data: an overview and tutorial. Tutor Quant Methods Psychol. 2012;8:23–34. [DOI] [PMC free article] [PubMed] [Google Scholar]
- 42.Gryspeerdt S, Clabout L, Van Hoe L, et al. Intraperitoneal contrast material combined with CT for detection of peritoneal metastases of ovarian cancer. Eur J Gynaecol Oncol. 1998;19:434–437. [PubMed] [Google Scholar]
- 43.Hughes PM, Zammit-Maempel I, Murphy D. Computed tomographic assessment of intraperitoneal fluid distribution prior to intraperitoneal chemotherapy for ovarian cancer. Br J Radiol. 1992;65:295–297. [DOI] [PubMed] [Google Scholar]
- 44.Barlin JN, Bristow RE, Bleich K, et al. Computed tomographic peritoneography prior to intraperitoneal chemotherapy in advanced Müllerian cancer: a pilot study. Clin Imaging. 2010;34:191–195. [DOI] [PubMed] [Google Scholar]
- 45.Halvorsen RA, Jr, Panushka C, Oakley GJ, et al. Intraperitoneal contrast material improves the CT detection of peritoneal metastases. AJR Am J Roentgenol. 1991;157:37–40. [DOI] [PubMed] [Google Scholar]
- 46.Rathnayake S, Mongan J, Torres AS, et al. In vivo comparison of tantalum, tungsten, and bismuth enteric contrast agents to complement intravenous iodine for double-contrast dual-energy CT of the bowel. Contrast Media Mol Imaging. 2016;11:254–261. [DOI] [PMC free article] [PubMed] [Google Scholar]
- 47.Paulus MJ, Gleason SS, Kennel SJ, et al. High resolution X-ray computed tomography: an emerging tool for small animal cancer research. Neoplasia. 2000;2:62–70. [DOI] [PMC free article] [PubMed] [Google Scholar]
- 48.Harpur ES, Worah D, Hals PA, et al. Preclinical safety assessment and pharmacokinetics of gadodiamide injection, a new magnetic resonance imaging contrast agent. Invest Radiol. 1993;28(Suppl 1):S28–S43. [DOI] [PubMed] [Google Scholar]
- 49.Dencausse A, Violas X, Feldman H, et al. Pharmacokinetic profile of iobitridol. Acta Radiol Suppl. 1996;400:25–34. [PubMed] [Google Scholar]
- 50.Tsilibary EC, Wissig SL. Lymphatic absorption from the peritoneal cavity: regulation of patency of mesothelial stomata. Microvasc Res. 1983;25:22–39. [DOI] [PubMed] [Google Scholar]
Associated Data
This section collects any data citations, data availability statements, or supplementary materials included in this article.