Supplemental Digital Content is available in the text.
Keywords: blood pressure, epidemiology, hypertension, pediatrics, prehypertension, prevalence
Abstract
In 2017, the American Academy of Pediatrics issued a new clinical practice guideline for defining hypertension in children as an update to the previous Fourth Report guidelines issued in 2004. Prevalence of confirmed pediatric hypertension in children has ranged from 2% to 4% based on previous guidelines yet it is unknown what the prevalence is under the new guideline. We estimated the prevalence of elevated blood pressure, stage 1, and stage 2 hypertension by the new American Academy of Pediatrics guideline in our school-based blood pressure screening program. New prevalence estimates were compared with Fourth Report prevalence estimates in the same population by sex, age, and height factors. In 22 224 students aged 10 to 17 years screened in school as part of the Houston Pediatric and Hypertension Program at the University of Texas McGovern Medical School, the prevalence of elevated blood pressure (previously called prehypertension) increased from 14.8% by Fourth Report to 16.3% by the new American Academy of Pediatrics guideline. This increase in elevated blood pressure resulted from differential classification changes in younger and older children. Prevalence of confirmed hypertension remains at 2% to 4% in this population, however shorter children <13 years old and taller, older children 13+ years old are systematically more likely to be diagnosed with hypertension by new guidelines.
See Editorial Commentary, pp 31–32
Previous studies have estimated the prevalence of confirmed hypertension in children to range between 2% and 4%.1–3 These estimates were based on the 2004 Fourth Report on the Diagnosis, Evaluation, and Treatment of High Blood Pressure in Children and Adolescents (FR).4 In 2017, the American Academy of Pediatrics (AAP) issued the new Clinical Practice Guideline for Screening and Management of High Blood Pressure in Children and Adolescents (AAP) updating the criteria for hypertension diagnosis in children.5
The Houston Pediatric and Adolescent Hypertension Program at the University of Texas McGovern Medical School at Houston conducts blood pressure (BP) screenings in middle and high schools in the Houston metropolitan area. We have previously published estimates of the prevalence of abnormal BP based on FR guidelines.3 The goal of this study is to determine how the new AAP guidelines alter the prevalence of BP classifications in this community-based screening population.
Methods
The Committee for Protection of Human Subjects at the University of Texas Health Science Center at Houston (as well as local school district institutional review boards where required) has approved the collection and analysis of this study data but has not approved the sharing of data from this study outside the university. We will continue to work with this committee to develop a data sharing plan as the study continues to collect data. Between 2000 and 2017, the Houston Pediatric and Adolescent Hypertension Program at the University of Texas McGovern Medical School at Houston completed school-based BP screenings in 28 middle and high schools. Schools were selected by convenience sampling with the goal of identifying a population with similar racial/ethnic distribution as the Houston metropolitan area. All students enrolled at selected schools were eligible to participate, with physical education classes as the primary point of contact. On the day of study visit, the screening was performed in lieu of regular physical education activities. Individual consents were obtained from each student’s primary caretaker per local school district policy. In schools that did not require individual consents, all students were screened unless either the student or legal guardian declined.
Participating students completed an open-ended questionnaire that identified age, sex, racial/ethnic background, and use of antihypertensive medications. Our study personnel was composed of paramedics, medical students, pediatric residents, fellows, clinic nurses, and attending pediatric nephrologists. All people responsible for obtaining measurements were trained in the proper use of the equipment. Study personnel measured arm circumference (cm), height (cm), and weight (kg). Body mass index percentiles representing conventional pediatric categories (<5th percentile: underweight, 5th–84th percentile: normal, 85th–94th percentile: overweight, ≥95th percentile: obese) were calculated from 2000 Centers for Disease Control and Prevention growth charts. Severe obesity was defined as absolute body mass index >35. A minimum of 2 oscillometric BP readings were obtained with a Spacelabs 90217 (Snoqualmie, WA) or Dinamap Critikon (Tampa, FL) monitor with at least 1 minute between measurements. All measurements were conducted while participants were seated and used an appropriately sized cuff on the right arm as outlined in the FR and AAP guidelines.4,5 Our study protocol required a minimum of 2 BP readings on the initial visit. In our final data set, 3.8% of the students had only 2 BP readings, with the remaining 96% having 3+ readings.
BPs for all students at each screen were classified by both FR guidelines and AAP guidelines4,5 (Table I in the online-only Data Supplement). FR thresholds and categorization were applied to the second through third average BP to allow direct comparison with the AAP guidelines. All students with BP ≥90th percentile or ≥120/80 mm Hg on the initial screening day subsequently had repeated BP measurements on up to 2 additional occasions to verify the presence of confirmed hypertension. All follow-up BP measurements were performed within 2 months of the initial screening date to reduce potential confounding from changes in body habitus. AAP thresholds and categorization were applied to the first measurement if normal. If the first measurement was abnormal, the second through third BP average was used to define normal, elevated, or stage 1/2 hypertensive BP per AAP guidelines. AAP percentile thresholds were applied for students <13 years old and static thresholds were applied for students 13+ years.
After the 3 screening sessions, subjects were classified as follows: (1) normotensive: systolic BP and diastolic BP less than prehypertensive/elevated BP threshold at initial screening, (2) elevated BP: systolic BP or diastolic BP greater than or equal to prehypertensive/elevated BP threshold but less than stage 1 hypertensive threshold at initial screening, (3) hypertensive: systolic BP or diastolic BP greater than or equal to stage 1 hypertensive threshold at all 3 screenings. There was 1 additional category called variable BP which we defined as systolic BP or diastolic BP greater than or equal to stage 1 hypertensive threshold at the initial visit but not meeting criteria for hypertension at all 3 screens. Students were considered lost to follow-up if they were stage 1/2 hypertensive at the initial screen but failed to complete subsequent follow-ups for confirmation. When examining confirmed hypertension as a binary category, normotensive, elevated BP, and variable BP groups were collapsed into a single category.
Continuous variables are reported as mean±SD (minimum–maximum); categorical variables are reported as count (%). κ-coefficients are reported to assess agreement between FR and AAP diagnosis categories, separately for each age strata (<13 and 13+ years). To assess difference in prevalence estimates by guidelines, general estimating equation with binomial distribution, log link, and robust variance estimation was fit for the outcome of confirmed hypertension with the predictors age strata, sex, and height percentile. All main effects and all interactions included in the model. All analyses were completed using Stata 15 SE.
Results
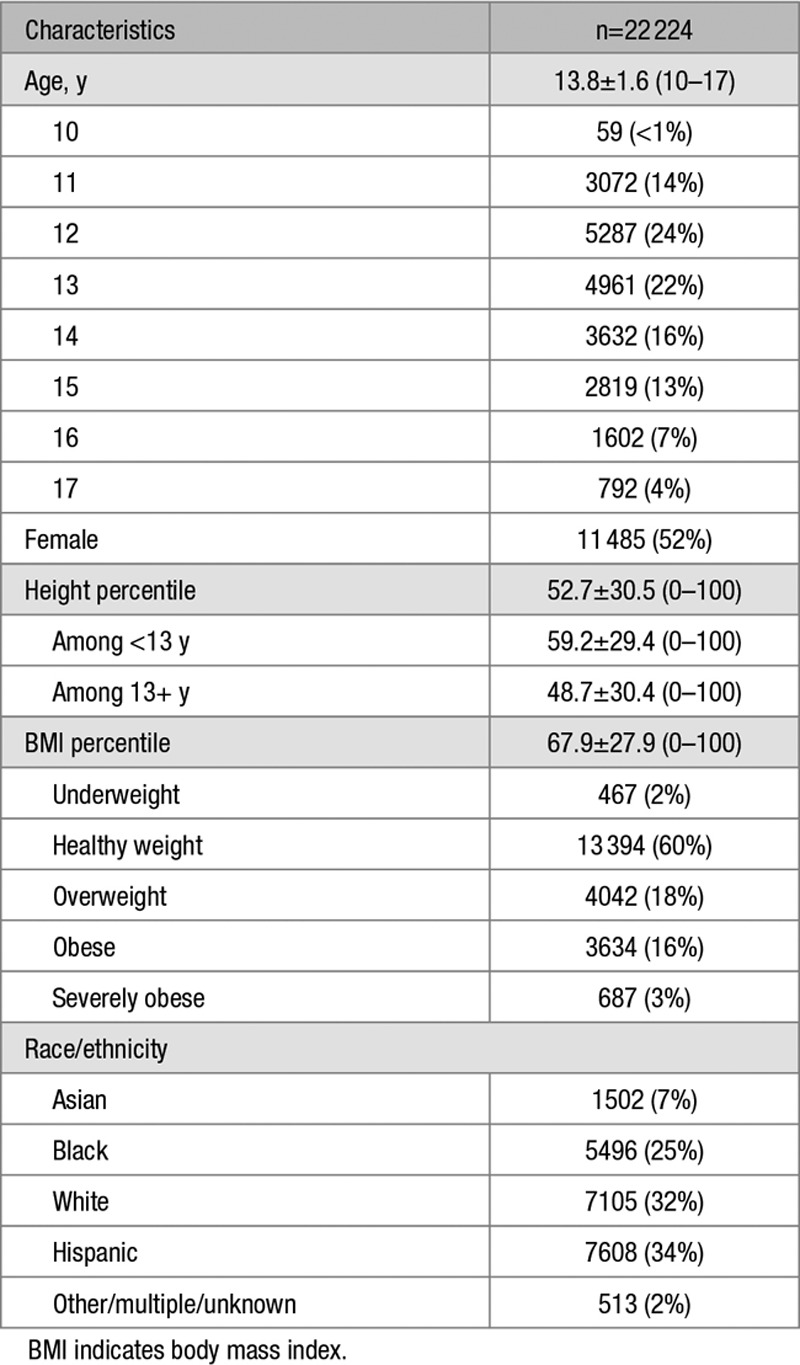
Between 2000 and 2017, 22 543 students participated in our BP screening program. Students were excluded if they were ≥18 years old, reported any use of antihypertensive medications, or were missing sex, age, height, or weight (n=319). Table 1 shows demographics of the final 22 224 screened population. While the age of screened students ranged from 10 to 17 years, the majority of students were 11 to 15 years old. Of note, the screening population reflects the diversity seen in Houston Census reports.6 Additionally, 37% of our population were overweight/obese, which is slightly higher than the 35% from the National Health and Nutrition Examination Survey (NHANES) data.7
Table 1.
Student Characteristics From Blood Pressure Screening Program
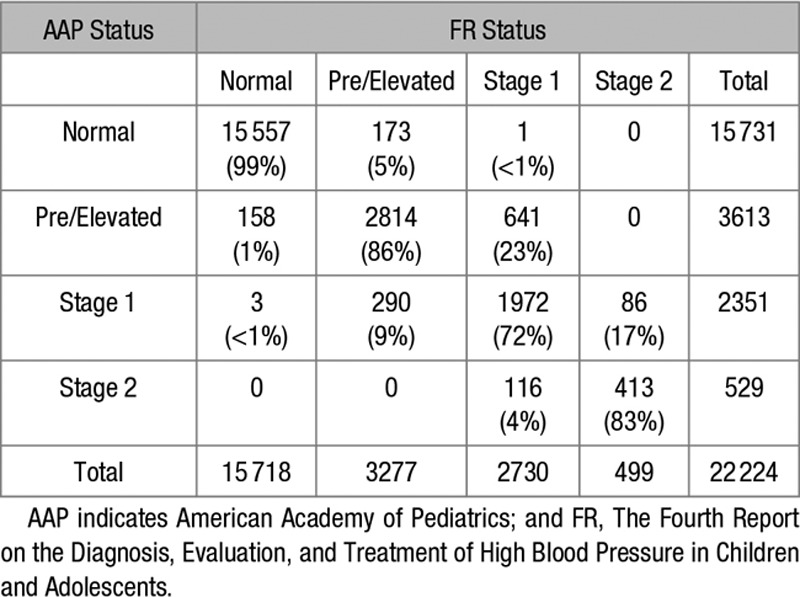
The majority of students were normotensive at the initial screen by both guidelines, 70.8% by AAP and 70.7% by FR (Figure 1). Overall, there was a 1.5% increase in elevated BP (previously called prehypertension) by AAP compared with FR. This increase in elevated BP primarily came from downwards reclassification of students who were previously stage 1 hypertension (641) by FR (Table 2). Stage 1 hypertension prevalence decreased by 1.7% while stage 2 prevalence was similar by both guidelines. The κ-statistic was high (0.86) with overall agreement of 93.4%.
Figure 1.
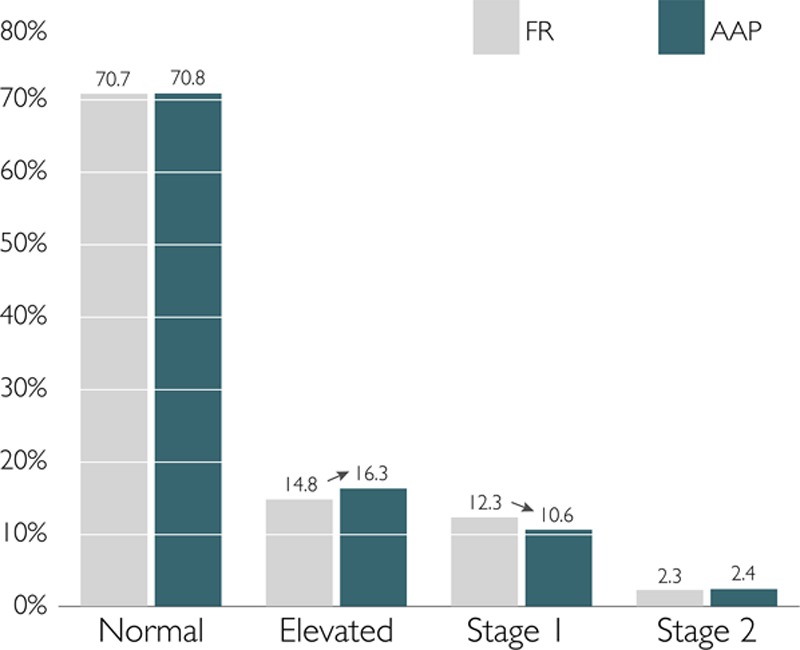
Initial screen hypertension prevalence. AAP indicates American Academy of Pediatrics; and FR, The Fourth Report on the Diagnosis, Evaluation, and Treatment of High Blood Pressure in Children and Adolescents.
Table 2.
Initial Screen AAP and FR Agreement
Increases in the prevalence of elevated BP occurred in both younger (<13 year old) and older (13+ years) students but came from different reclassification categories (Figure 2). Younger children were more likely to be reclassified upward from normotension to elevated BP or from elevated BP to stage 1 hypertension. Conversely, in older children the normotension prevalence was slightly higher by AAP compared with FR. Older children were more likely to be reclassified downward from stage 1 hypertension to elevated BP. The κ-statistic and overall agreement was similarly good but slightly higher in younger students (0.87 and 94.7%, respectively) compared with older students (0.85 and 92.6%, respectively).
Figure 2.
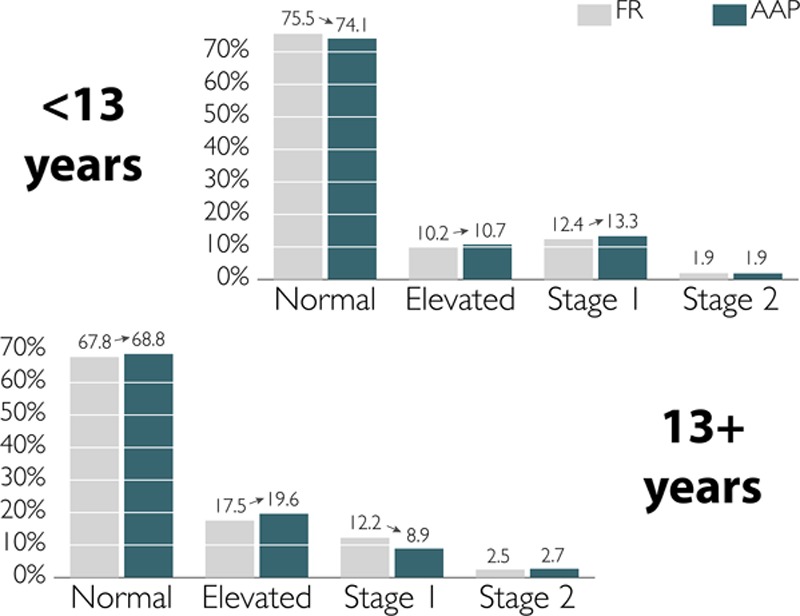
Initial screen prevalence by age group. AAP indicates American Academy of Pediatrics; and FR, The Fourth Report on the Diagnosis, Evaluation, and Treatment of High Blood Pressure in Children and Adolescents.
Of the 22 224 students initially screened, 508 (2.3%) had confirmed hypertension in stage 1 or 2 range at each of 3 screenings by AAP guidelines (Figure 3). This estimate is slightly lower than the 589 (2.7%) who had confirmed hypertension by FR guidelines. Just as observed at the initial screen, overall normotensive prevalence was similar but there was an increase in the elevated BP prevalence in AAP (16.3%) compared with FR (14.7%). Approximately 4% were considered lost to follow-up using both guidelines (848 by AAP; 900 by FR). A large portion of students had variable BP that was not classifiable by either guidelines, 1524 (6.9%) by AAP and 1740 (7.8%) by FR. This reduction in variable BP prevalence is a direct result of a decrease in stage 1 hypertension by AAP guidelines at the initial screen.
Figure 3.
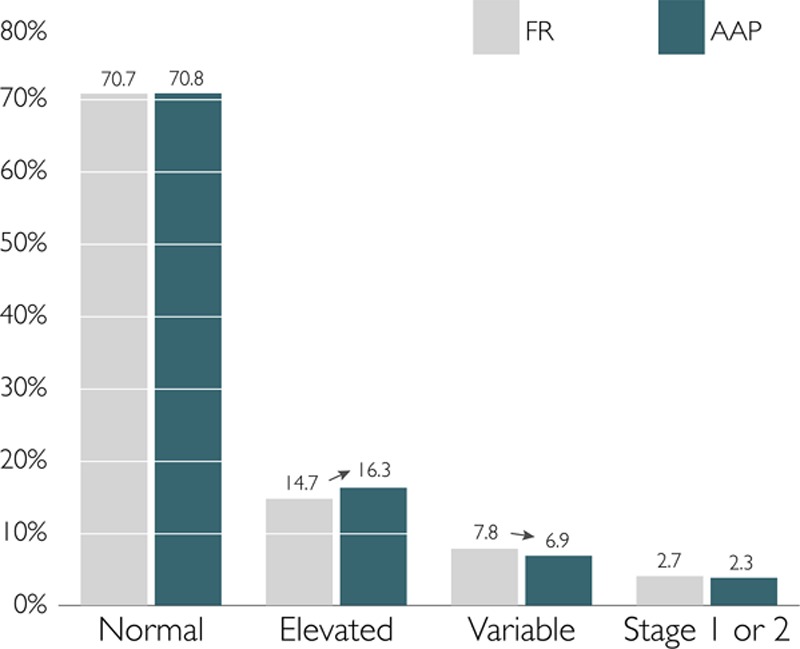
Final confirmed hypertension prevalence. AAP indicates American Academy of Pediatrics; and FR, The Fourth Report on the Diagnosis, Evaluation, and Treatment of High Blood Pressure in Children and Adolescents.
The prevalence of confirmed hypertension varied dramatically by age, sex, and height (Figure 4). Younger shorter boys were more likely have confirmed hypertension by AAP compared with FR. Conversely, older shorter boys were less likely to have confirmed hypertension by AAP compared with FR. Similar but more attenuated trends were seen in girls across height percentiles.
Figure 4.
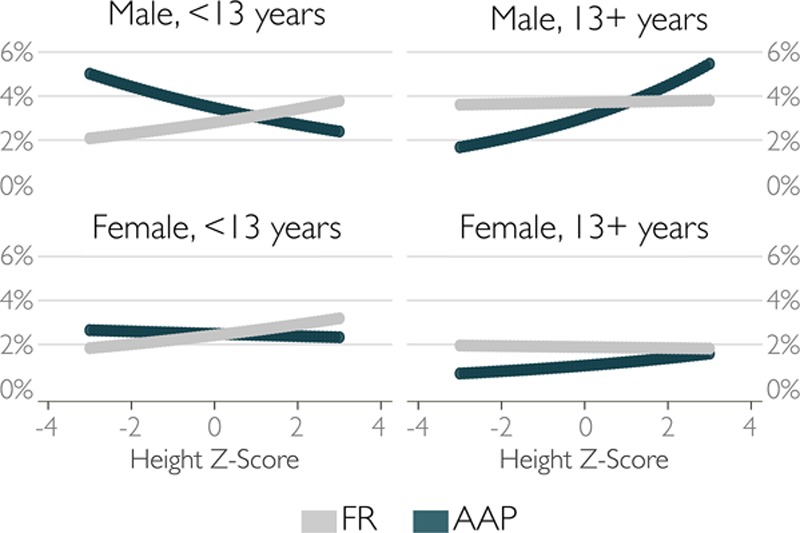
Final confirmed hypertension prevalence by sex and age group. AAP indicates American Academy of Pediatrics; and FR, The Fourth Report on the Diagnosis, Evaluation, and Treatment of High Blood Pressure in Children and Adolescents.
Discussion
The AAP guidelines introduce several changes to the normative thresholds that have clinical implications that are different depending on a youth’s age (Figure I in the online-only Data Supplement). Compared with FR, exclusion of obese youths generated lowered thresholds for most younger children. This shifting downward results in more younger children with abnormally high BP. As thresholds for both elevated BP and hypertension are lowered, both categories have increased in prevalence. Implications for older children are slightly different. While few teens change classification from normal (the threshold has been 120/80 mm Hg since FR), the increased hypertension threshold to 130/80 mm Hg results in a wider range of elevated BP for children 13 to 15 years, and thus significantly more of these children with elevated BP but less hypertension. However among older teens, the hypertension thresholds are actually lower than FR, resulting in a higher prevalence of hypertension. Given the relatively few older teens in our study population, we demonstrated the increase in elevated BP but did not see an increase in hypertension among children >13 years.
There are 3 potential ways the new AAP guidelines have changed prevalence estimates: lowering BP thresholds for most <13 year olds, implementing static thresholds for 13+ year olds, and specifying the number of BP measurements to diagnose abnormal BP. Firstly, younger children of short height were more likely to have confirmed hypertension by AAP than by FR. A comparison of AAP and FR 95th BP percentile thresholds among 10- to 12-years-old boys explains this phenomenon. At the 5th height percentile, the AAP thresholds are all 3 mm Hg less than FR resulting in higher hypertension prevalence among shorter boys. However, at the 95th height percentile, the AAP thresholds range from 2 mm Hg lower to 1 mm Hg higher than FR resulting in some taller boys less like to be classified as hypertensive by the new AAP guidelines. Thus, assuming all AAP thresholds are lower than FR due to the exclusion of overweight/obese from normative data is incorrect. Some children, such as taller boys age 10 to 12 years, have higher threshold values by the new AAP guidelines.
Second, the implementation of 130/80 mm Hg static threshold in older children also affect children differently at varying heights and ages, despite little threshold change for elevated BP in this age group. Among 13+ year olds, shorter students were less likely to have confirmed hypertension, as they previously had FR 95th percentile <130 mm Hg. If we look only at 13 to 14 year olds in our population, elevated BP prevalence increased from 15.5% (FR) to 19.1% (AAP) but hypertension prevalence decreased from 15.0% (FR) to 10.0% (AAP) at the initial screen. Conversely, most 16 to 17 year olds now have lower thresholds defining hypertension thus saw a slight decrease in elevated BP prevalence from 24.5% (FR) to 22.3% (AAP) and slight increase in hypertension prevalence from 13.5% (FR) to 15.5% (AAP). However, because our sample comprised predominantly younger teens, the trends seen in the entire 13+ population reflect that of the 13 to 14 year olds with increases in elevated BP and decreases in hypertension.
While clinically these static thresholds may decrease overall hypertension rates in teenagers, the alignment with the adult guideline thresholds is appropriate given height changes less in adolescents and provides a more natural evolution in the clinical management as these children transition to adult specialists.
Third, the new AAP guidelines now specify the number of BP readings to measure and average when classifying BP. Specifically, normal BP can be defined by the first BP measurement alone while elevated or hypertensive range BP determined using the second through third average. The logic behind this change is based on previous studies showing that BP tends to fall on repeated measurement with the first BP highest and fourth BP lowest.8 We did confirm this assumption (data not shown) by applying the new AAP thresholds to the second through third average, ignoring the tiered approach using the first BP issued by the guidelines, which resulted in no differences in the classification of students’ BP status. Thus, the new specifications on number of BP measurements do not affect the prevalence when compared with second through third average. However, if single readings or alternate averages are applied to the thresholds, perhaps second through fourth average as previously used in conjunction for FR prevalence estimates in our screening population,3 then prevalence estimates may be altered.
At least 1 publication has reported differing results when applying the AAP guidelines in a large pediatric population. Sharma et al9 recently showed an increase in the prevalence of stage 1 and 2 hypertension when applying the AAP guidelines to NHANES data. While we did not show the same results, the discrepancies in our findings are likely because of differences in the age ranges of our populations. Among the younger students <13 years, which constituted approximately one-third of our cohort, we did show increases in both elevated BP and hypertension with AAP guidelines similar to Sharma et al.9 Given that the NHANES data include a larger range of younger participants (aged 4 to 17 years), their overall results likely reflect the large proportion of their population that is <13 years and now have lower thresholds for both elevated BP and hypertension. In addition, our studies differed in that NHANES only conducts 1 BP screen while our study confirmed hypertension across 3 separate screens. It is also possible that the distribution of body size in children surveyed by NHANES differs from our study which could also result in dramatic differences in hypertension prevalence because of new thresholds.
Limitations of this study include that the sample is a convenience sample, thus not a randomly selected representation of Houston. However, the racial distribution is in line with census estimates.6 Another limitation is the use of oscillometric monitors and hypertensive status not being confirmed by manual measurement nor by ambulatory BP monitor. While the confirmation of hypertensive status by manual measurement, and subsequently by ambulatory BP monitor, is indicated in the guidelines, we have used validated BP monitors10 and the majority of pediatric clinics now use oscillometric monitors to measure BP because of their ease of use and lack of assessor bias. A final limitation was a fair amount of lost to follow-up in our population: 848 by AAP and 900 by FR subjects who were hypertensive at the initial screen but not followed up on subsequent occasions for remeasurement. If we assume these subjects followed a similar trend as our followed population then ≈25% would remain hypertensive across the 3 occasions by both AAP and FR guidelines. Thus, our hypertension prevalence estimates would be slightly higher (3.2% by AAP; 3.7% by FR) but this nondifferential bias would not affect the agreement between the guidelines.
Lastly, this study emphasizes the inherent issues in normative based cutoff values defining hypertension. Minor changes in how the normative data are collected, analyzed, and enacted into guidelines can have dramatic diagnostic implications in the general population. While ongoing studies such as SHIP AHOY (Study of High Blood Pressure in Pediatrics: Adult Hypertension Onset in Youth) are currently attempting to create thresholds correlated with subclinical markers of end organ damage in children, it will be many years before enough data will be collected to this end. More funding is needed for studies supporting outcomes based BP thresholds in children as we have in adults.
Perspectives
In a large community-based screening cohort, the application of new AAP hypertension guidelines resulted in a 1.5% increase in the prevalence of elevated BP (formerly called prehypertension). This increase in elevated BP resulted from differential classification changes in younger and older children. Younger children <13 years are more likely to be reclassified upward from normal BP to elevated BP or elevated BP to hypertension. Younger teens are more likely to be reclassified downward from hypertension to elevated BP while older teens are more likely to be reclassified upwards from elevated BP to hypertension. Overall, confirmed hypertension remains to be 2% to 4% in this population, however shorter children <13 years old and taller, older children 13+ years old are systematically more likely to be diagnosed with hypertension by new AAP guidelines. This study reveals the diagnostic implications of altering normative based thresholds in children and highlights the need for outcomes based BP thresholds in children as we have in adults.
Sources of Funding
This study was partially supported by the National Institutes of Health/National Institute of Diabetes and Digestive and Kidney Diseases under grant K23-DK065951. Funded by the National Institutes of Health.
Disclosures
J. Samuels was a member of American Academy of Pediatrics subcommittee for the new Clinical Practice Guideline and is a consultant for Novartis but in a capacity unrelated to pediatric hypertension. The other authors report no conflicts.
Supplementary Material
Footnotes
The online-only Data Supplement is available with this article at https://www.ahajournals.org/doi/suppl/10.1161/HYPERTENSIONAHA.118.11673.
Novelty and Significance
What Is New?
First publication of confirmed hypertension prevalence since new American Academy of Pediatrics (AAP) guidelines published.
Prevalence of elevated blood pressure in children increased by 1.5% by AAP compared with Fourth Report.
Children <13 years and taller, older teens are more likely to have confirmed hypertension by AAP guidelines, particularly boys.
What Is Relevant?
Three ways new AAP guidelines changed pediatric hypertension classification: lowering blood pressure thresholds for most (but not all) <13 year olds, implementing static thresholds for 13+ year olds, and specifying number of blood pressure measurements.
Summary
AAP guideline application resulted in increase in elevated blood pressure prevalence to 16.3% by AAP compared with 14.8% by Fourth Report. This increase in elevated blood pressure resulted from differential classification changes in younger and older children.
References
- 1.Din-Dzietham R, Liu Y, Bielo MV, Shamsa F. High blood pressure trends in children and adolescents in national surveys, 1963 to 2002. Circulation. 2007;116:1488–1496. doi: 10.1161/CIRCULATIONAHA.106.683243. doi: 10.1161/CIRCULATIONAHA.106.683243. [DOI] [PubMed] [Google Scholar]
- 2.Hansen ML, Gunn PW, Kaelber DC. Underdiagnosis of hypertension in children and adolescents. JAMA. 2007;298:874–879. doi: 10.1001/jama.298.8.874. doi: 10.1001/jama.298.8.874. [DOI] [PubMed] [Google Scholar]
- 3.Cheung EL, Bell CS, Samuel JP, Poffenbarger T, Redwine KM, Samuels JA. Race and obesity in adolescent hypertension. Pediatrics. 2017;139:e20161433. doi: 10.1542/peds.2016-1433. doi: 10.1542/peds.2016-1433. [DOI] [PMC free article] [PubMed] [Google Scholar]
- 4.National High Blood Pressure Education Program Working Group on High Blood Pressure in Children and Adolescents. The fourth report on the diagnosis, evaluation, and treatment of high blood pressure in children and adolescents. Pediatrics. 2004;114(2 suppl 4th Report):555–576. [PubMed] [Google Scholar]
- 5.Flynn JT, Kaelber DC, Baker-Smith CM, et al. Subcommittee on Screening and Management of High Blood Pressure in Children. Clinical practice guideline for screening and management of high blood pressure in children and adolescents. Pediatrics. 2017;140:e20171904. doi: 10.1542/peds.2017-1904. doi: 10.1542/peds.2017-1904. [DOI] [PubMed] [Google Scholar]
- 6.US Census Bureau. 2010 Census Summary File 1; Table DP-1. American Fact Finder. http://factfinder2.census.gov. Accessed June 9, 2017. [Google Scholar]
- 7.Skinner AC, Ravanbakht SN, Skelton JA, Perrin EM, Armstrong SC. Prevalence of obesity and severe obesity in US children, 1999–2016. Pediatrics. 2018;141:e20173459. doi: 10.1542/peds.2017-3459. doi: 10.1542/peds.2017-3459. [DOI] [PMC free article] [PubMed] [Google Scholar]
- 8.Negroni-Balasquide X, Bell CS, Samuel J, Samuels JA. Is one measurement enough to evaluate blood pressure among adolescents? A blood pressure screening experience in more than 9000 children with a subset comparison of auscultatory to mercury measurements. J Am Soc Hypertens. 2016;10:95–100. doi: 10.1016/j.jash.2015.12.001. doi: 10.1016/j.jash.2015.12.001. [DOI] [PubMed] [Google Scholar]
- 9.Sharma AK, Metzger DL, Rodd CJ. Prevalence and severity of high blood pressure among children based on the 2017 American Academy of Pediatrics Guidelines. JAMA Pediatr. 2018;172:557–565. doi: 10.1001/jamapediatrics.2018.0223. doi: 10.1001/jamapediatrics.2018.0223. [DOI] [PMC free article] [PubMed] [Google Scholar]
- 10.Baumgart P, Kamp J. Accuracy of the SpaceLabs Medical 90217 ambulatory blood pressure monitor. Blood Press Monit. 1998;3:303–307. [PubMed] [Google Scholar]


