

Abstract
Background -
Large scale, placebo controlled trials established that nonsteroidal anti-inflammatory drugs (NSAIDs) confer a cardiovascular hazard: this has been attributed to depression of cardioprotective products of cyclooxygenase (COX)-2, especially prostacyclin (PGI2). An alternative mechanism by which NSAIDs might constrain cardioprotection is by enhancing the formation of methylarginines in the kidney that would limit the action of nitric oxide (NO) throughout the vasculature.
Methods -
Targeted and untargeted metabolomics were employed to investigate the effect of COX-2 deletion or inhibition in mice and in osteoarthritis (OA) patients exposed to NSAIDs on the L-arginine/NO pathway.
Results -
Analysis of the plasma and renal metabolome was performed in postnatal tamoxifen inducible Cox-2 (iCox-2) KO mice, which exhibit normal renal function and blood pressure. This revealed no changes in arginine and methylarginines compared to their wild-type (WT) controls. Moreover, the expression of genes in the L-arginine/NO pathway was not alterated in the renal medulla or cortex of iCox-2 KO mice. Therapeutic concentrations of the selective COX-2 inhibitors, rofecoxib, celecoxib and parecoxib, none of which altered basal blood pressure or renal function as reflected by plasma creatinine, failed to elevate plasma arginine and methylarginines in mice. Finally, plasma arginine or methylarginines were not altered in OA patients with confirmed exposure to NSAIDs that inhibit COX-1 and COX-2. By contrast, plasma asymmetric dimethylarginine (ADMA) was increased in mice infused with angiotensin II (Ang II) sufficient to elevate blood pressure and impair renal function. Four weeks later, blood pressure, plasma creatinine and ADMA were restored to normal levels. The increase in ADMA in response to infusion with Ang II in celecoxib treated mice was also related to transient impairment of renal function.
Conclusions -
Plasma methylarginines are not altered by COX-2 deletion or inhibition but rather are elevated coincident with renal compromise.
Keywords: endothelium, kidney, nitric oxide, pharmacology, prostaglandins
Introduction
Cyclooxygenase (COX)-1 and COX-2 are constitutively expressed in the kidney and contribute to the regulation of renal function1, 2. COX-1 is expressed in collecting ducts, arteriolar endothelial cells, mesangial cells, and epithelial cells of the Bowman capsule; COX-2 expression is localized to the macula densa, epithelial cells lining the ascending loop of Henle, and the medullary interstitial cells of the renal papillae3. However, COX-2 may be expressed in response to inflammatory stimuli in many different cell types within the kidney 4. Prostanoids produced by both COX isozymes are involved in regulating vascular tone, glomerular filtration, electrolyte and water balance regulation and renin release 5.
Nonsteroidal anti-inflammatory drugs (NSAIDs), which inhibit the activity of the more constitutive cyclooxygenase COX-1 and the more inducible COX-2, are effectively used to relieve pain, inflammation and fever. However, their use is associated with an increased risk of gastrointestinal (GI), cardiovascular (CV) and renal adverse effects.
Traditional NSAIDs (tNSAIDs), such as ibuprofen and naproxen, inhibit both COX isozymes, rate-limiting enzymes that are involved in the biotransformation of arachidonic acid into prostanoids. These include prostaglandin (PG)E2, PGD2, PGF2α, prostacyclin (PGI2) and thromboxane (TxA2). Selective COX-2 inhibitors, such as rofecoxib and celecoxib (coxibs), were developed to reduce the incidence of serious GI events, but are more likely to cause serious CV and renal events than nonselective tNSAIDs6.
The use of all NSAIDs has been associated with dose-dependent renal side effects7. Many of the side effects are reversible upon NSAID withdrawal. However, chronic use of NSAIDs may also result in end-stage chronic renal disease, particularly in patients with other risk factors and/or on other nephrotoxic drugs.
Any change in renal function may influence the CV system; hence, alterations in hemodynamic stability and renal function by NSAIDs may also contribute to their CV side effects8. A novel link between renal COX-2 inhibition and vascular dysfunction caused by NSAID use has been recently proposed9. Ahmetaj-Shala et al.9 reported that COX-2 deletion or inhibition modified the generation of kidney-derived methylarginines and consequently adversely influenced the systemic vasculature by restraining the protective effects of nitric oxide (NO).
Methylarginine, (N-mono-methylarginine [L-NMMA], asymmetric dimethylarginine [ADMA], and symmetric dimethylarginine [SDMA]) are intracellular amino acids formed during post-translational methylation of arginine by methyltransferases. ADMA and L-NMMA, but not SDMA, are competitive inhibitors of all three forms of NO synthase (NOS) enzymes, thus limiting NO bioavailability10. Since circulating ADMA is present at higher concentrations than L-NMMA, ADMA is considered to be the principal endogenous inhibitor of NOS activity11. Elevated ADMA levels in plasma have been associated with risk factors for cardiovascular disease. ADMA levels are quantitative predictors of adverse CV outcomes12–13. Ahmetaj-Shala et al.9 reported high plasma levels of ADMA, and sometimes of L-NMMA, in conventional Cox-2 deficient mice, in mice treated with parecoxib, a selective COX-2 inhibitor, in mice lacking prostacyclin receptor (Ip) and in healthy volunteers treated with celecoxib or naproxen9. Based on these observations, it was proposed that drug induced elevation of methylarginines might explain the cardiotoxicity of NSAIDs and that plasma ADMA might serve as a biomarker of such events.
Here, using multiple genetic and pharmacological approaches to disrupt the COX-2 pathway in mice and analyzing plasma from patients taking NSAIDs, we did not observe an increase in methylarginines. By contrast, we did observe an increase in plasma ADMA in mice rendered hypertensive by infusion of angiotensin II (Ang II) at a dose that caused renal impairment, as has previously been reported14. Interestingly, after a 4-week washout period after the infusion of Ang II, blood pressure, plasma creatinine and ADMA levels all fell to normal levels. Celecoxib treated mice also exhibited increased ADMA and plasma creatinine in response to infusion of Ang II and their levels also returned to normal thereafter.
Given that conventional Cox-2 KO mice have impaired kidney function and the NSAID regimens used in mice and patients in the previous study elevated serum creatinine, it seems likely that the reported elevation in ADMA reflected renal dysfunction rather than a direct consequence of COX-2 deletion or inhibition.
Methods
The data, analytic methods, and study materials will be made available to other researchers for purposes of reproducing the results or replicating the procedure by contacting the corresponding author.
The mass-spectrometry and metabolomics data are deposited in MetaboLight database (www.ebi.ac.uk/metabolights). The raw metabolomics data are available under accession number MTBLS680, the raw mass spectrometry data are available under accession number MTBLS685.
Human subjects
Peripheral blood from donors with osteoarthritis (OA) was obtained through the Partners HealthCare Biobank, a repository of serum and plasma samples from patients who consented to link their medical records with samples for research purposes, at Partners HealthCare (Massachusetts General Hospital and Brigham and Women’s Hospital), according to institutional review board–approved protocols. We identified patients with OA by filtering for those with OA billing codes and plain radiographs of the hips or knees. To reduce the potential for confounding by other comorbidities, we excluded patients with any billing codes for diabetes, rheumatoid arthritis, cancer, or coronary artery disease. Among this set, we used natural language processing techniques in the clinical notes to identify patients who were never smokers. We restricted the sample to those who were not obese. Among this set, we identified NSAID users by prescription queries (n=174) and those who never received any NSAID prescription. We performed directed chart review to identify patients with strong evidence of a prescription NSAID around the date of blood draw (n=51). NSAID exposure confirmed by mass spectrometry assays in these samples (n=31). Some of them (n=16) presented therapeutic levels of NSAIDs and were used as NSAID case status. Controls were defined using electronic health record data restricted to the 12 months prior to blood draw as 1) OA patients without any NSAID prescription and 2) with no evidence of text mention of NSAIDs using natural language processing. Controls (n=97) had mass spectrometry assays performed and those who had no NSAID detectable were considered controls for analyses (n=16).
Human blood urea nitrogen (BUN) and creatinine measurements
Human BUN and creatinine levels were measured in plasma using a standard automated chemistry analyzer.
Animals
All animal studies were performed in accordance with the guidelines approved by the Institutional Animal Care and Use Committee (IACUC) of the University of Pennsylvania. All mice were on C57/BL6 background, unless otherwise specified. Since we observed a gender difference in the plasma and kidney metabolomes, only male mice, 8–20 week of age, were used for all experiments.
Tamoxifen inducible Cox-2 KO (Ind.Cox-2 KO) mice and their littermate controls (WT) were generated as previously reported15.
Hyperlipidemic vascular Cox-2 KO (VSMC-EC Cox-2 Ldlr KO) mice and their control (Ldlr KO) mice were generated as previously reported16. Ip KO mice17 were bred in a homozygous manner and C57/BL6 mice were used as controls.
All animals were fed ad libitum with regular chow diet, unless specified, for the course of study. Mice were kept under 12-h light/12-h dark cycle.
Study Design
Ind. Cox-2 KO study
Systolic blood pressure was measured in conscious 16 week old Ind.Cox-2 KO mice and WT by a tail-cuff system. Blood was collected from the vena cava and then plasma was analyzed for L-arginine, methylarginines and creatinine levels or for metabolomics analysis. Kidney cortex and medulla from Ind.Cox-2 KO were harvested as described previously9 and used for real-time PCR analysis of gene expression and for metabolomics analysis.
Celecoxib and rofecoxib study
12 week old C57/BL6 mice started receiving a diet containing celecoxib (100 mg/Kg body weight (BW) per day) or rofecoxib (50 mg/Kg BW per day) for 8 weeks. Celecoxib and rofecoxib were obtained from Sequoia Research Products. Drug-containing diets were prepared by Teklad laboratory. Systolic blood pressure was measured in conscious mice at the end of the study by a tail-cuff system. Blood was collected from the vena cava and, after centrifugation, plasma was analyzed for L-arginine, methylarginines and creatinine levels by mass-spectrometry and for metabolomics analysis. Kidney cortex and medulla were harvested and used for real-time PCR analysis of gene expression.
Ang II study
Ind.Cox-2 KO, WT and C57/BL6 mice (on a control diet or a celecoxib diet for three weeks) at 12–14 week of age received Ang II (1500 μg/Kg per day, Calbiochem, Darmstadt, Germany) in saline by continuous-infusion for 2 weeks. The celecoxib diet was continued during the Ang II infusion but not during the washout period. Ang II was administered subcutaneously via Alzet osmotic mini-pumps (model 2002) as described previously18. In Ind.Cox-2 KO mice and WTs, systolic blood pressure was measured in conscious mice at baseline (before Ang II administration) and at the end of the study (two weeks after starting Ang II infusion) with a computerized noninvasive tail-cuff system and calculated as described previously19. In C57/BL6 mice on a control or celecoxib diet, systolic blood pressure was measured at baseline, two weeks after starting the Ang II infusion and four weeks after the end of the Ang II infusion using a tail-cuff system.
Plasma was analyzed for L-arginine, methylarginines and creatinine levels by the mass-spectrometry.
Parecoxib study
12–14 week old C57/BL6 mice received parecoxib sodium (100 mg/Kg; Sequoia Research Products) in drinking water for four days as previously reported9. Systolic blood pressure was measured in conscious mice at baseline (before starting parecoxib administration) and at the end of the study by radiotelemetry. Plasma was analyzed for L-arginine, methylarginines and creatinine levels. Urine samples were collected at the end of the study using metabolic cages and they were analyzed for prostanoids and creatinine levels. All measurements were by mass-spectrometry.
Ip KO study
Blood was collected from the vena cava from 8–10 week old Ip KO mice and WT. Plasma samples were analyzed for L-arginine, methylarginines and creatinine levels by mass-spectrometry.
Blood pressure measurement by radiotelemetry
The implantation of radiotelemetry (model No. TA11PA-C20, DSI, MN) was performed as previously described20. Following one week of recovery, blood pressure was monitored continuously using the Dataquest LabPRO Acquisition System.
Real-time PCR analysis of gene expression
Total RNA from kidney samples was isolated using the Qiagen RNeasy Kit. Reverse transcription was performed using an RNA-cDNA kit (Applied Biosystems, Carlsbad, CA). Real-time PCR was performed using ABI Taqman primers and reagents on an ABI Prism 7500 thermocycler according to manufacturer’s instructions. The following primers were used: Cox-2 (Mm00478374_m1), Cox-1 (Mm00477214_m1), Prmt1 (Mm00480133_m1), Agxt2 (Mm01304088_m1), Ddah1 (Mm01319453_m1) and Ddah2 (Mm00516768_m1). All mRNA measurements were normalized to Gapdh (Mm99999915_g1) mRNA levels.
Mass spectrometric analysis of prostanoids
Urinary prostanoid metabolites were measured by liquid chromatography/mass spectrometry as previously described 20. Mouse urine samples were collected by using metabolic cages over an 8-hour period. Results were normalized with urinary creatinine.
Mass spectrometric analysis of plasma or urinary creatinine
Quantitation of plasma or urinary creatinine was performed using ultra high pressure liquid chromatography/tandem mass spectrometry (UPLC/MS/MS) with positive electrospray ionization and multiple reaction monitoring. Stable isotope-labeled internal standard (1mL, 2.5 μg/mL [d3]-creatinine in 3% H2O/AcN) was added to 10 μL of mouse plasma or 20 μL of mouse urine. A Shimadzu Prominence UPLC system was used for chromatography. The UPLC column was a 2.1 × 50 mm with 2.5 μm particles (Waters XBridge BEH HILIC). The Thermo Finnigan TSQ Quantum Ultra tandem instrument (Thermo Fisher Scientific) equipped with a triple quadrupole analyzer was operated in positive-mode electrospray ionization (ESI) and the analyzer was set in the MRM mode for the analysis of creatinine. The transitions for creatinine was 114>86. Quantitation was done by peak area ratio and results were normalized to the sample volume.
Mass spectrometric analysis of NSAID plasma levels
For the plasma concentrations of acetaminophen, celecoxib, naproxen, diclofenac, ibuprofen, indomethacin, rofecoxib or salicylic acid, samples were spiked with internal standards and purified by solid-phase extraction. The analysis was performed on a Waters ACQUITY Ultra Performance Liquid Chromatography (UPLC) system in-line with a Waters Xevo TQ-S Triple Quadrupole Mass Spectrometer. The UPLC system directly interfaced with the positive-mode ESI source of the mass spectrometer using multiple reaction monitoring (MRM). The transitions for salicylic acid were 136.6>93.0; for d4-salicylic acid were 140.6>97.0; for acetaminophen were 150.0>107.1; for d3-acetaminophen were 153.0>107.1; for ibuprofen were 205.3>161.2; for d3-ibuprofen were 208.3>164.2; for naproxen were 229.0>170.1; for d3-naproxen were 232.0>173.1; for diclofenac were 293.8>250.1; for d4-diclofenac were 297.8>254.1; for indomethacin were 355.9>311.9; for d4-indomethacin were 359.9>315.9; for celecoxib were 380.0>316.2; for d7-celecoxib were 387.0>323.2; for rofecoxib were 315>269 and for d5-rofecoxib were 320>273. All were monitored in negative mode. Quantitation was done by peak area ratio and results were normalized to the sample volume.
Metabolomic analysis of kidney and plasma samples
Metabolites were extracted using the methanol/chloroform/water method described previously21–22. Briefly, 100 μL of plasma or 50 μg of tissues were added to 600 μL methanol/chloroform/water (2:2:1; v/v), and the samples were homogenized with a Tissuelyser (Qiagen, UK) for 5 min at a frequency of 20/s and sonicated for 15 min. Water and chloroform (each of 200 μL) were added to the samples before being centrifuged at 13,300 rpm for 20 min. The resulting aqueous and organic phases were separated from the protein pellets. The extraction procedure was repeated on the remaining protein pellets. Both organic and aqueous phases were collected and evaporated to dryness. The dried samples were stored at −80 °C until further analysis.
Half of the aqueous extract was reconstituted in 200 μL of 10 mM ammonium acetate containing universally 13C and 15N labelled glutamic acid (Cambridge Isotope Laboratories) at a concentration of 20 μM. Chromatographic separations were performed using a C18 pentafluorophenyl UPLC column (Ace) kept at 30°C on an Ultimate 3000 UHPLC (Dionex), coupled with a TSQ Quantiva (Thermo Scientific) triple quadrupole mass spectrometer. The temperature of the autosampler was set to 7°C. The mobile phase consisted of solvent A: 0.1 % formic acid in HPLC grade water (Sigma-Aldrich) and solvent B: 0.1 % formic acid in acetonitrile (Sigma-Aldrich). When eluting the column the following gradient was used: initial conditions were 100 % A held for 1.5 min followed by a linear gradient with increase of B to 100 % at 4.5 min with re-equilibration for 1.5 min giving a total run time of 6 min with a flow rate of 400 μL/min. The injection volume was 2 μL. Samples were analysed using a MRM approach. The ionisation mode used by the mass spectrometer was electro spray ionisation with a capillary voltage of 3.5kV for positive ion mode and 2.5 kV for negative ion mode. All compound dependent parameters were established using the Quantiva automatic optimisation protocol infusion with standards of the relevant compounds.
For quantitative analysis, acquired data was processed with Xcalibur 2.0 (Thermo Scientific). Peaks of each analyte and internal standard were detected and integrated. Each analyte was normalized to the internal standard. 56 analytes were measured in plasma and 66 analytes were measured in tissue (Suppl. Table 1 and 2).
Quantification of L-arginine and methylarginines
L-arginine and methylarginines were quantified using liquid chromatography tandem mass spectrometry. Briefly, two internal standards (deuterium [d7]-labeled ADMA, Cambridge Isotope Laboratories and 13C6-labeled L-arginine) were added to 50 μL of biological samples (mouse or human plasma) before precipitation in 2:1 volumes of methanol:chloroform. After 15 minutes sonication, 100 μL of water and 100 μL of chloroform were added and the samples centrifuged (13,300 rpm for 7 minutes at 4°C). 200 μL of the supernatant was vacuum dried for 2 hours using a refrigerated vacuum dryer and the residue re-suspended in 10:90 water: acetonitrile for analysis. Liquid chromatography tandem mass spectrometry was performed using a Waters Xevo-TQ-Smicro mass spectrometer coupled to an Acquity UPLC chromatography system. A Waters BEH Amide column was used and the mobile phase consisted of solvent A: 95:5 HPLC Water:Acetonitrile, 2mM Ammonium Acetate, 0.2% Formic Acid and solvent B: 90:10 HPLC Acetonitrile:Water, 2mM Ammonium Acetate, 0.2% Formic Acid. When eluting the column, the following gradient was used: initial conditions were 100% B with a linear increase of A to 79.4% at 15.5 min and at 100% at 15.5 min. Conditions were kept with A at 100% until 20.5 min, with a return to 100% B at 22 min, that was kept until 30 min. The initial flow rate was 0.35 mL/min, lowered to 0.3 mL/min between 15.50 and min and 23.50 min, and raised to 0.5 mL/min between 25 min and 30 min.The mass spectrum parameters were as follows: ADMA, mass-to-charge ratio (m/z): 203.17 to 46.03, collision energy (CE): 14; SDMA, m/z: 203.17 to 70.19, CE: 20; NMMA, m/z: 189.16 to 70.07, CE: 18; arginine, m/z: 175.14 to 60.05, CE: 12; d6-ADMA, m/z: 209.18 to 52.09, CE: 14; 13C6 arginine m/z: 181.13 to 61.02, CE: 14. Standard curves were generated for each substance of interest. L-arginine and methylarginines were obtained from Sigma.
Statistical Analysis
Unless otherwise indicated, between-group comparison was performed using the non-parametric Mann–Whitney test or non-parametric one-way ANOVA. All the comparisons were made between animals of the same age and gender on the same genetic background. Spearman correlation was used to relate plasma creatinine to ADMA levels. Results of the statistical analyses of metabolomics data were corrected for multiple testing within each tissue/experiment by the Benjamini-Hochberg procedure, as implemented by the p.adjust function in R. Heatmaps were generated in R using the ggplot2 package23. The abundances of each metabolite were mapped to a common scale in each heatmap as follows: first, the means and standard deviations of abundances across all samples were calculated separately for each metabolite. Second, the mean abundances across samples within each experimental group (i.e. control, celecoxib-treated, rofecoxib-treated, WT, iCox-2 KO) were calculated separately for each metabolite. Third, these experimental group means were normalized into Z-scores by subtracting the all-sample means and dividing the result by the all-sample standard deviations. Again, this procedure was performed separately for each metabolite. For display purposes, any Z-scores greater than 2 or less than −2 were set to 2 and −2, respectively.
Results
Effect of postnatal Cox-2 deletion on the plasma and kidney metabolomes
We injected iCox-2 KO male mice and WT with tamoxifen at 8 weeks of age15 and performed the metabolomics experiments at 16–20 weeks.
Cox-1 expression remained unchanged while Cox-2 expression was significantly reduced 15 fold in the medulla and 8 fold in the cortex in the iCox-2 KO mice (Fig. 1A and B). The metabolomic profile of plasma, medulla and cortex did not reveal significant changes between WT and iCox-2 KO mice (Fig. 1 C, D and E). Postnatal Cox2 deletion caused an up-regulation of Ddah1in the medulla but not of other genes (Prmt1, Agxt2 and Ddah2) of the L-arginine/NO pathway in the kidney medulla or cortex (Suppl. Fig. 1 A-D) and the levels of plasma methylarginines were similar in WT and iCox-2 KO mice (Suppl. Fig. 1 E-H). Methylarginines in the cortex and medulla also did not differ between WT and iCox-2 KO mice (Fig. 1 D and E).
Figure 1.
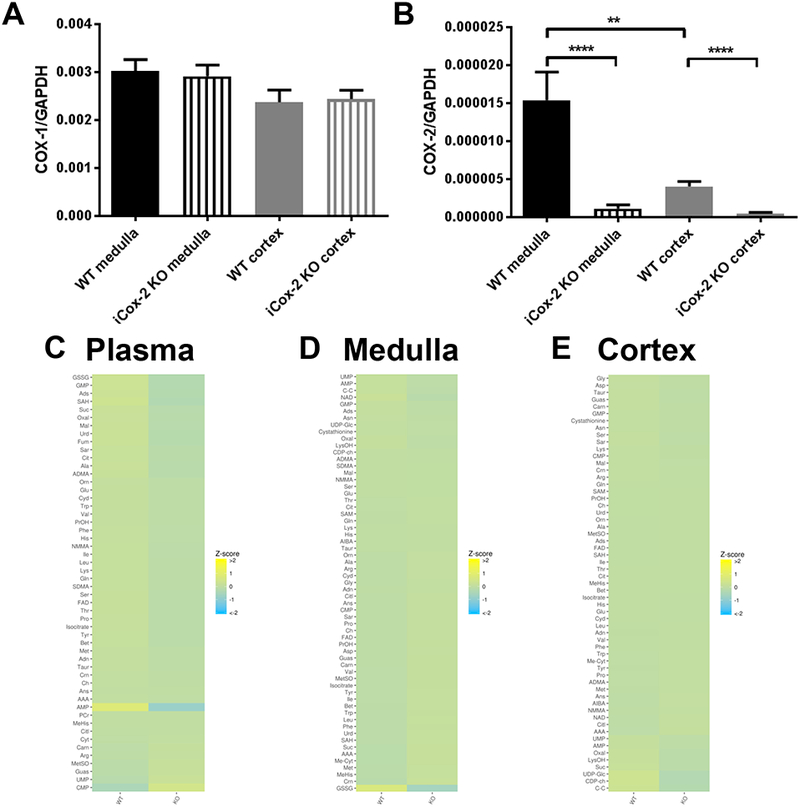
Effect of postnatal Cox-2 deletion on the plasma and kidney metabolomes.
A) Expression of Cox-1 in kidney medulla and cortex of wild-type (WT) and iCox-2 KO mice. B) Expression of Cox-2 in kidney medulla and cortex of WT and iCox-2 KO mice. C) Heatmap representation of 56 metabolites measured in plasma from WT and Cox-2 KO mice, n=8. D) Heatmap representation of 66 metabolites measured in renal medulla from WT and Cox-2 KO mice, n=8–9. E) Heatmap representation of 66 metabolites measured in renal cortex from WT and Cox-2 KO mice (KO), n=8–9; Data in A and B are mean±SEM, n=10–11; **p<0.01 ****p<0.0001.
These latter observations were replicated in an independent cohort of mice of the same age (Suppl. Fig. 1 I-L).
In contrast to the renal impairment in conventional Cox-2 KO mice24, plasma creatinine level, a measure of kidney function, did not differ between WT and iCox-2 KO mice (0.621 ± 0.071 and 0.684 ± 0.108 creatinine μg/ml plasma, respectively in WT and iCox-2 KO mice, mean±SEM, n= 5–7). Basal systolic blood pressure was also similar in WT (118.8 ± 2.2 mmHg, mean±SEM, n=6) and iCox-2 KO mice (116.8 ± 3.8 mmHg, mean±SEM, n=4).
Effect of selective COX-2 inhibition on the plasma and kidney metabolomes
The plasma metabolomic profile was characterized in WT mice that received control, celecoxib (100mg/Kg BW per day) or rofecoxib diets (50 mg/Kg BW per day) for two months before they were sacrificed. These drug regimens cause selective inhibition of COX-2 in vivo 19, 25 and result in therapeutic drug plasma concentrations (0.74 ± 0.24μM and 0.53 ± 0.03μM, respectively for celecoxib and rofecoxib; mean±SEM, n=5). Furthermore, plasma creatinine did not differ between the groups (0.22 ± 0.05; 0.52 ± 0.32; 0.28 ± 0.04 creatinine/glutamate, respectively in control, celecoxib and rofecoxib group; mean±SEM, n= 5). Similarly, systolic blood pressure was not altered by treatment with celecoxib and rofecoxib (112.2 ± 4.4; 115.2 ± 4.9; 117.8 ± 2.1 mmHg, respectively in control, celecoxib and rofecoxib group; mean±SEM, n=5).
Neither drug altered COX-1 expression in the kidney cortex or medulla but they both increased Cox-2 expression in the cortex (Fig. 2 A and B). The metabolomic profile of plasma did not reveal significant changes between the three groups (Fig. 2 C). Moreover, celecoxib and rofecoxib did not have an impact on the expression of genes of the L-arginine/NO pathway in the kidney medulla and cortex (Suppl. Fig. 2 A-D) or on the levels of plasma methylarginines (Suppl. Fig. 2 E-H).
Figure 2.

Effect of selective COX-2 inhibition on the plasma and kidney metabolomes.
A) Expression of Cox-1 in kidney medulla and cortex of mice treated with control, celecoxib or rofecoxib diet for 2 months. B) Expression of Cox-2 in kidney medulla and cortex of mice treated with control, celecoxib or rofecoxib diet for 2 months. C) Heatmap representation of 56 metabolites measured in plasma from mice treated with control, celecoxib or rofecoxib diet for 2 months, n=5. Data in A and B are mean±SEM, n=5; *p<0.05.
Effect of parecoxib on methylarginines
The treatment of mice with parecoxib (100mg/ Kg BW per day) for four days caused selective inhibition of COX-2 as reflected by a significant reduction of PGIM, an index of COX-2 activity, (2.9±0.3 and 2.1±0.1 PGIM ng/mg creatinine, respectively in vehicle and parecoxib group; mean±SEM, n=4–5; *p<0.05; Fig. 3 A) but no effect on TXBM, an index of COX-1 activity (21.26±3.13 and vs 22.22±1.68 TXBM ng/mg creatinine, respectively in vehicle and parecoxib group; mean±SEM, n=4–5; Fig. 3 B). In the same setting, parecoxib had no significant effect on systolic blood pressure in the active phase (129.4 ±13.7 and 118.3±9.3 mmHg, respectively in vehicle and parecoxib group; mean±SEM, n=4–5) or in the resting phase (105.9 ±8.2 and 100.3±8.6 mmHg, respectively in vehicle and parecoxib group; mean±SEM, n=4–5; Fig. 3 C). As seen with celecoxib and rofecoxib, COX-2 inhibition induced by parecoxib did not alter plasma arginine and methylarginines levels (Fig. 3 D-G) or plasma creatinine (1.15± 0.15 and 0.98 ± 0.15 μg/ml creatinine, respectively in control and parecoxib treated mice; mean±SEM, n=4–5).
Figure 3.
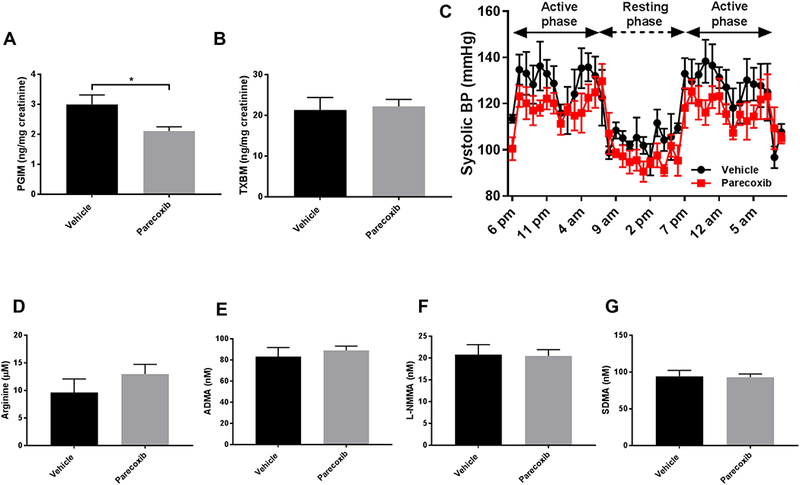
Effect of parecoxib on methylarginines.
Urinary prostacyclin (PGIM, A) and thromboxane (TXBM, B) metabolites in WT mice treated with vehicle or parecoxib (100 mg/Kg) in drinking water for 4 days. Systolic blood pressure measured in WT mice treated with vehicle or parecoxib (100 mg/Kg) in drinking water for 4 days (C). Plasma level of L-Arginine (D), ADMA (E), L-NMMA (F) and SDMA (G) in WT mice treated with vehicle or parecoxib treated mice. Data are mean±SEM, n=4; *p<0.05.
Effect of Ang II induced hypertension on methylarginines in mice
Infusion of Ang II for two weeks caused a significant increase in systolic blood pressure that reverted to baseline after a four week washout period in the control but not in celecoxib- treated mice (106.1 ±6.5; 146.4±6.4 and 107.2±6.4 mmHg, respectively at baseline, two and six weeks after Ang II in control group; mean±SEM, n=5–9; Fig. 4 A; 104.3 ±3.4, 154.4±6.2 and 119.6±3.6 mmHg, respectively at baseline, two and six weeks after Ang II in celecoxib group; mean±SEM, n=3–7; Fig. 4 B). Plasma ADMA (82.3± 3.9; 117.4 ± 5.9 and 89.1 ± 5.3 nM, respectively at baseline, two and six weeks after Ang II in control group, mean±SEM, n= 5–12, and 89.0± 6.2, 109.5± 3.8 and 82.5 ± 8.5 nM, respectively at baseline, two and six weeks after Ang II in celecoxib group, mean±SEM, n= 3–15; Fig. 4 C, D) and plasma creatinine (0.60± 0.02, 0.91 ± 0.07 and 0.60 ± 0.06 μg/ml plasma respectively at baseline, two and six weeks after Ang II in control group, mean±SEM, n= 5–12, and 0.61± 0.03, 1.12± 0.11 and 0.53 ± 0.06 nM, respectively at baseline, two and six weeks after Ang II in celecoxib group, mean±SEM, n= 3–15; Fig. 4 E, F) were elevated by the infusion with Ang II and returned to normal levels after the washout period in both control and celecoxib treated mice. We observed a positive correlation between plasma creatinine and ADMA levels (Suppl. Fig. 3).
Figure 4.

Effect of angiotensin II induced hypertension on plasma ADMA and creatinine levels. Systolic blood pressure (A), ADMA (C) and creatinine (E) in normotensive and hypertensive C57/BL6 mice on a control diet. Data are mean±SEM, n=5–12. Systolic blood pressure (B), ADMA (D) and creatinine (F) in normotensive and hypertensive C57/BL6 mice on a celecoxib diet. Data are mean±SEM, n=3–15; *p<0.05M **p<0.01 ***p<0.001.
Effect of postnatal Cox-2 deletion on methylarginines in hypertensive mice
Ind.Cox-2 KO mice and their littermate controls were made hypertensive by Ang II infusion for two weeks. The increase in systolic blood pressure was not different between WT and Ind.Cox-2 KO mice after Ang II infusion (153.8 ± 5.5 and 143.1 ± 6.0 mmHg, respectively in control and Ind.Cox-2 KO mice; mean±SEM, n=6). The level of L-arginine and methylarginines in hypertensive mice were unaltered by genotype (Fig. 5 A-D). Moreover, there was no difference in plasma creatinine level between WT and Ind.Cox-2 KO mice after Ang II infusion (1.177± 0.122 and 1.185 ± 0.119 μg/ml plasma respectively; mean±SEM, n= 6).
Figure 5.
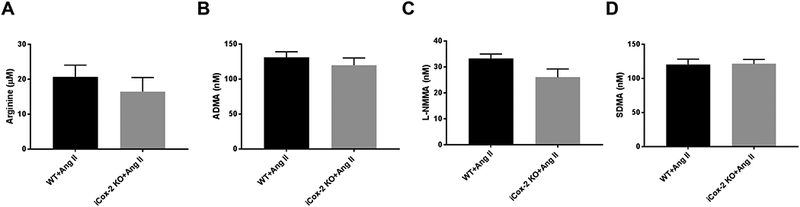
Effect of postnatal Cox-2 deletion on methylarginines in hypertensive mice. Level of L-Arginine (A), ADMA (B), L-NMMA (C) and SDMA (D) in plasma from hypertensive WT and iCox-2 KO mice. Data are mean±SEM, n=6.
Effect of vascular Cox-2 deletion on methylarginines
Male mice lacking Cox-2 in vascular cells (VSMC/EC Cox-2 Ldlr KO) on a high fat diet for 3 months had elevated systolic blood pressure compared to Ldlr KO controls16. Plasma creatinine levels were about 10 % lower in the VSMC/EC Cox-2 Ldlr KO mice compared to their controls (0.865 ± 0.030 and 0.763 ± 0.022 μg/ml creatinine, respectively in Ldlr KO and in VSMC/EC Cox-2 Ldlr KO, mean±SEM, n=17; **p<0.01). Deletion of Cox-2 in vascular cells had no effect on the plasma level of ADMA, but it caused a significant increase of L-arginine (13.54± 1.19 and 17.76± 0.85 μM, respectively in Ldlr KO and VSMC/EC Cox-2 Ldlr KO, mean±SEM, n=17; **p<0.01) and L-NMMA (47.41± 2.97 and 61.88± 2.72 nM, respectively in Ldlr KO and VSMC/EC Cox-2 Ldlr KO, n=17; ***p<0.005) and a reduction of SDMA (66.38± 4.01and 49.14± 2.21 nM, respectively in Ldlr KO and VSMC/EC Cox-2 Ldlr KO, mean±SEM, n=17; ***p<0.005) as shown in Fig. 6 A-D.
Figure 6.
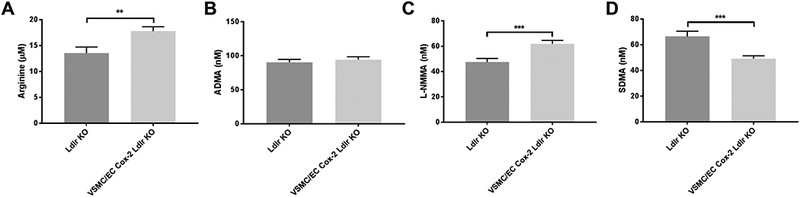
Effect of vascular Cox-2 deletion on methylarginines. Plasma level of L-Arginine (A), ADMA (B), L-NMMA (C) and SDMA (D) in VSMC-EC Ldlr Cox-2 KO mice and their controls (Ldlr KO) on high fat diet for three months. Data are mean±SEM, n=17; **p<0.01 ***p<0.001.
Effect of Ip deletion on methylarginines
Unperturbed mice lacking the prostacyclin receptor (Ip) are normotensive and do not develop spontaneous thrombosis although they are sensitive to thrombogenic and hypertensive stimuli25–26. Deletion of the Ip had no effect on the plasma levels of L-arginine and methylarginines (Fig. 7 A-D) or on plasma creatinine (0.861± 0.065 and 0.888± 0.052 μg/ml creatinine respectively in male WT and Ip KO; mean±SEM, n=3) in these mice.
Figure 7.

Effect of prostacyclin receptor (Ip) deletion on methylarginines. Plasma level of L-Arginine (A), ADMA (B), L-NMMA (C) and SDMA (D) in male Ip KO mice and their controls (WT); Data are mean±SEM, n=3.
Effect of NSAID exposure on methylarginines in OA patients
We characterized methylarginines (ADMA, L-NMMA and SDMA) in the plasma samples of male OA patients obtained from the Partners HealthCare Biobank. We sought their exposure to NSAIDs by measuring the plasma concentration of the seven most commonly consumed NSAIDs (acetaminophen, celecoxib, naproxen, diclofenac, ibuprofen, indomethacin, naproxen and salicylic acid) by mass-spectrometry. We identified 16 patient plasma samples that contained therapeutic levels of one or more NSAIDs (1 acetaminophen; 2 acetaminophen +aspirin; 1 acetaminophen +celecoxib; 1 acetaminophen +ibuprofen; 7 naproxen; 2 naproxen+aspirin; 1 naproxen+ibuprofen; 1 diclofenac) and 16 patients with clinically comparable disease that were not exposed to NSAIDs (Suppl. Table 3).
Consistent with our data in mice, the treatment with NSAIDs in these OA patients with normal renal function, as reflected by plasma creatinine and BUN, did not alter plasma levels of L-arginine or methylarginines (Table 1).
Table 1.
Plasma L-arginine, methylarginines, creatinine and blood nitrogen urea (BUN) levels in osteoarthritis male patients taking (NSAID group) or not taking NSAID (Control group).
| L-Arginine (μM) |
ADMA (nM) |
L-NMMA (nM) |
SDMA (nM) |
Creatinine (mg/dl) |
BUN (mg/dl) |
|
|---|---|---|---|---|---|---|
| Control (16) | 22.3±2.3 | 107.6±4.5 | 34.3±0.6 | 304.5±11.0 | 0.82±0.06 | 15.07±1.18 |
|
NSAID
(16) |
21.0±1.9 | 104.7±4.1 | 37.0±1.6 | 280.5±19.2 | 0.82±0.03 | 16.31±1.39 |
Discussion
Large scale, placebo controlled trials established that NSAIDs selective for inhibition of COX-2 confer a cardiovascular hazard6. Deep phenotyping studies of drug response in humans and both genetic and pharmacological perturbation of the COX-2 pathway in mice reveal that suppression of cardioprotective prostaglandins, such as PGI2 and PGE2, affording a mechanistic explanation for this hazard19. Depletion of COX-2 in vascular cells in mice increases their response to thrombogenic and hypertensive stimuli coincident with depression of PGI2 biosynthesis as reflected by urinary PGIM20. Similarly, depression of the same urinary biomarker in the absence of coincident platelet inhibition by treatment with celecoxib or rofecoxib in humans underlay the initial prediction of the cardiovascular adverse effects of NSAIDs. At the outset, it was suggested that other endogenous cardioprotective mechanisms, such as the vascular elaboration of NO, might compensate for the reduction in PGI2. However, various manipulations that disrupted the COX-2/PGI2/IP synthesis/response pathway yielded adverse cardiovascular phenotypes15, 17, 26–28. Furthermore, depletion of COX-2 in vascular cells yielded the surprising observation that eNOS expression was regulated by COX-2 dependent PGI2 formation20. The depression of vascular NO release with COX-2 depletion could be rescued with a PGI2 analog. Thus, rather than NO compensating for the vascular consequence of inhibiting PGI2 formation, reduced expression of eNOS is a secondary effect, likely to amplify the consequence of COX inhibition20.
Recently, an alternative mechanism by which NSAIDs might constrain cardioprotection by NO has been proposed – drug dependent enhanced formation of methylarginines in the kidney that would limit the action of NO throughout the vasculature9. Several approaches were taken to address this hypothesis including the detection of elevated methylarginines and, in some cases elevated expression of genes of the L-arginine/ NO pathway, in conventional Cox-2 KO mice, mice administered the selective COX-2 inhibitor parecoxib and in healthy volunteers treated with NSAIDs. Elevated methylarginines were associated with impaired vascular relaxation ex vivo in conventional Cox-2 KOs and a reduction in the difference in blood pressure between the active and resting phases in parecoxib treated mice. Based on these observations, it was proposed that drug induced elevation of methylarginines might explain the cardiotoxicity of NSAIDs and that plasma ADMA might serve as a biomarker of such events. However, COX-2 plays an important role during development and conventional Cox-2 KO mice exhibit myocardial fibrosis, hypertension and glomerulosclerosis26–27. Although plasma creatinine was not reported in the experiments using parecoxib, plasma creatinine was elevated in this study in conventional Cox-2 KO mice, in the Ip KO mice and the healthy volunteers consuming NSAIDs who exhibited the elevation in methylarginines.
To address the hypothesis that the increase in methylarginines reflected diminished renal clearance rather than a direct consequence of drug action, we studied the broader plasma and renal metabolome in iCox-2 KO mice and VSMC/EC Cox-2 Ldlr KO mice, both of which exhibit normal renal function. We also exposed mice to therapeutic concentrations of rofecoxib, celecoxib and parecoxib, none of which altered renal function as reflected by plasma creatinine or elevated basal blood pressure. Finally, we sought evidence for an elevation in plasma methylarginines in OA patients with confirmed exposure to NSAIDs that inhibit COX-1 and COX-2. In these diverse settings of COX-2 depletion or inhibition, but in the presence of normal renal function as reflected by plasma creatinine, we found no systematic impact on blood pressure, plasma arginine or methylarginines or on the expression of genes (Prmt1, Agxt2 and Ddah2) of the L-arginine/NO pathway in the renal medulla or cortex in the mice. By contrast, elevating blood pressure in WT mice by infusing Ang II impaired renal function and elevated plasma ADMA as previously described14. Interestingly, after a 4-week washout period of Ang II, blood pressure, plasma creatinine and ADMA levels were restored to normal levels. Celecoxib treated mice also elevated both ADMA and plasma creatinine levels in response to infusion of Ang II but they fell to normal after washout. The lack of a direct effect of celecoxib on ADMA is consistent with data recently reported in an experimental model of rheumatoid arthritis29.
Thus, in the setting of normal plasma creatinine, we were unable to detect an increase in plasma methylarginines consequent to COX-2 deletion or inhibition. It seems likely that the observations of Ahmetaj-Shala et al.9 reflect the renal compromise evident in conventional Cox-2 KO mice, in their Ip KO mice and in the patients consuming NSAIDs that they studied. Indeed, consistent with this likelihood, we observed a positive correlation between plasma creatinine and ADMA levels in the present studies. The dominant mechanism by which NSAIDs confer a cardiovascular hazard is by depression of cardioprotective products of COX-2, especially PGI2.
Supplementary Material
Clinical Perspective.
What is new?
Elevated plasma ADMA was reported when COX-2 is deleted before birth or inhibited with NSAIDs in mice and healthy volunteers. In these settings, COX-2 deletion or inhibition was associated with kidney dysfunction.
Here we show that, in diverse settings of COX-2 depletion or inhibition in mice and in humans, ADMA is unaltered in the presence of normal renal function as reflected by plasma creatinine.
ADMA and creatinine levels are elevated together when blood pressure is elevated by Ang II in mice subject to Cox-2 depletion or inhibition. ADMA falls to normal as does renal function after washout of Ang II.
What are the clinical implications?
The previous report of elevated ADMA reflected impaired renal function rather than a direct consequence of COX-2 deletion or inhibition.
ADMA could be elevated by NSAIDs in the setting of renal dysfunction. However, even in such patients, the clinical consequences of this modest increase remain to be determined.
The most plausible mechanism by which NSAIDs confer a cardiovascular hazard is by suppression of COX-2 derived cardioprotective prostaglandins, particularly PGI2.
Acknowledgements
We thank Weili Yan, University of Pennsylvania, for the technical assistance. We thank the patients who consented to the Partners HealthCare Biobank for providing samples and linked electronic health record data.
Garret A. FitzGerald is the McNeil Professor of Translational Medicine and Therapeutics.
Sources of Funding
This work was supported by NIH grant U54 HL117798 to Garret A. FitzGerald. The content is solely the responsibility of the authors and does not necessarily represent the official views of the NIH.
Footnotes
Disclosures
None.
References
- 1.Grosser T, Yu Y, FitzGerald GA. Emotion recollected in tranquility: lessons learned from the COX-2 saga. Annu Rev Med. 2010;61:17–33. [DOI] [PubMed] [Google Scholar]
- 2.Breyer MD, Harris RC. Cyclooxygenase 2 and the kidney. Curr Opin Nephrol Hypertens. 2001;10:89–98. [DOI] [PubMed] [Google Scholar]
- 3.FitzGerald GA, Patrono C. The coxibs, selective inhibitors of cyclooxygenase-2. N Engl J Med 2001;345:433–442. [DOI] [PubMed] [Google Scholar]
- 4.Fitzpatrick FA, Soberman R. Regulated formation of eicosanoids. J Clin Invest 2001;107:1347–1351. [DOI] [PMC free article] [PubMed] [Google Scholar]
- 5.Rios A, Vargas-Robles H, Gámez-Méndez AM, Escalante B. Cyclooxygenase-2 and kidney failure. Prostaglandins Other Lipid Mediat 2012;98:86–90. [DOI] [PubMed] [Google Scholar]
- 6.Grosser T, Ricciotti E, FitzGerald GA. The Cardiovascular Pharmacology of Nonsteroidal Anti-Inflammatory Drugs. Trends Pharmacol Sci. 2017;38:733–748. [DOI] [PMC free article] [PubMed] [Google Scholar]
- 7.Harirforoosh S, Jamali F. Renal adverse effects of nonsteroidal anti-inflammatory drugs. Expert Opin Drug Saf. 2009;8:669–681. [DOI] [PubMed] [Google Scholar]
- 8.Grosser T, Fries S, FitzGerald GA. Biological basis for the cardiovascular consequences of COX-2 inhibition: therapeutic challenges and opportunities. J Clin Invest. 2006;116:4–15. [DOI] [PMC free article] [PubMed] [Google Scholar]
- 9.Ahmetaj-Shala B, Kirkby NS, Knowles R, Al’Yamani M, Mazi S, Wang Z, Tucker AT, Mackenzie L, Armstrong PC, Nüsing RM, Tomlinson JA, Warner TD, Leiper J, Mitchell JA. Evidence that links loss of cyclooxygenase-2 with increased asymmetric dimethylarginine: novel explanation of cardiovascular side effects associated with anti-inflammatory drugs. Circulation 2015;131:633–642. [DOI] [PMC free article] [PubMed] [Google Scholar]
- 10.Vallance P, Leone A, Calver A, Collier J, Moncada S. Endogenous dimethylarginine as an inhibitor of nitric oxide synthesis. J Cardiovasc Pharmacol 1992;20 Suppl 12:S60–62. [DOI] [PubMed] [Google Scholar]
- 11.Vallance P, Leone A, Calver A, Collier J, Moncada S. Accumulation of an endogenous inhibitor of nitric oxide synthesis in chronic renal failure. Lancet 1992; 339:572–575. [DOI] [PubMed] [Google Scholar]
- 12.Caplin B, Leiper J. Endogenous nitric oxide synthase inhibitors in the biology of disease: markers, mediators, and regulators? Arterioscler Thromb Vasc Biol. 2012;32:1343–1353. [DOI] [PMC free article] [PubMed] [Google Scholar]
- 13.Leiper J, Nandi M. The therapeutic potential of targeting endogenous inhibitors of nitric oxide synthesis. Nat Rev Drug Discov. 2011;10:277–291. [DOI] [PubMed] [Google Scholar]
- 14.Hasegawa K, Wakino S, Tatematsu S, Yoshioka K, Homma K, Sugano N, Kimoto M, Hayashi K, Itoh H. Role of asymmetric dimethylarginine in vascular injury in transgenic mice overexpressing dimethylarginie dimethylaminohydrolase 2. Circ Res. 2007;101:e2–e10. [DOI] [PubMed] [Google Scholar]
- 15.Yu Z, Crichton I, Tang SY, Hui Y, Ricciotti E, Levin MD, Lawson JA, Puré E, FitzGerald GA. Disruption of the 5-lipoxygenase pathway attenuates atherogenesis consequent to COX-2 deletion in mice. Proc Natl Acad Sci U S A. 2012;109:6727–6732. [DOI] [PMC free article] [PubMed] [Google Scholar]
- 16.Tang SY, Monslow J, Todd L, Lawson J, Puré E, FitzGerald GA. Cyclooxygenase-2 in endothelial and vascular smooth muscle cells restrains atherogenesis in hyperlipidemic mice. Circulation. 2014;129:1761–1769. [DOI] [PMC free article] [PubMed] [Google Scholar]
- 17.Cheng Y, Austin SC, Rocca B, Koller BH, Coffman TM, Grosser T, Lawson JA, FitzGerald GA. Role of prostacyclin in the cardiovascular response to thromboxane A2. Science. 2002;296:539–541. [DOI] [PubMed] [Google Scholar]
- 18.Wang M, Lee E, Song W, Ricciotti E, Rader DJ, Lawson JA, Puré E, FitzGerald GA. Microsomal prostaglandin E synthase-1 deletion suppresses oxidative stress and angiotensin II-induced abdominal aortic aneurysm formation. Circulation. 2008;117:1302–1309. [DOI] [PubMed] [Google Scholar]
- 19.Cheng Y, Wang M, Yu Y, Lawson J, Funk CD, Fitzgerald GA. Cyclooxygenases, microsomal prostaglandin E synthase-1, and cardiovascular function. J Clin Invest. 2006;116:1391–1399. [DOI] [PMC free article] [PubMed] [Google Scholar]
- 20.Yu Y, Ricciotti E, Scalia R, Tang SY, Grant G, Yu Z, Landesberg G, Crichton I, Wu W, Puré E, Funk CD, FitzGerald GA. Vascular COX-2 modulates blood pressure and thrombosis in mice. Sci Transl Med. 2012;4:132ra54. [DOI] [PMC free article] [PubMed] [Google Scholar]
- 21.Wang X, West JA, Murray AJ, Griffin JL. Comprehensive Metabolic Profiling of Age-Related Mitochondrial Dysfunction in the High-Fat-Fed ob/ob Mouse Heart. J Proteome Res. 2015;14:2849–2862. [DOI] [PubMed] [Google Scholar]
- 22.West JA, Beqqali A, Ament Z, Elliott P, Pinto YM, Arbustini E, Griffin JL. A targeted metabolomics assay for cardiac metabolism and demonstration using a mouse model of dilated cardiomyopathy. Metabolomics. 2016;12:59. [DOI] [PMC free article] [PubMed] [Google Scholar]
- 23.Wickham H. Elegant Graphics for Data Analysis. Springer-Verlag; New York, 2009. [Google Scholar]
- 24.Zhang MZ, Wang JL, Cheng HF, Harris RC, McKanna JA. Cyclooxygenase-2 in rat nephron development. Am J Physiol. 1997;273:F994–1002. [DOI] [PubMed] [Google Scholar]
- 25.Marzoll A, Nagy N, Wördehoff L, Dai G, Fries S, Lindner V, Grosser T, Fischer JW. Cyclooxygenase inhibitors repress vascular hyaluronan-synthesis in murine atherosclerosis and neointimal thickening. J Cell Mol Med. 2009;13:3713–3719. [DOI] [PMC free article] [PubMed] [Google Scholar]
- 26.Murata T, Ushikubi F, Matsuoka T, Hirata M, Yamasaki A, Sugimoto Y, Ichikawa A, Aze Y, Tanaka T, Yoshida N, Ueno A, Oh-ishi S, Narumiya S. Altered pain perception and inflammatory response in mice lacking prostacyclin receptor. Nature 1997;388:678–682. [DOI] [PubMed] [Google Scholar]
- 27.Francois H, Athirakul K, Howell D, Dash R, Mao L, Kim HS, Rockman HA, Fitzgerald GA, Koller BH, Coffman TM. Prostacyclin protects against elevated blood pressure and cardiac fibrosis. Cell Metab. 2005;2:201–207. [DOI] [PubMed] [Google Scholar]
- 28.Egan KM, Lawson JA, Fries S, Koller B, Rader DJ, Smyth EM, Fitzgerald GA. COX-2-derived prostacyclin confers atheroprotection on female mice. Science. 2004;306:1954–1957. [DOI] [PubMed] [Google Scholar]
- 29.Verhoeven F, Totoson P, Marie C, Prigent-Tessier A, Wendling D, Tournier-Nappey M, Prati C, Demougeot C. Diclofenac but not celecoxib improves endothelial function in rheumatoid arthritis: A study in adjuvant-induced arthritis. Atherosclerosis. 2017;266:136–144. [DOI] [PubMed] [Google Scholar]
Associated Data
This section collects any data citations, data availability statements, or supplementary materials included in this article.